Process memory device in Linux OS. Collecting dumps using a hypervisor

Hi all! I'm Evgeniy Birichevsky, I work in malware detection at Positive Technologies.
Sometimes, to analyze malware or, for example, to debug a process, a process memory dump may be required. But how to build it without a debugger? We will try to answer this question in the article.
Tasks:
State the purpose of collecting a process dump.
Describe the process memory structure in Linux and note the differences in the old and new versions of the OS kernel.
Consider taking a process memory dump inside a virtual machine based on a hypervisor bundle Xen and open source framework DRAKVUF.
What is a memory dump and why is it needed?
Memory dump process – a saved copy of the memory contents of one process at a specific point in time. Inside, in addition to a copy of the executable file itself, there may be various libraries that are used by the process during execution, as well as additional information about the process. In Linux, a memory dump is called coreon Windows – minidump.
Quite often, malicious software (malware) is packaged or obfuscated before execution in order to avoid detection by an antivirus. A process memory dump can help remove simple packaging or obfuscation (such as UPX or its derivatives that cannot be removed by the standard utility). If the malware is completely unpacked in memory during execution, then you can take a dump of it and extract a “clean” version of the malware from it, or scan the dump directly with static signatures (for example, using YARA).
As an example we can consider sample from articles with an algorithm for unpacking a custom version of UPX. Let's run the sample in an isolated VM, take its dump, and then open both files in a disassembler (Figure 1).
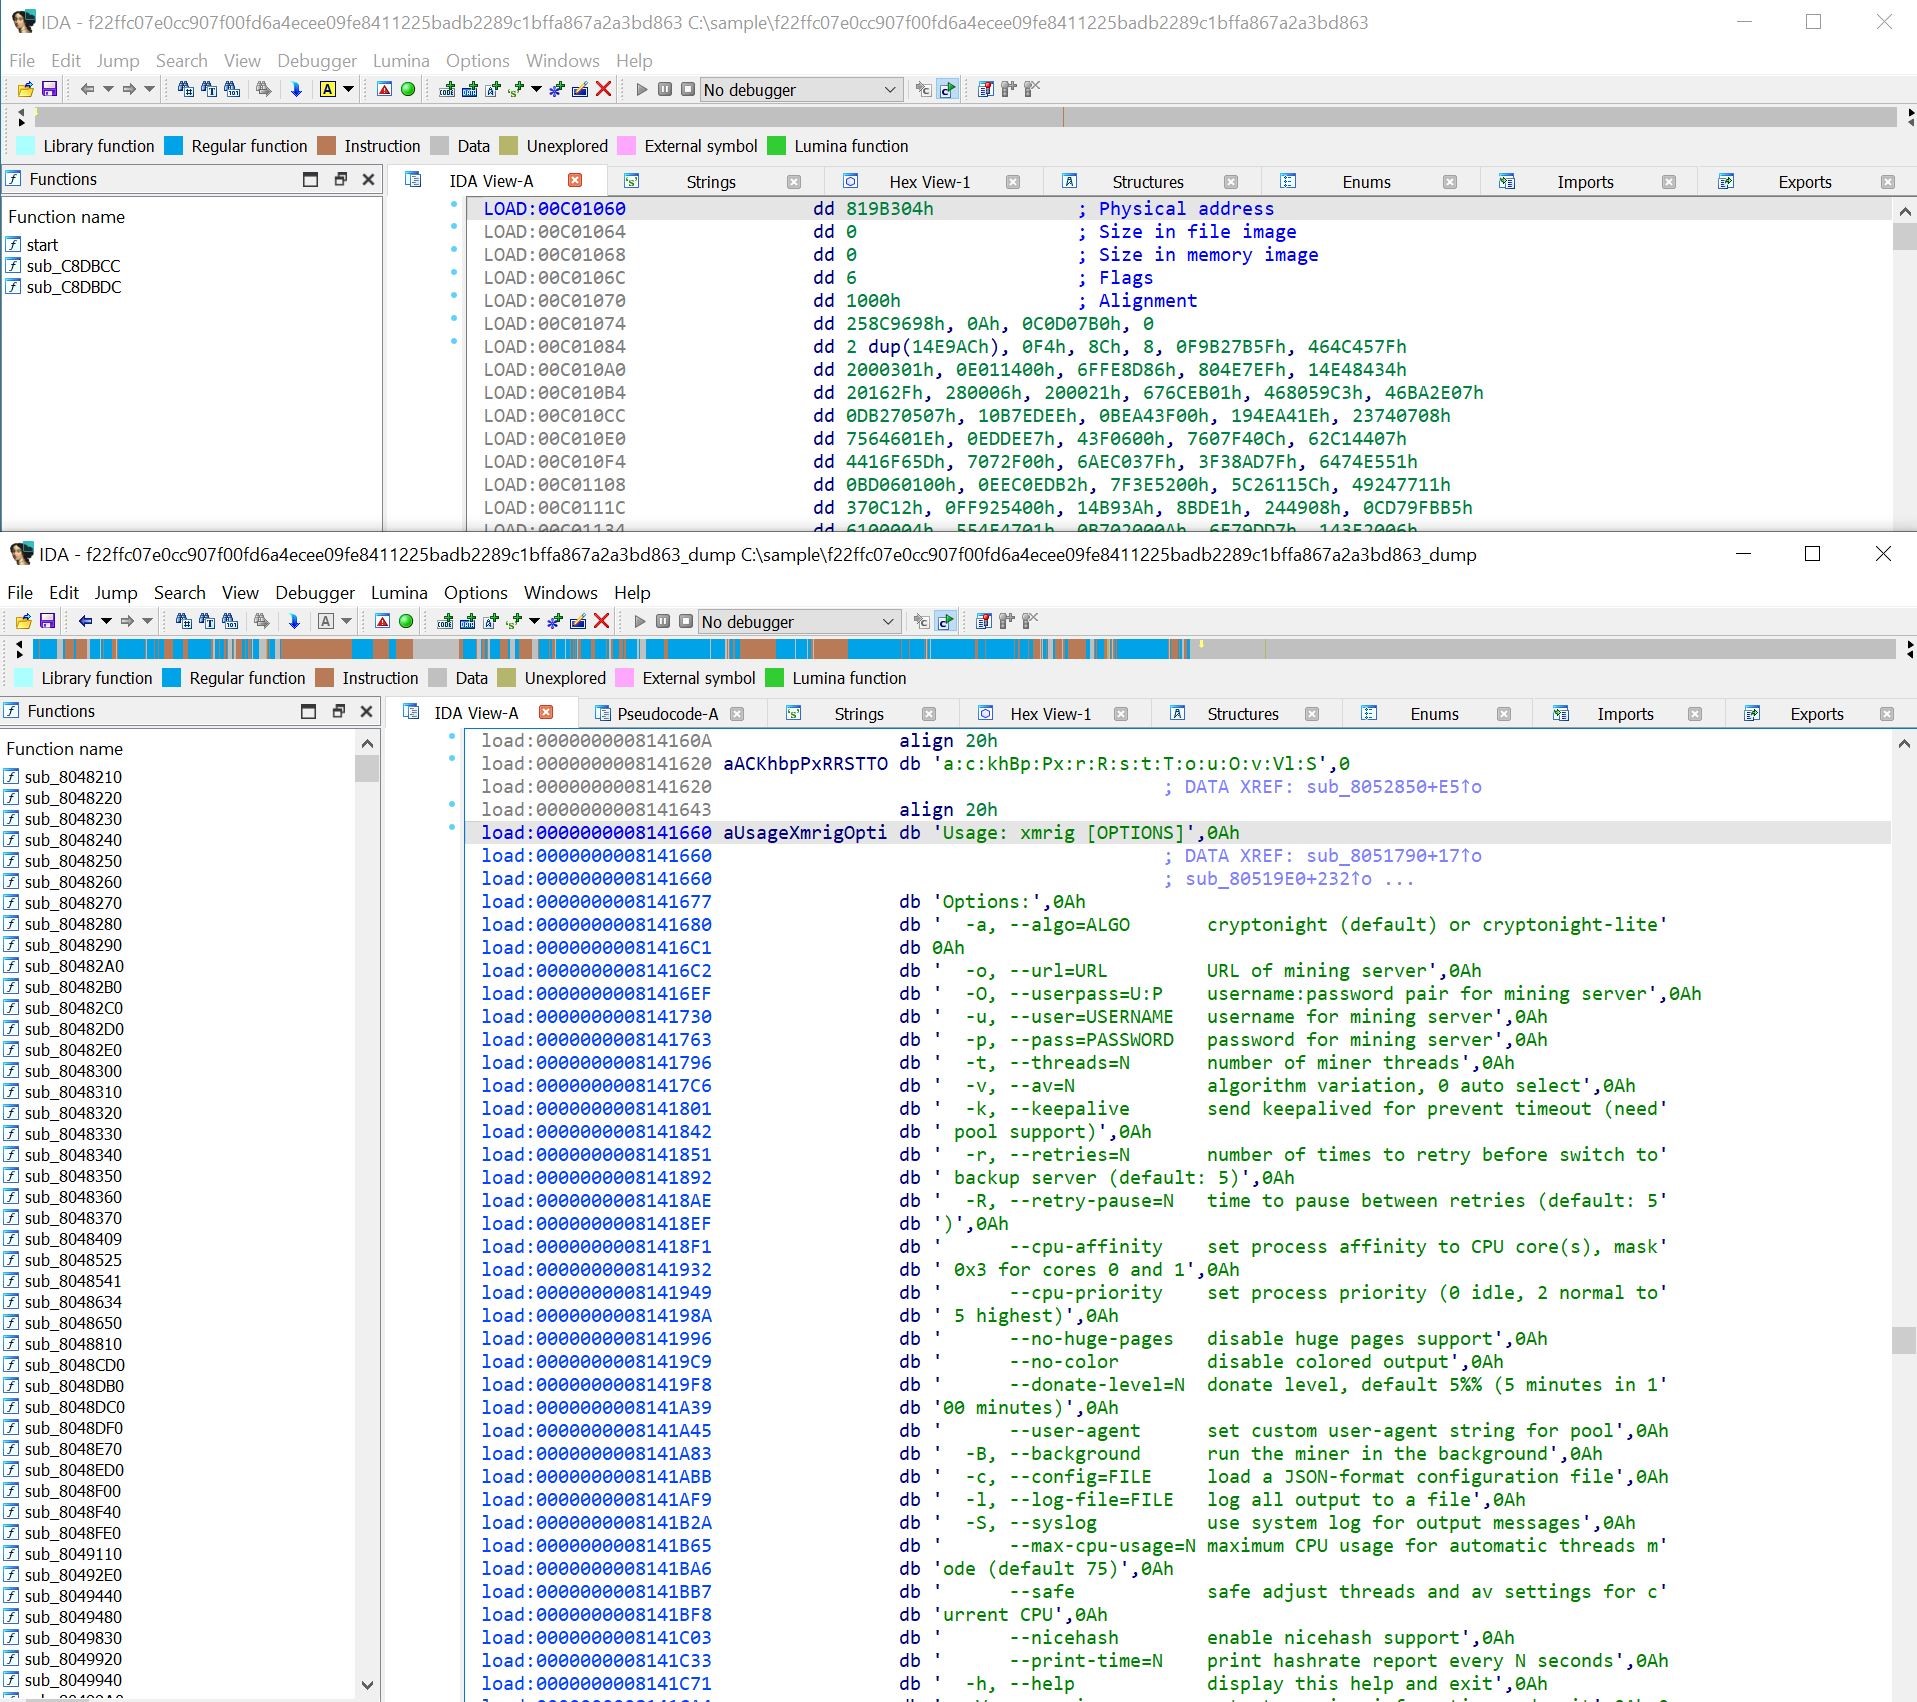
A dump, unlike a packed sample, contains various information useful for analysis (strings, functions), and its removal requires less time and effort than extracting the same data manually.
How is process memory organized in Linux?
Let's look at how the virtual memory of processes in Linux is structured, and to be more precise, how and what structures are used. How Linux works with memory in general can be read in open sources. For example, the article “Numbers and bytes: how does memory work in Linux?” To collect a dump, information about the memory structure of an individual process is sufficient.
Virtual (linear) the address space of a certain process can be represented in the form of a diagram shown in Figure 2. Of the entire virtual memory, the process has access to some areas (highlighted in gray), in which the data necessary for its execution is located. Looking ahead, I note that each of these areas is described by a certain structure in the OS kernel. If you collect all these areas into one file, you can get a memory dump of this process.
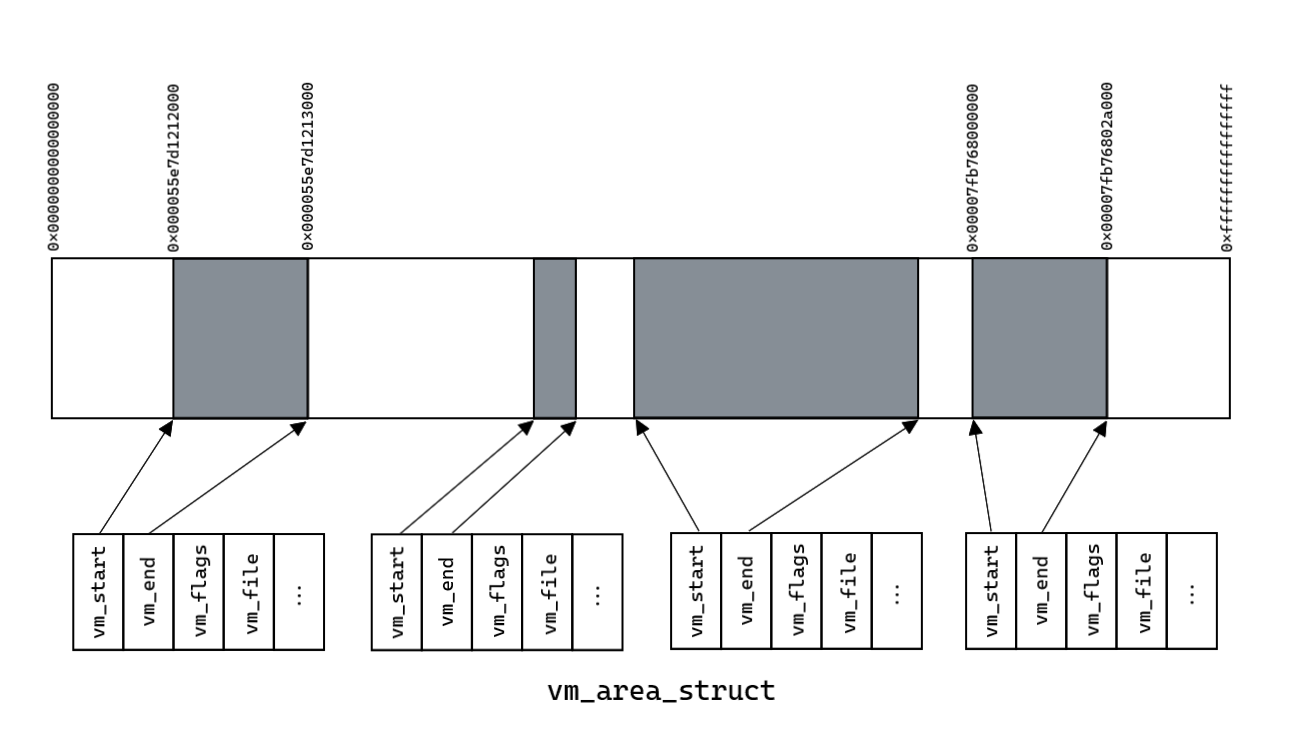
In userspace, memory is accessed using a virtual file system procfs, which serves as some kind of interface for obtaining information from the OS kernel about the system and processes. Information about memory areas can be read in the /proc/pid/maps file, and the memory itself can be read from /proc/pid/mem. But where does this information come from and is there any other way to get the process memory? It's possible, but you need to delve deeper into the OS kernel.
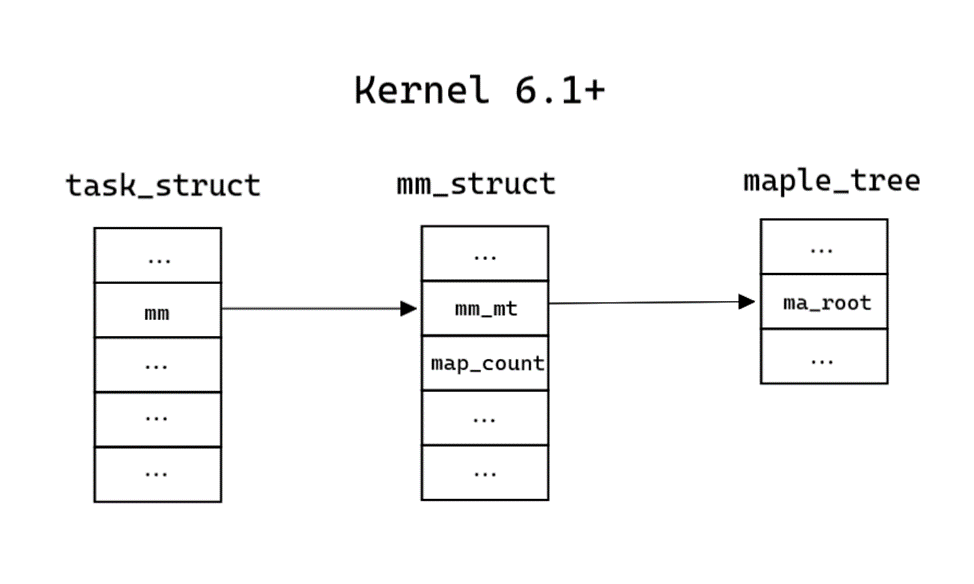
Each process in the Linux kernel has its own structure, which contains its description – task_struct, its definition is in the file sched.h. Address space information is contained in the mm_struct structure pointed to by field mm:
struct task_struct {
    ...
    struct mm_struct *mm;
    ...
};
Information about all virtual memory areas is stored in mm_struct in two ways:
Also in this structure, the same structure stores information about the number of areas (map_count field). The structure definition is in mm_types.h (for Kernel 6.6 and for Kernel 6.0).
struct mm_struct {
        ...
        // Kernel 6.1+
        struct maple_tree mm_mt;
        ...
        // Kernel 6.1-
        struct vm_area_struct *mmap;        /* list of VMAs */
        struct rb_root mm_rb;
        ...
        int map_count;      /* number of VMAs */
};
The presence of different process memory storage structures is the main difference between new kernel versions and old ones. The structures will be discussed in more detail below.
To collect a dump about each area, you need the following information:
The beginning and end of the area (fields vm_start and vm_end, respectively).
Memory access flags for reading, writing and execution (vm_flags field).
The file loaded into memory, if any, and its offset (vm_file and vm_pgoff fields).
For version 6.1, a pointer to the next element of the list (vm_next field).
All this information is located inside structures of type vm_area_struct. The structure definition is in mm_types.h (for Kernel 6.6 and for Kernel 6.0).
struct vm_area_struct {
        ...
        unsigned long vm_start;                   // Our start address within vm_mm.
        unsigned long vm_end;                     // The first byte after our end address within vm_mm. */
        ...
        struct vm_area_struct *vm_next, *vm_prev; // linked list of VM areas per task, sorted by address
        ...
        pgprot_t vm_page_prot;                    // Access permissions of this VMA.
        unsigned long vm_flags;                   // Flags, see mm.h. */
        ...
        unsigned long vm_pgoff;                   // Offset (within vm_file) in PAGE_SIZE units */
        struct file * vm_file;                    // File we map to (can be NULL). */
        void * vm_private_data;                   // was vm_pte (shared mem) */
        ...
};
Why do new kernels use a different structure (maple tree)?
Judging by the data on LWNthe main reasons are convenience and efficiency.
Prior to Linux kernel version 6.1, VMAs were stored in a red-black tree (rbtree):
rbtree does not support ranges well and is difficult to work with without blocking (rbtree's balancing operation affects multiple elements at the same time).
traversing rbtree is inefficient, so there is an additional doubly linked list.
The new data structure on fresh kernels – maple_tree – belongs to the B-tree family, therefore:
its nodes can contain more than two elements—in this case, up to 16 in leaf nodes or ten in internal nodes. B-tree traversal is much simpler, so the need for a doubly linked list is eliminated.
There is less need to create new nodes because nodes can include empty slots that can be filled over time without allocating additional memory.
Each node requires no more than 256 bytes, which is a multiple of popular cache line sizes. The increased number of elements per node and cache-aligned size means fewer cache misses during tree traversal.
Collection of virtual memory areas on kernel versions up to 6.0
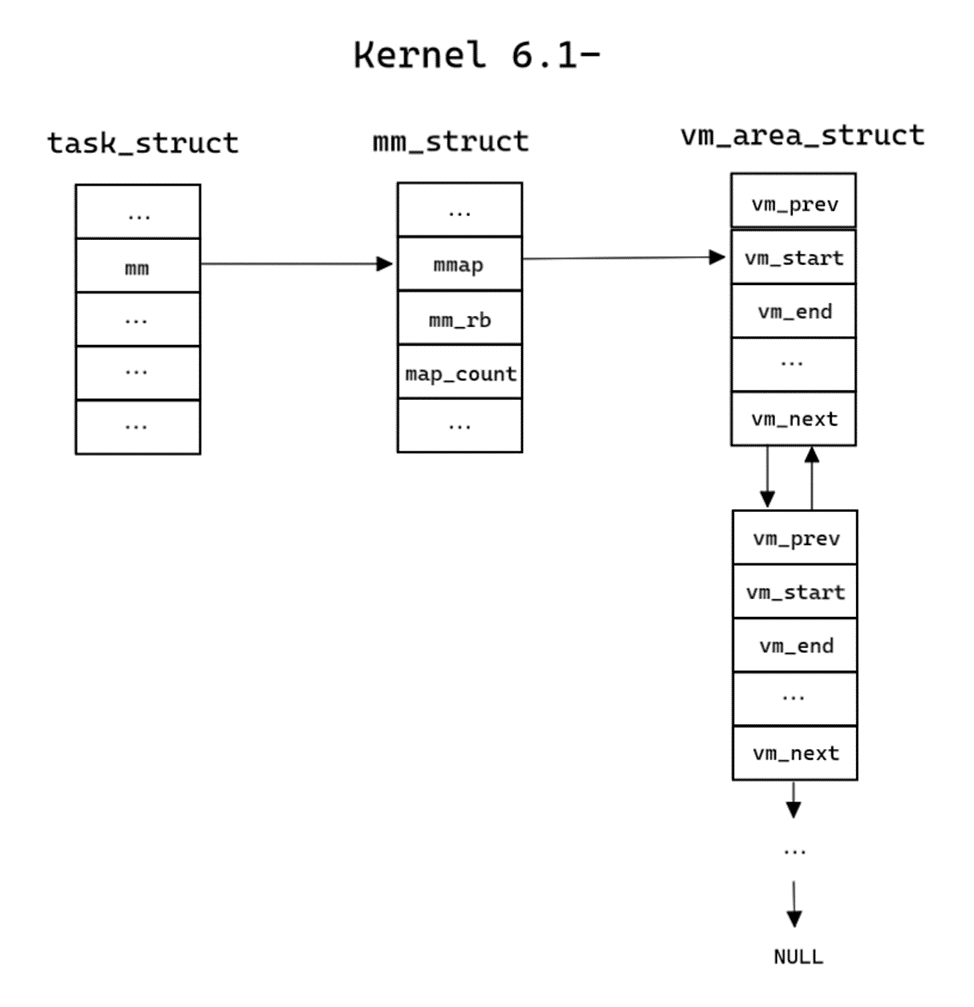
In older versions of the kernel, the memory management scheme is quite simple. An example memory structure is shown in Figure 3. The doubly linked list of vm_area_struct structures describes all of the process's virtual memory areas, which were shown in Figure 2.
Collection of virtual memory areas starting from version 6.1
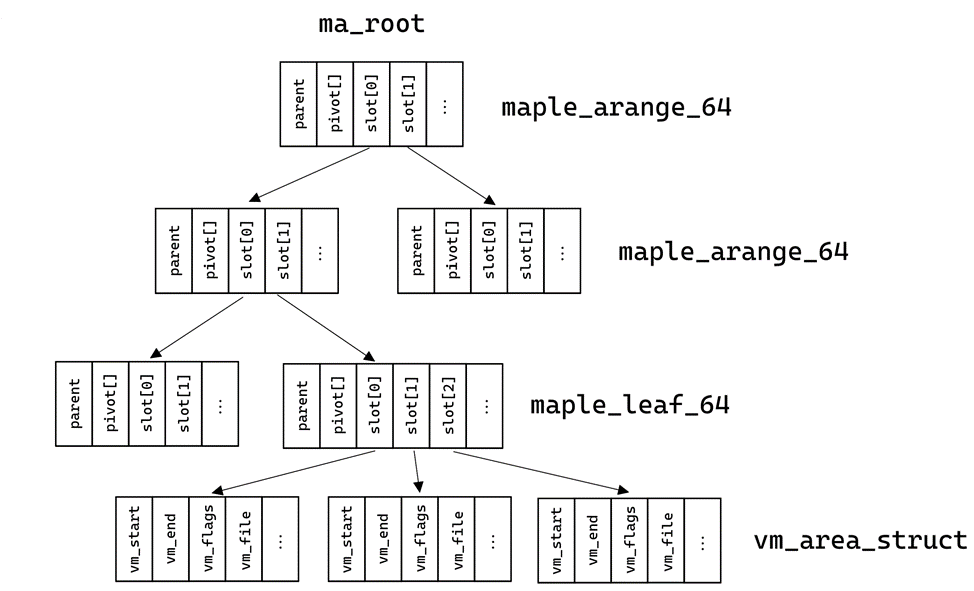
In new versions the scheme has become somewhat more complicated. To collect, you need to understand what a maple_tree is and how to get memory areas. All the necessary information about maple_tree is in the files maple_tree.h And maple_tree.c. The tree can have cells of several types, which are described in maple_type:
enum maple_type {
        maple_dense,
        maple_leaf_64,
        maple_range_64,
        maple_arange_64,
};
Cells of type maple_dense are not used for memory interactions. Cells of type maple_range_64 and maple_leaf_64 use the same structure, however, instead of a pointer to descendants, the leaves of the tree store pointers to the desired areas of virtual memory. The pointers are in the slot field. The pivot field—also known as “keys”—denotes the boundaries between different slots, but it is not used to collect dumps:
struct maple_range_64 {
    struct maple_pnode *parent;
    unsigned long pivot[MAPLE_RANGE64_SLOTS - 1];
    union {
        void __rcu *slot[MAPLE_RANGE64_SLOTS];
        struct {
            void __rcu *pad[MAPLE_RANGE64_SLOTS - 1];
            struct maple_metadata meta;
        };
    };
};
Cells of type maple_arange_64 have the following structure and store pointers to descendants in the slot field:
struct maple_arange_64 {
    struct maple_pnode *parent;
    unsigned long pivot[MAPLE_ARANGE64_SLOTS - 1];
    void __rcu *slot[MAPLE_ARANGE64_SLOTS];
    unsigned long gap[MAPLE_ARANGE64_SLOTS];
    struct maple_metadata meta;
};
The similarity of structures is easy to notice, but they differ mainly in the number of descendants:
#define MAPLE_RANGE64_SLOTS  16
#define MAPLE_ARANGE64_SLOTS 10
This similarity can be used to traverse the tree.
But how to determine the cell type if there is no specialized field in the structures? In fact, there is a specialized field: all the necessary information stored in cell pointers (addresses).
Non-leaf nodes store the type of the node pointed to (enum maple_type in bits 3-6), bit 2 is reserved. That leaves bits 0-1 unused for now.
Bits 3 to 6 are responsible for the type. A couple of examples:
The cell address is 0xFFFF92ADD6C5681E. His last bits:
…01101000 00011110
Therefore, the cell type is maple_arange_64.Likewise for address 0xFFFF92ADC8A10E0C. His last bits:
…00001110 00001100
Therefore, the cell type is maple_leaf_64.
Function to determine the cell type in Linux code:
#define MAPLE_NODE_MASK 255UL

#define MAPLE_NODE_TYPE_MASK    0x0F
#define MAPLE_NODE_TYPE_SHIFT   0x03

static inline enum maple_type mte_node_type(const struct maple_enode *entry)
{
    return ((unsigned long)entry >> MAPLE_NODE_TYPE_SHIFT) &
        MAPLE_NODE_TYPE_MASK;
}
This information is enough to draw up a diagram. In total, the approximate structure of the memory and tree is presented in Figures 4 and 5. Instead of a doubly linked list from mm_struct, we end up at the root of the maple_tree, the leaves of which contain the required information about the virtual memory areas.
Implementation using Xen and DRAKVUF
Implementation code
In this implementation, the process runs inside a virtual machine. The hypervisor is needed to gain access to the kernel space of the guest OS and to intercept system calls. The implementation uses an open source hypervisor Xen. DRAKVUF is a “black box” analysis system based on virtualization. DRAKVUF allows you to monitor the execution of arbitrary binary files without installing special software on the guest virtual machine, as well as interact with the hypervisor and collect all the necessary information.
Disclaimer
Later in this section we will present many code snippets that are responsible for collecting dumps and use the information described in the previous section.
From the very beginning, let's look at the functions for obtaining an array with information about virtual memory areas.
On older versions of the kernel, to obtain an array with all the necessary information, a list traversal function is sufficient:
std::vector<vm_area_info> procdump_linux::get_vmas_from_list(drakvuf_t drakvuf, vmi_instance_t vmi, proc_data_t process_data, uint64_t* file_offset)
{
    uint32_t map_count = 0;
    addr_t active_mm = 0;
    addr_t vm_area = 0;

    ACCESS_CONTEXT(ctx,
        .translate_mechanism = VMI_TM_PROCESS_PID,
        .pid = process_data.pid,
        .addr = process_data.base_addr + this->offsets[TASK_STRUCT_ACTIVE_MM]);

    if (VMI_FAILURE == vmi_read_addr(vmi, &ctx, &active_mm))
    ...
    ctx.addr = active_mm + this->offsets[MM_STRUCT_MAP_COUNT];
    if (VMI_FAILURE == vmi_read_32(vmi, &ctx, &map_count))
    ...
    ctx.addr = active_mm + this->list_offsets[MM_STRUCT_MMAP];
    if (VMI_FAILURE == vmi_read_addr(vmi, &ctx, &vm_area))
    ...
    std::vector<vm_area_info> vma_list;
    vma_list.reserve(map_count);

    for (uint32_t i = 0; i < map_count; i++ )
    {
        read_vma_info(drakvuf, vmi, vm_area, process_data, vma_list, file_offset);

        ctx.addr = vm_area + this->list_offsets[VM_AREA_STRUCT_VM_NEXT];
        if (VMI_FAILURE == vmi_read_addr(vmi, &ctx, &vm_area))
        ...
    }
    ...
    return vma_list;
}
New versions will require several functions. First of all, a function to determine the cell type. It is used almost unchanged relative to that used in the Linux sources and in the module for DRAKVUF:
static uint64_t node_type(addr_t node_addr)
{
    return (node_addr >> MAPLE_NODE_TYPE_SHIFT) & MAPLE_NODE_TYPE_MASK;
}
To traverse a tree in depth, a recursive function is needed. The functions for traversing cells other than leaves differ only in the number of possible cells and their offsets within the structure, so they use a common subfunction. Since the cell type is stored in the addresses, they need to be trimmed using a mask. The final function for descending into depth:
void procdump_linux::read_range_node_impl(drakvuf_t drakvuf, vmi_instance_t vmi, addr_t node_addr, proc_data_t const& process_data, std::vector<vm_area_info>& vma_list, int count, uint64_t offset)
{
    ACCESS_CONTEXT(ctx,
        .translate_mechanism = VMI_TM_PROCESS_PID,
        .pid = process_data.pid,
        .addr = (node_addr & ~MAPLE_NODE_MASK) + offset);

    addr_t slot = 0;

    // get all non-zero slots
    for (int i = 0; i < count; i++)
    {
        slot = 0;
        if (VMI_FAILURE == vmi_read_64(vmi, &ctx, &slot))
        ...
        if (slot)
        {
            switch (node_type(slot))
            {
                case MAPLE_ARANGE_64:
                    read_arange_node(drakvuf, vmi, slot, process_data, vma_list);
                    break;
                case MAPLE_RANGE_64:
                    read_range_node(drakvuf, vmi, slot, process_data, vma_list);
                    break;
                case MAPLE_LEAF_64:
                    read_range_leafes(drakvuf, vmi, slot, process_data, vma_list);
                    break;
                default:
                    PRINT_DEBUG("[PROCDUMP] Unsupported node type\n");
                    break;
            }
        }
        ctx.addr += 8;
    }
}
When we get to the leaves, we need to collect information from memory areas from the leaf. The function traverses all slots containing pointers to vm_area_struct. Function for collecting information about memory areas from leaves:
void procdump_linux::read_range_leafes(drakvuf_t drakvuf, vmi_instance_t vmi, addr_t node_addr, proc_data_t process_data, std::vector<vm_area_info> &vma_list, uint64_t* file_offset)
{
    ACCESS_CONTEXT(ctx,
        .translate_mechanism = VMI_TM_PROCESS_PID,
        .pid = process_data.pid,
        .addr = (node_addr & ~MAPLE_NODE_MASK) + this->tree_offsets[MAPLE_RANGE_SLOT]);

    addr_t slot = 0;

    for(int i = 0; i < MAPLE_RANGE64_SLOTS; i++)
    {
        slot = 0;
        if (VMI_FAILURE == vmi_read_64(vmi, &ctx, &slot))
        ...
        // some slots may be set to 0
        // last slot sometimes filled with used slot counter
        if(slot > MAPLE_RANGE64_SLOTS)
        {
            read_vma_info(drakvuf, vmi, slot, process_data, vma_list, file_offset);
        }
        ctx.addr += 8;
    }
}
The final function for collecting an array with information about virtual memory areas from maple_tree:
std::vector<vm_area_info> procdump_linux::get_vmas_from_maple_tree(drakvuf_t drakvuf, vmi_instance_t vmi, proc_data_t process_data, uint64_t* file_offset)
{
    ACCESS_CONTEXT(ctx,
        .translate_mechanism = VMI_TM_PROCESS_PID,
        .pid = process_data.pid,
        .addr = process_data.base_addr + this->offsets[TASK_STRUCT_ACTIVE_MM]);

    uint32_t map_count = 0;
    addr_t active_mm = 0;
    addr_t ma_root = 0;

    if (VMI_FAILURE == vmi_read_addr(vmi, &ctx, &active_mm))
    ...
    ctx.addr = active_mm + this->offsets[MM_STRUCT_MAP_COUNT];
    if (VMI_FAILURE == vmi_read_32(vmi, &ctx, &map_count))
    ...
    ctx.addr = active_mm + this->tree_offsets[MM_STRUCT_MM_MT] + this->tree_offsets[MAPLE_TREE_MA_ROOT];
    if (VMI_FAILURE == vmi_read_addr(vmi, &ctx, &ma_root))
    ...
    std::vector<vm_area_info> vma_list;
    vma_list.reserve(map_count);

    // Start VMA search from maple tree root
    if(node_type(ma_root) == MAPLE_ARANGE_64)
        read_arange_node(drakvuf, vmi, ma_root, process_data, vma_list, file_offset);
    else if(node_type(ma_root) == MAPLE_RANGE_64)
        read_range_node(drakvuf, vmi, ma_root, process_data, vma_list, file_offset);
    else if(node_type(ma_root) == MAPLE_LEAF_64)
        read_range_leafes(drakvuf, vmi, ma_root, process_data, vma_list, file_offset);
    else
        return {};
    ...
    return vma_list;
}
Before reading each virtual memory area, you need to collect all the necessary information about it. The function reads kernel memory at certain offsets inside the vm_area_struct structure (certain fields are read). Function for collecting information about the virtual memory area:
void procdump_linux::read_vma_info(drakvuf_t drakvuf, vmi_instance_t vmi, addr_t vm_area, proc_data_t process_data, std::vector<vm_area_info> &vma_list, uint64_t* file_offset)
{
    ACCESS_CONTEXT(ctx,
        .translate_mechanism = VMI_TM_PROCESS_PID,
        .pid = process_data.pid,
        .addr = vm_area + this->offsets[VM_AREA_STRUCT_VM_START]);

    vm_area_info info = {};
    addr_t vm_file = 0;
    addr_t dentry_addr = 0;
    uint32_t flags = 0;

    if (VMI_FAILURE == vmi_read_addr(vmi, &ctx, &info.vm_start))
    ...
    ctx.addr = vm_area + this->offsets[VM_AREA_STRUCT_VM_END];
    if (VMI_FAILURE == vmi_read_addr(vmi, &ctx, &info.vm_end))
    ...
    ctx.addr = vm_area + this->offsets[VM_AREA_STRUCT_VM_FLAGS];
    if (VMI_FAILURE == vmi_read_32(vmi, &ctx, &flags))
    ...
    ctx.addr = vm_area + this->offsets[VM_AREA_STRUCT_VM_FILE];
    if (VMI_FAILURE == vmi_read_addr(vmi, &ctx, &vm_file))
    ...
    ctx.addr = vm_file + this->offsets[_FILE_F_PATH] + this->offsets[_PATH_DENTRY];
    if (VMI_FAILURE == vmi_read_addr(vmi, &ctx, &dentry_addr))
    {
        dentry_addr = 0;
    }

    //get mapped filename if file has been mapped
    char* tmp = drakvuf_get_filepath_from_dentry(drakvuf, dentry_addr);
    info.filename = tmp ?: "";
    g_free(tmp);

    if (!info.filename.empty())
    {
        ctx.addr = vm_area + this->offsets[VM_AREA_STRUCT_VM_PGOFF];
        if (VMI_FAILURE == vmi_read_32(vmi, &ctx, &info.vm_pgoff))
        ...
    }
    ...
    vma_list.push_back(info);
}
At the beginning of a process dump, an array of information about memory areas is collected using the functions described above. If you have an array, you can read these areas and the dump will be collected. Process dump function:
void procdump_linux::dump_process(drakvuf_t drakvuf, std::shared_ptr<linux_procdump_task_t> task)
{
    if (!drakvuf_get_process_data(drakvuf, task->process_base, &task->process_data))
    ...
    auto vmi = vmi_lock_guard(drakvuf);
    std::vector<vm_area_info> vma_list;

    if (use_maple_tree)
        vma_list = get_vmas_from_maple_tree(drakvuf, vmi, task->process_data, &task->note_offset);
    else
        vma_list = get_vmas_from_list(drakvuf, vmi, task->process_data, &task->note_offset);
    ...
    start_copy_memory(drakvuf, vmi, task, vma_list);
    ...
}
Function for reading areas from the resulting array:
void procdump_linux::start_copy_memory(drakvuf_t drakvuf, vmi_instance_t vmi, std::shared_ptr<linux_procdump_task_t> task, std::vector<vm_area_info> vma_list)
{
    ...
    for (uint64_t i = 0; i < vma_list.size(); i++)
    {
        read_vm(drakvuf, vmi, vma_list[i], task);
    }
    ...
}
The full source code of the developed plugin can be viewed in the repository DRAKVUF.
About the dump format
The extracted areas can be saved in any convenient format. For example, in the core format, which was chosen in this implementation.
Why core?
The format is used by the system and gcore.
The format in the elf header stores some information about the OS (bit capacity, OS type).
All virtual memory areas have their own offsets in the headers, so the file can be split into smaller files if desired.
Files can be conveniently opened using various programs (IDA, readelf, 7z and others).
The headers of memory areas store comprehensive information about the areas: virtual address, access flags, size.
The dump can store additional information: information about threads, general information about the process, and others. In this implementation, the additional information section contains the names of the files that were loaded into memory.
More information about the format is in the header file llvm/BinaryFormat/ELF.h.
An example of part of the output of the readelf program on the assembled file
readelf -a procdump.0
ELF Header:
  Magic:   7f 45 4c 46 02 01 01 00 00 00 00 00 00 00 00 00
  Class:                             ELF64
  Data:                              2's complement, little endian
  Version:                           1 (current)
  OS/ABI:                            UNIX - System V
  ABI Version:                       0
  Type:                              CORE (Core file)
  Machine:                           Advanced Micro Devices X86-64
  Version:                           0x1
  Entry point address:               0x0
  Start of program headers:          64 (bytes into file)
  Start of section headers:          5771126 (bytes into file)
  Flags:                             0x0
  Size of this header:               64 (bytes)
  Size of program headers:           56 (bytes)
  Number of program headers:         39
  Size of section headers:           64 (bytes)
  Number of section headers:         41
  Section header string table index: 40

Section Headers:
  [Nr] Name              Type             Address           Offset
       Size              EntSize          Flags  Link  Info  Align
  [ 0]                   NULL             0000000000000000  00000000
       0000000000000000  0000000000000000           0     0     0
  [ 1] note0             NOTE             0000000000000000  005808c8
       0000000000000698  0000000000000000           0     0     1
  [ 2] load              PROGBITS         0000591e7b400000  000008c8
       000000000000e000  0000000000000000  AX       0     0     1
  [ 3] load              PROGBITS         0000591e7b60d000  0000e8c8
       0000000000001000  0000000000000000   A       0     0     1
  [ 4] load              PROGBITS         0000591e7b60e000  0000f8c8
       0000000000001000  0000000000000000  WA       0     0     1
  [ 5] load              PROGBITS         0000591e7b60f000  000108c8
       0000000000023000  0000000000000000  WA       0     0     1
  [ 6] load              PROGBITS         0000591e7c09e000  000338c8
       0000000000021000  0000000000000000  WA       0     0     1
  [ 7] load              PROGBITS         000078e4736c0000  000548c8
       000000000000a000  0000000000000000  AX       0     0     1
  ..................................................................

  [40] .shstrtab         STRTAB           0000000000000000  00580f60
       0000000000000016  0000000000000000           0     0     1
Key to Flags:
  W (write), A (alloc), X (execute), M (merge), S (strings), I (info),
  L (link order), O (extra OS processing required), G (group), T (TLS),
  C (compressed), x (unknown), o (OS specific), E (exclude),
  l (large), p (processor specific)

There are no section groups in this file.

Program Headers:
  Type           Offset             VirtAddr           PhysAddr
                 FileSiz            MemSiz              Flags  Align
  NOTE           0x00000000005808c8 0x0000000000000000
                 0x0000000000000698 0x0000000000000000         0x1
  LOAD           0x00000000000008c8 0x0000591e7b400000 0x0000000000000000
                 0x000000000000e000  R E    0x1
  LOAD           0x000000000000e8c8 0x0000591e7b60d000 0x0000000000000000
                 0x0000000000001000  R      0x1
  LOAD           0x000000000000f8c8 0x0000591e7b60e000 0x0000000000000000
                 0x0000000000001000  RW     0x1
  LOAD           0x00000000000108c8 0x0000591e7b60f000 0x0000000000000000
                 0x0000000000023000  RW     0x1
  LOAD           0x00000000000338c8 0x0000591e7c09e000 0x0000000000000000
                 0x0000000000021000  RW     0x1
  LOAD           0x00000000000548c8 0x000078e4736c0000 0x0000000000000000
                 0x000000000000a000  R E    0x1
  ..................................................................
 Section to Segment mapping:
  Segment Sections...
   00     note0
   01     load
   02     load
   03     load
   04     load
  ..................................................................
There is no dynamic section in this file.

There are no relocations in this file.

The decoding of unwind sections for machine type Advanced Micro Devices X86-64 is not currently supported.

No version information found in this file.

Displaying notes found at file offset 0x005808c8 with length 0x00000698:
  Owner                Data size        Description
  CORE                 0x00000683       NT_FILE (mapped files)
    Page size: 64
                 Start                 End         Page Offset
    0x0000591e7b400000  0x0000591e7b40e000  0x0000000000000000
        /bin/ping
    0x0000591e7b60d000  0x0000591e7b60e000  0x000000000000d000
        /bin/ping
    0x0000591e7b60e000  0x0000591e7b60f000  0x000000000000e000
        /bin/ping
    0x000078e4736c0000  0x000078e4736ca000  0x0000000000000000
        /lib/x86_64-linux-gnu/libnss_files-2.24.so
  ..................................................................
Conclusion
In the article, we reviewed and described the storage structure of virtual memory areas on current versions of the kernel. An implementation of a module for collecting memory dumps using a hypervisor was also proposed.
Of course, the implemented approach is not ideal. It represents a proof of concept for collecting a process memory dump, which can be useful for analyzing both regular programs and malware.
Possible improvements:
Expanding the list of information that is saved in the core file
Developing a more efficient method for obtaining virtual memory regions and reading them
Possibly support for different dump formats (for example, collecting raw dumps)
If you have suggestions for improving the approach described in the article, share it in the comments!
