Data composition system in 1C. Fast start
The data composition system in 1C (SKD) is a very big topic. There are separate courses and manuals for developers on it. You can study it in all its nuances for a long time. But if you don’t have time for that, in this short article I’ll give you a description of the concept and everything you need to get started quickly – in order to start using this tool, learning tricky features as needed.
Concept
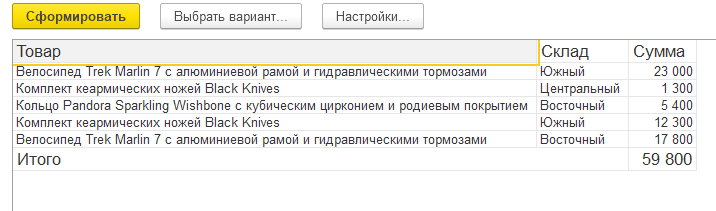
The data composition system in 1C is a representative of a fairly large family of so-called. report generators. The idea underlying the SKD is as follows. You describe the data source, usually a query in the query language SKD, and the system executes this query, gets the result in the form of a table, and displays this result in a “beautiful” form. With title, table header, totals. In this case, the user, if we allow him, can change the order of generating the report. For example, we have data on sales of goods by warehouse. Something like that:
The user can make a report on the goods:

by warehouses:

by warehouses, with goods inside:

by goods, with warehouses inside:

you can even do this:

or even like this:

True, the last two options will require a little more effort from the developer.
After creating a description of the data source and performing a few more simple manipulations, the developer creates not just one report, but a whole family of reports on a given topic. After that, the user can independently choose which representative of this family he will work with.
The SQL query language, one of the dialects of which is the 1C query language, is good because we do not need to explicitly manage cycles to get the result. But he is bad exactly the same. Without explicitly managing cycles, you can solve a lot of problems. Quite often, among them there are those that are best solved through direct cycle control. Because the solution through the query language, although possible, is too cumbersome. For example, you can write a query that will return the result with rows numbered in order. Only this request will not want to read later. The data composition system in some cases (in particular, just in the case of line numbering) allows you not to write such queries, but to use the so-called. system fields.
Another example of this kind
Everything you need to get started
What you need to create a report based on SKD step by step.
In the window for working with ACS, on the first tab with the name “Data sets”, add a data set of the “Query” type and write a query without grouping and sorting (the data composition system “can do” all this itself). Here you can use the query builder

Go to the “Resources” tab and tell the system that the “Amount” numeric field is nothing but a resource. I must say that here the platform developers are clearly too lazy. It would be possible to automatically determine the resources by numeric type, and thereby save us from unnecessary actions.

On the “Settings” tab, add a new grouping. For example, “Product”. You can also add a bunch of grouping fields, for example, “Product, Warehouse”. To do this, you must first add a single grouping, and then edit it. I know it looks a bit confusing, but that’s the way it is. You cannot immediately enter a bunch, the platform will not give you.

On the same tab at the bottom, create a list of “selected fields”. The fields present in the groupings do not have to be selected, but the “resources” must be selected, otherwise they will not appear in the report.

If we want to give the user the ability to customize the report, then we need to click the second button on the right in the command panel (I won’t even write what it was called)

Now the ACS-based report is ready, you can run it and, if desired, change the settings. There was one nuance connected with dates. Most reports require you to specify a period or point in time in one way or another. The way the period setting is implemented can easily confuse you. The user has access to selections. And there, in the “Parameters” section there is “Beginning of the period” and “End of the period”. By the way, we didn’t explicitly add them. But, since we built a query to the virtual table of the accumulation register, the system “understood” that a period is needed here and a start and end date are needed. But such “selections” will not work. Because custom filters are applied after the request is executed, and we need to do it before.

In the Configurator, go to the “Parameters” tab and do what is shown in the picture

And that’s not it. On the settings tab, select the “Parameters” tab at the bottom, press the bottom button of the sidebar (again I will not say what it was called), set the “Include in user settings” checkbox.

And only after these manipulations the user will be able to set the period

Conclusion
I showed you only the most necessary – what allows you to “create minimum viable reports” and not fall into “traps from developers.” It’s already a working tool. Moreover, in a large number of cases it will be enough for you.
In conclusion, I would like to note that this tool, despite some “incidents”, is very good. But life does not stand still. Today we can describe the schema of the data and let the user have fun not with buttons and other GUI elements. Now the user can ask questions in natural language and get the result corresponding to the question from the database. And all this thanks to large language models.
Concluding, I will recommend an open lesson on the types of testing in 1C, which will be held on July 20. On it the participants:
– Learn the concept of TDD and BDD.
– Write tests using the Vanessa automation framework.
– Learn how to run tests through a console application.
You can sign up on the page of the course “Architect 1C”.