Business management dashboard (P&L) in Metabase in 5 days
One of the most important tools in my work is a dashboard with data on profits and losses of the P&L company (aka BDR, aka financial performance report). It helps to monitor business profitability, the efficiency of company departments, forecast profits and build hypotheses for development. In this article I will tell you how to set it up and use it using an Open-Source BI system Metabase.

Why and who needs this dashboard
What questions does P&L help answer:
What was the profit in the first quarter?
How much revenue this week are we projecting for the coming months?
Why did the profit target drop over the week? What exactly were the costs and revenues that affected this in each month?
In what months are there losses? Isn't it time to move on to crisis management? Will there be cash gaps?
Why did salary costs jump sharply in the second quarter, although incomes did not grow?
Why are the plans for income from the recently sold contract and the costs of the hired PM not included?
When is the break-even point? What about payback?
This is a sample list. Often such questions concern executive and financial directors, product managers, CTOs, marketing and sales managers.
Below I will tell you step by step how to set up this dashboard. And detailed technical aspects – in the article by our developer Alexander Ezhkov.
What is a dashboard
To talk in detail, I’ll first show you what it looks like.

When you click on any value in the table, you can “fall through” to the details. Report indicators directly affect the company’s profit and profitability, and profitability is an important metric for us. Using a dashboard, we make sure it stays at 20%.
You can set up such a dashboard in a week.
Day 1. Setting up the infrastructure
To operate the dashboard we use a system of services:
Grist — table editor, “server GoogleDoc”;
Authentic – user management;
Apache Airflow – orchestrator;
PostgreSQL – database;
Metabase — BI platform for data visualization.
Various sources are connected to Postgres: CRM, task tracker, tables with data from production and marketing departments, finance.
You can set up the interconnection of services, accounts and access to all data in about a day. The article by Alexander Ezhkov provides the necessary instructions and explanations.
Day 2. Preparing the data
To do this, we need to enter data into Grist and populate the database. We enter salaries, purchases, capital investments and income there. Fact and plan.
The income planning unit is the shipment of work to the client in the context of specialists, departments, statuses, planned delivery/payment dates, and so on.

We maintain management accounting not the cash method, but the accrual method. When we talk about expenses, we mean accruals. We are guided by the principle of matching costs and income: expenses are recognized when income is received. We take into account income when the work is accepted, and not when we are paid an advance.
Grist allows us to make an unlimited number of tables, create directories for drop-down fields, make color notes, add calendars, filters. Everything is like in Google Sheets, but with the ability to conveniently save information into our database and without the risk of blocking from an external vendor.
Day 3. Create an SQL report in Metabase, add a comparison with periods to analyze history over time
When types and dependencies are configured in the database, we move on to creating a dashboard. This is what an SQL query looks like, where we select the necessary tables, join them by month and calculate the profit.
/*Выбираем нужные таблицы в WITH*/
WITH
    Revenue_bymonth AS (
        SELECT
            date_trunc('month', "Task_Sum_Date") as rev_MONTH, sum("Plan_Revenue") as Revenue
        FROM magia__income_revenue
        group by rev_MONTH
    ),
…

SELECT
Purchases_bymonth.cost_MONTH,
/*Используем coalesce, чтобы вместо null были 0*/
    coalesce(Revenue_bymonth.Revenue,'0') Revenue, -- Доход
    coalesce(Purchases_bymonth.Purchases,'0') Purchases,  -- Закупки
    coalesce(Salary_bymonth.Salarys,'0') Salarys, -- Зарплаты
    coalesce(Revenue_bymonth.Revenue,'0')-coalesce(Purchases_bymonth.Purchases,'0')-coalesce(Salary_bymonth.Salarys,'0') Profit,    -- Прибыль
    (Revenue_bymonth.Revenue-Purchases_bymonth.Purchases-Salary_bymonth.Salarys)/NULLIF(Revenue_bymonth.Revenue,0) as Profitability -- Рентабельность

FROM purchases_bymonth
LEFT JOIN Revenue_bymonth
    on Purchases_bymonth.cost_MONTH = Revenue_bymonth.rev_MONTH
LEFT JOIN Salary_bymonth
    on Purchases_bymonth.cost_MONTH = Salary_bymonth.salary_MONTH

ORDER by Purchases_bymonth.cost_MONTH
Now we have a pivot table that automatically calculates actual profits and is updated on a schedule from Airflow. Now we need to analyze how the data changed over time. Let's look at an example again.
We made a forecast that next month the profit will be 1000 rubles. A week has passed, and we see that the dashboard shows not 1000 rubles, but 900. Someone adjusted the forecast. You need to understand why profits have decreased and what can be done to compensate for it. To do this, we compare actual data with historical data.
This information will provide food for analysis – we will understand which tools, products, services work and which do not. DIM tables will help with this. Essentially, these are copies (snapshots) of the original table that are created every day.
The second article contains instructions on how to set up a schedule for such snapshots (section “Grist API and Airflow”).
Let's add the SQL query:
/*Выбираем DIM-таблицы в WITH*/
/*DIM*/
    dim_Revenue_bymonth AS (
        SELECT
            date_trunc('month', "Task_Sum_Date") as rev_MONTH, sum("Plan_Revenue") as Revenue,
            ds -- Дата снапшота
        FROM magia__income_revenue__dim
        [[where ds = {{ds}}]] -- Выбираем дату снапшота для сравнения. В фигурных скобках — переменные для фильтрации прямо в дашборде Metabase
        group by ds, rev_MONTH
    ),
…
/* Джоиним DIM-таблицы */
/*DIM*/
LEFT JOIN dim_Revenue_bymonth
…
/* Добавляем фильтр по годам */
where Purchases_bymonth.cost_MONTH >= '1.1.{{Year}}' AND Purchases_bymonth.cost_MONTH <= '12.31.{{Year}}'
Voila, the dashboard with the ability to analyze historical data is ready:

We select the year and date through the Metabase drop-down filters and compare.
Day 4. Create an “Update” button and set up an alert
The basis of the dashboard is ready, but it has a drawback: it is updated on a schedule. This is inconvenient: you enter data and wait.
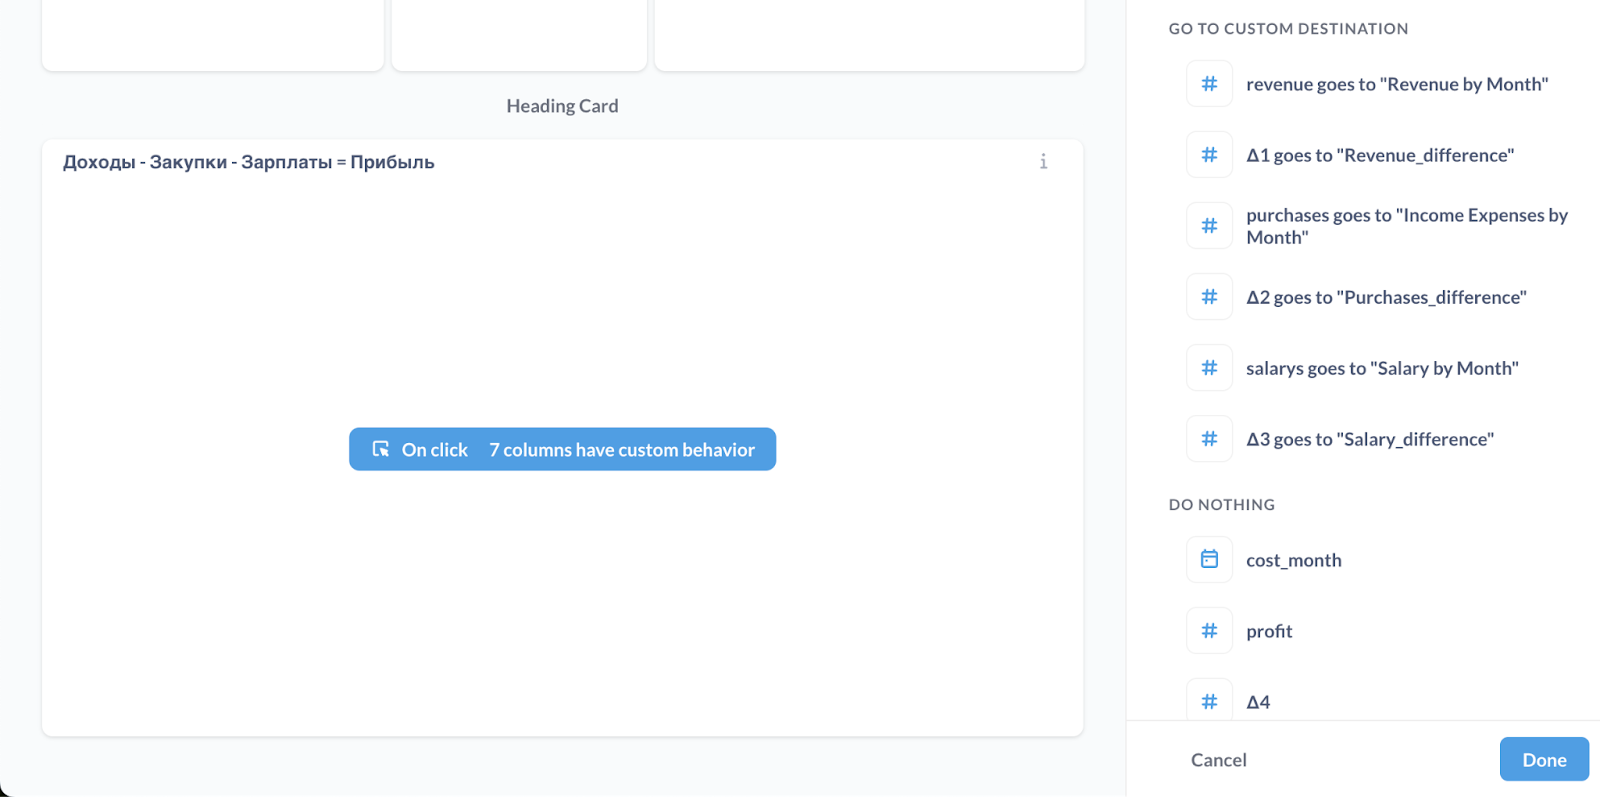
Therefore, you need to add an “Update” button. How to do it, read the technical article (section “How to create a button on a dashboard”).

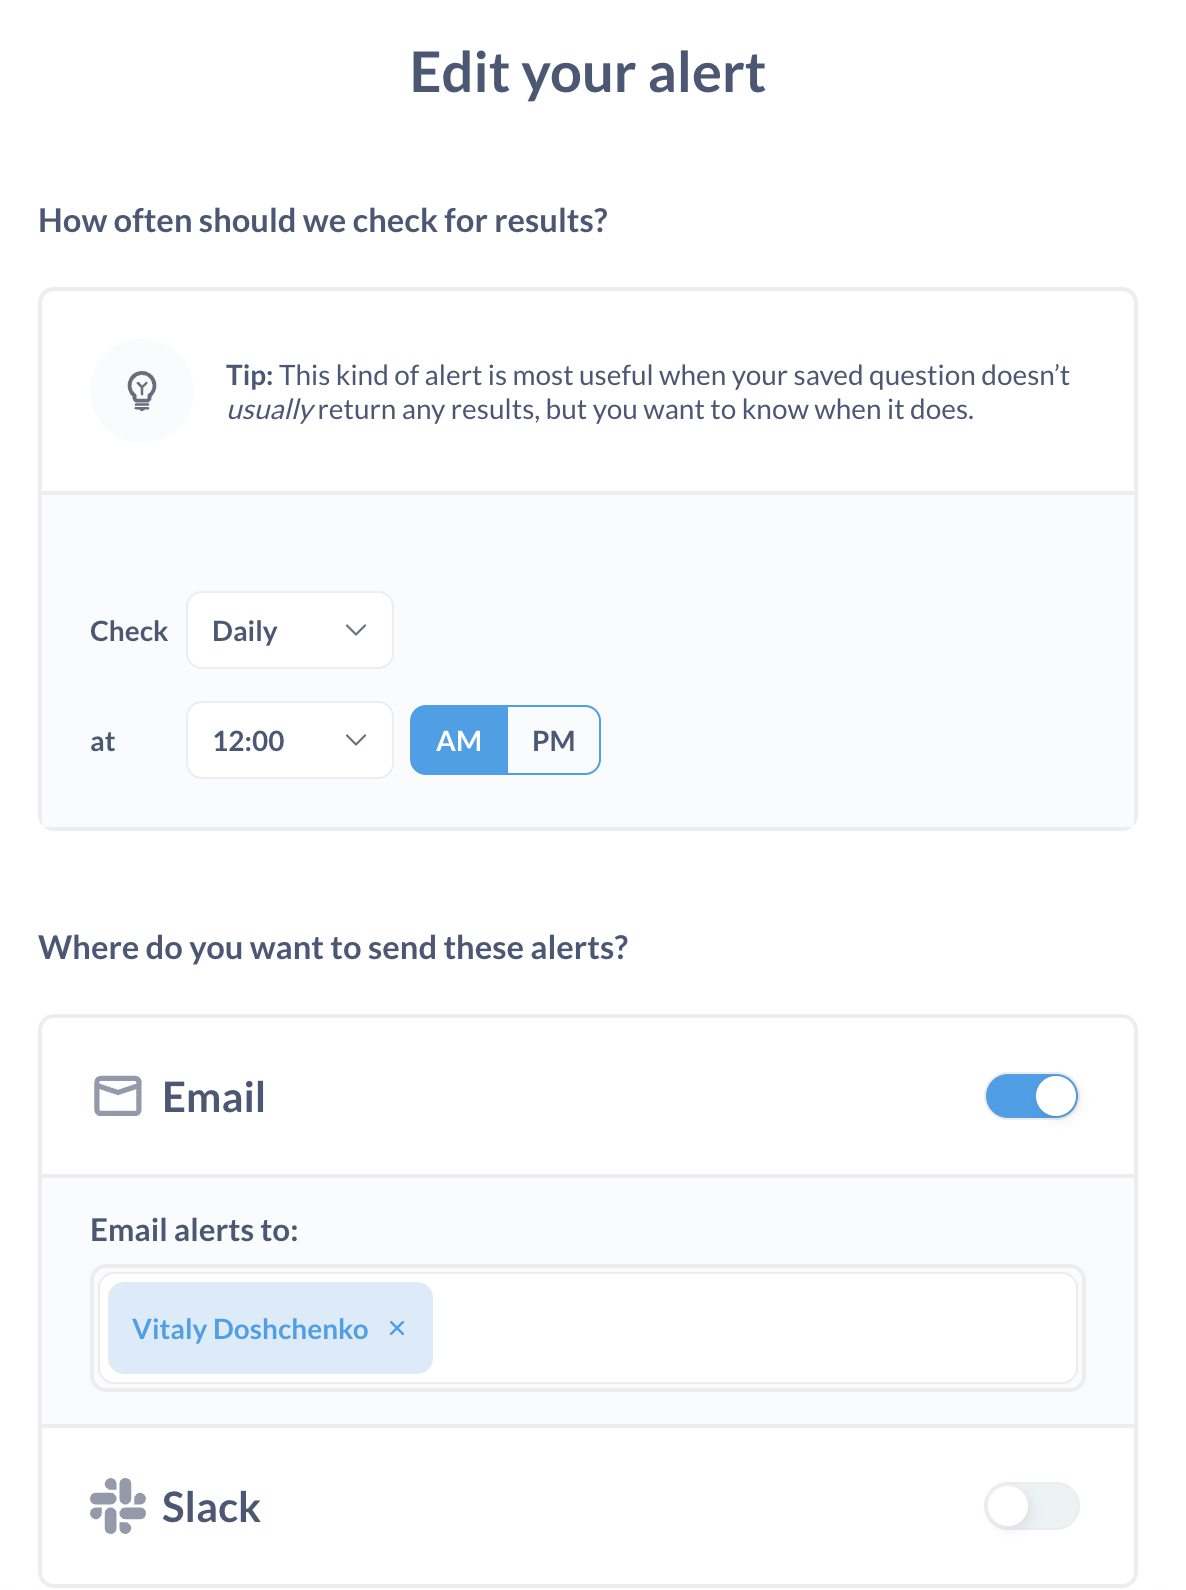
At the same time, it’s worth setting up alerting and secondary reports. Alerting allows you to keep your finger on the pulse. If someone makes changes to the table, everyone interested receives a notification via email or Slack.

Now we place the links on the dashboard.

Day 5. We carry out the first cut, set tasks and start regular work
To motivate line managers to work with data, we conduct regular profit breakdowns with them before the P&L dashboard. The benefit of such meetings is twofold: on the one hand, we show the convenience of the system, on the other hand, we encourage them to be more attentive to the data in general.
At these meetings we find deviations from plans, identify problems, and set tasks.
P&L of the department head
We create a copy of the main P&L and filter by division: select the corresponding income, purchases and costs. There is difficulty in distributing expenses common to all departments (indirect). We distribute indirect costs in proportion to the amount of costs in the department (including salaries). The indirect accrual system was discussed in more detail on VC.
We write the SQL query again:
/*Добавляем Косвенные затраты в With (которые не относятся ни к одному Цеху)*/
WITH
    /*INDIRECT COSTS*/
    purch AS (
        SELECT
            date_trunc('month', "Cost_Plan_Date") as cost_month, sum("Task_Sum_Cost") as indirect_purchases
        FROM magia__income_expenses
        WHERE "Department" NOT LIKE '%Цех -%'
        GROUP BY cost_month
    ),

    Salary AS (
        SELECT
            date_trunc('month', "Month_Date") as salary_month, sum("Total") as indirect_salarys
        FROM magia__profit_salary
        WHERE "Purpose" = 'Непроизводственное' -- Отфильтровываем Непроизводственные
        GROUP BY salary_month
    ),

/*Выбираем все Зарплаты и Закупки по цехам*/
    purch_dev AS (
        SELECT
            date_trunc('month', "Cost_Plan_Date") as cost_month, sum("Task_Sum_Cost") as purch_dev
        FROM magia__income_expenses
        WHERE "Department" = 'Цех - Разработка'
        GROUP BY cost_month
    ),

    purch_projection AS (
        SELECT
            date_trunc('month', "Cost_Plan_Date") as cost_month, sum("Task_Sum_Cost") as purch_projection
        FROM magia__income_expenses
        WHERE "Department" = 'Цех - Проектирование'
        GROUP BY cost_month
    ),
…
/*Джоиним все таблицы с затратам*/
…
/*Добавляем колонку с рассчитанными Косвенными в P&L и корректируем формулу расчета прибыли в SELECT*/
(coalesce(pb.indirect_purchases,'0') + coalesce(sb.indirect_salarys,'0')) *
        (coalesce(pbd.purch_dev,'0') + coalesce(sdv.indirect_salarys_dev,'0')) / (
            coalesce(pbanalytics.purch_analytics,'0') + coalesce(sa.indirect_salarys_analytics,'0') +
            coalesce(pbprojection.purch_projection,'0') + coalesce(sp.indirect_salarys_projection,'0') +
            coalesce(pbdesign.purch_design,'0') + coalesce(sd.indirect_salarys_design,'0') +
            coalesce(pbd.purch_dev,'0') + coalesce(sdv.indirect_salarys_dev,'0') +
            coalesce(pbm.purch_PM,'0') + coalesce(spm.indirect_salarys_pm,'0')
        ) dev_indirect_costs,
We monitor the performance of each department not only for the sake of awareness. Many top managers' bonuses depend on the performance of their departments. Therefore, using the dashboard, we calculate the profitability of departments and bonuses for managers.
What's next?
Now the culture of working with Metabase needs to be extended throughout the company and access rights must be differentiated. We talk about this in detail in the second article (see section “Metabase and psql-http”).


Using the same tools, dashboards are built by our Sales Team, QA department, AGIMA marketers, project managers, etc. Through the dashboard we monitor the performance of sales, managers and individual teams.
What do you get in the end?
The described system allows you to accurately and accurately conduct management accounting. We didn’t come to this right away. But in the end, we can make decisions based on specific data that is always at hand. We choose which indicators to monitor through the pyramid of metrics.
If you want to see how Grist works, specifically made a demo version.
Here are the accesses:
Login: demo@example.com
Password: demo1234
You can copy the document and try working with it. Also in the second article you will find a link to a repository with files that will help you set up all services (section “Useful link and demo version”).
If you have any questions, ask in the comments. I'll try to answer everything. We also have telegram channel for products, in which we talk about other tools for working with data. Come read.


