Still storing music in Hi-Res format? Then we go to you

People are divided into 2 camps: those who hear the difference between lossless and lossy, and those who do not. Lossy audio is an interesting topic, but today we'll talk about high-resolution audio – PCM 24/96 and above, as well as DSD in all its forms. I won’t tell you the theory of how these formats differ; such articles are easy to Google. I will only briefly mention Kotelnikov’s theorem (Nyquist-Shannon), which reads as follows: “In order to digitize an analog signal, and then restore it WITHOUT LOSSES, it is necessary and SUFFICIENT that the sampling frequency is 2 times STRICTLY greater than the maximum frequency of the useful signal.”
When the CDDA compact disc format was developed, it was believed that a person hears from 20 Hz to 20 kHz, but Philips scientists were not too lazy to conduct their own research, and they found out that there are unique people who hear up to 22 kHz. Based on a theorem already known to us, Philips engineers took 44.1 kHz as the standard sampling frequency, because 44.1 > 2*22. The bit rate was chosen so that the dynamic range was greater than that of analog recording, namely 96 dB.
Compact discs created a revolution and gained universal recognition. The difference was audible to absolutely everyone and on any equipment.
But soon new audio formats in higher resolution began to appear on sale. When they learned to produce discs with several times higher data density, such as Super Audio CD and DVD Audio. But these formats have not become widespread. People didn't hear the difference. Yes, there are audiophiles who claim to hear a difference. In this case, they take 2 different discs, one CD, the second SACD – and hear the difference on different sources. Or they generally use a two-layer disc, and there is also a difference there. But I propose to conduct one small experiment and look at this difference in formats with your own eyes. This experiment can be repeated by anyone.
So let's take a high resolution file. I borrowed a SACD image of jazz from a friend. Because This is the DSD64 format, and editors cannot work with DSD, so I converted one track from the disk to PCM 24/192 format, so that there was a reserve. In fact, DSD64 contains less information than PCM 24/192. I also compressed this track to CDDA 16/44.1 format.
Now we have 2 files that we will compare in Audacity. We open both and look at the spectrogram.

Wow, what a difference!
And many audiophiles stop there, reasonably deciding that they need High Rez. But don't rush to conclusions.
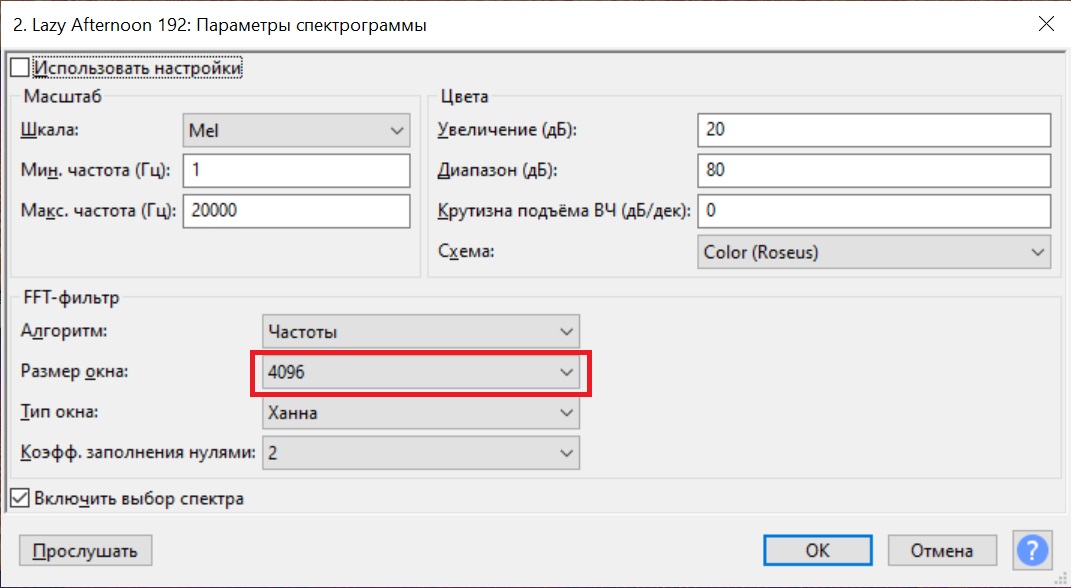
What is a spectrogram anyway? It is a visualization of changes in the spectrum over a period of time. On the ordinate axis we have frequency, on the abscissa we have time, and the amplitude is color – usually from blue to yellow. How is a spectrogram constructed? It is constructed using the Fourier transform, or rather the windowed Fourier transform. These windows usually range from 1024 to 8192 samples. And because We have 2 files with different sampling rates, then the window of one of the files needs to be changed. We see that the spectrogram of the track with a frequency of 44.1 kHz looks quite clear, and since the sampling frequency of the second track is approximately 4 times higher, then I propose changing its window from the standard 1024 to 4096 samples.


Well, that's a completely different matter. Of course, this is just an eye-catching comparison.
Let's first take a look at the frequency response of this recording in High Res 24/192 format. What do we have there?

And here everything is in perfect order. The sound engineer cut frequencies above 22 kHz to avoid harmonic distortion.
Now let me clearly show the difference between a 16/44.1 and 24/192 track. The easiest way is to subtract the second from one track. To do this, select, for example, a 16/44.1 track and invert it.

And we will write the result to a WAV file in 24/192 format. We open the resulting file in the editor, and what do we see?

Well, it’s not completely quiet, don’t be upset. To build the frequency response, I had to use another Adobe Audition program, because Audacity does not show below -90 dB. This is the result.

You see, the peak value is -105 dB. Roughly speaking, it’s like the flight of a bumblebee at a rock concert. This is quantization noise. If you normalize it by amplitude, you can even listen to it. It sounds like analog tape hiss. This noise appears due to the difference in the quantization depth of our experimental files, namely 16 and 24 bits.
I hope this article will convince you that storing sound in this format is absolutely pointless. Digitizing vinyl, which is worse in dynamic and frequency range than CDDA, is even more so. The only reason to get a SACD player might be because your favorite record labels have decided to do bad mastering on CDs, forcing you to switch to a new format (or to the old one – vinyl, which is now popular).
Whether you follow the lead or not is up to you.


