Modus Analytical Platform Architecture Part 2: BI
Anatomy of a BI system
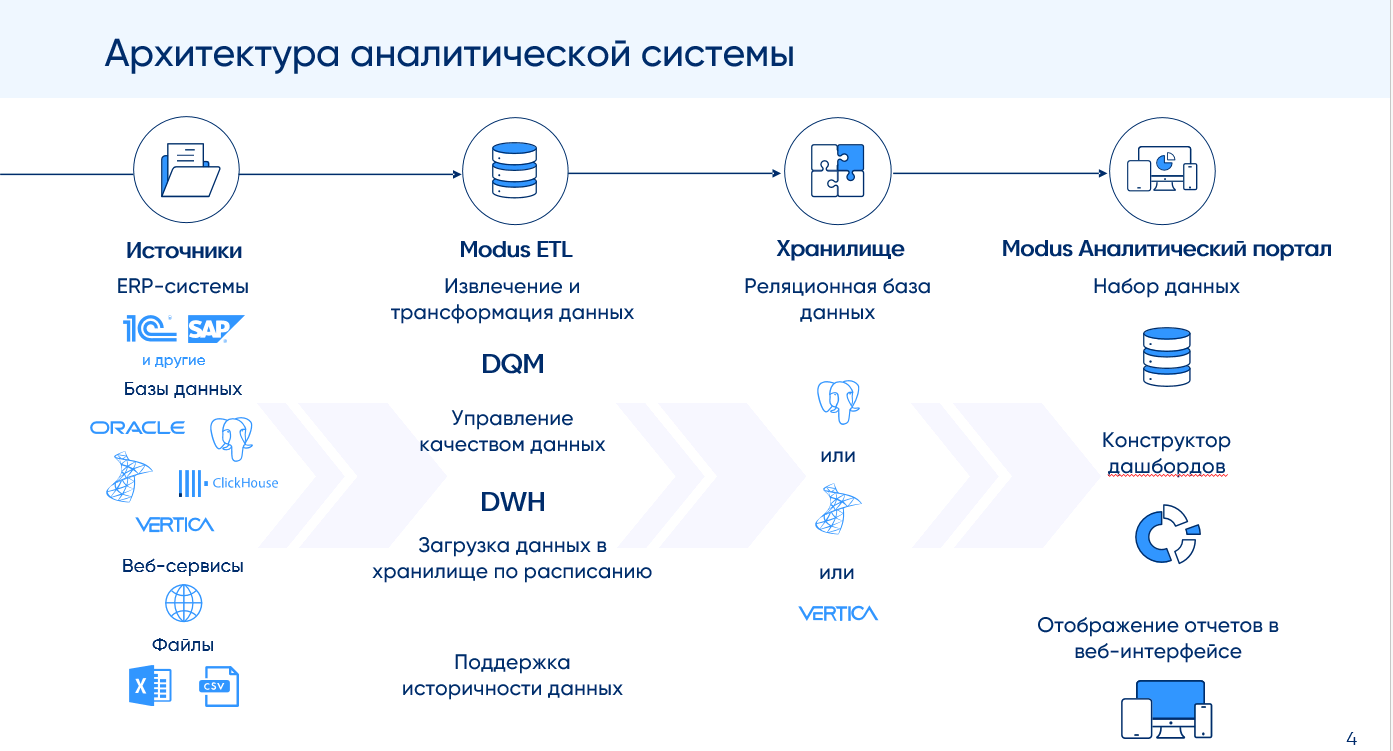
Classical DW/BI has several components:
ETL — data management system;
DWH – data store;
BI – a platform that displays, visualizes data and builds reports.
BI according to the format of the client part is divided into 3 types:
desktop client – the application of the analytical system is installed on the user’s computer;
portal – the analytical system is displayed on a web application;
mobile application – usually used for operational work with the analytical system on a mobile device.
We at Modus use a web portal and we think it’s a more modern solution.
If you really simplify the work of the BI system, then it looks like this: data from DWH gets into the portal service, where it is processed, cached, aggregated and displayed in the interface already in the form of graphs. At the same time, the portal does not always take data from DWH – if there is suitable up-to-date information in the cache, then the service takes it from there.
Below we consider the components and processes in them in more detail.
ETL
Not suitable for BI system raw data – they should be normalized and prepared. Therefore, it is convenient to use ETL tools together with BI.
With the help of ETL, data is transferred to processing layers (staging, cores), where they are cleaned, structured and brought to a normalized form. Data prepared for analytics is moved to the Data marts reporting layer, often organized on OLAP-systems (for example, ClickHouse).
Already in an aggregated form, the data enters the BI system, which displays them in the form of reports, tables, graphs and other visual elements.
ETL tools can be integrated with BI. This allows BI to “learn” about reporting layer metadata, data models, and so on. without any additional settings.
Data sources
A BI system can take data from various sources:
DWH (for example, we work with PostgreSQL, Microsoft Sqlserver, ClickHouse, Vertica, etc.);
from OLAP systems by protocol XMLA;
from files, for example xlsx.
Connecting and receiving data is written and formed through SQL-queries: we put SQL queries in a data set, its description is returned in the form of fields that we can define synonyms, rename or change their types. These fields will then be used to configure the dashboards.
To speed up interaction and data acquisition, various drivers are integrated into our portal to work with DBMS.
When the user works independently and cannot upload data to DWH, the portal can upload information to the database from an xlsx file.

The user selects the uploaded file, sets up the columns, rows and type of uploaded data. A table is automatically created and data is loaded there, a data set is created.
We have a self-service mechanism with which the user can enter data into the analytical portal. To do this, it is enough to describe the data set that will be filled in, draw a form and place elements on it. An analyst or administrator without programming can set up free data entry forms, and consolidated information on them will be displayed in reports. In this case, you can set up restrictions both at the level of access to the forms themselves, and at the level of access to data.
Analytical portal
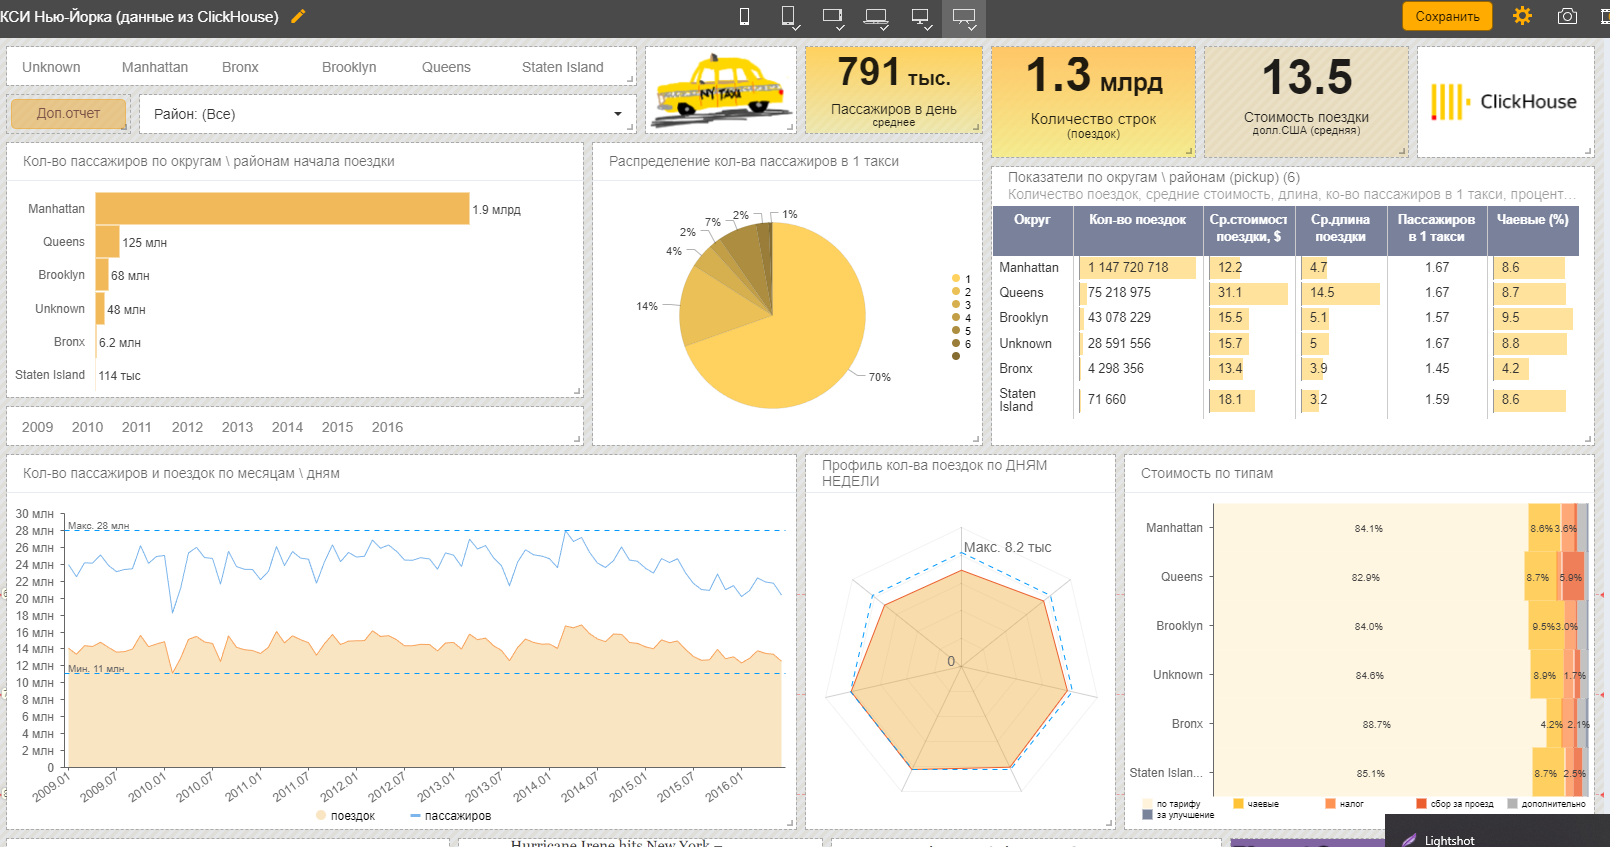
From the sources, the data gets to the final destination – the analytical portal.
We have it SPA a web application that contains a section for administration and settings, and directly dashboards with visualizations.
The portal, like most sites, consists of a frontend (the user interface and accompanying components) and a backend (the part that is responsible for the logic, i.e. everything that is on the server: CMS, API site systems, admin panels and personal accounts, etc.).
Frontend and backend can be written in different languages: the stack is selected based on tasks and functionality. In Modus BI, we have a service written in Go as a backend, and a React application as a frontend. For visualizations, various charting libraries are used – GoJS, AMCharts, at a lower level – D3.
Frontend and backend communicate with each other, usually via the http protocol, the AJAX approach is often used. Our backend provides an API through which the front receives all the necessary data in json.
It is important to remember that in many respects the speed of data output does not depend on the operation of the portal, but on the speed of their issuance by the database. For small volumes up to several million records, it is not very important which DBMS to use. For example, we usually use PostgreSQL. And for a larger volume, for example, several tens or hundreds of millions of rows, it is better to use column databases and special indexes.
We can work with different types of DBMS as a source, but we prefer columnar ones. For example, we now have data sets with several billion rows and analytics on it on a rather weak hardware is issued in a few seconds.
Processes in the analytics portal
The analytical portal includes many functions. Let’s consider some of them in more detail.
User authentication
To work with the BI system, you need to register. And after registration, you need to perform authentication, which can take place using different protocols. Which provide different levels of data security, user access, settings, etc.
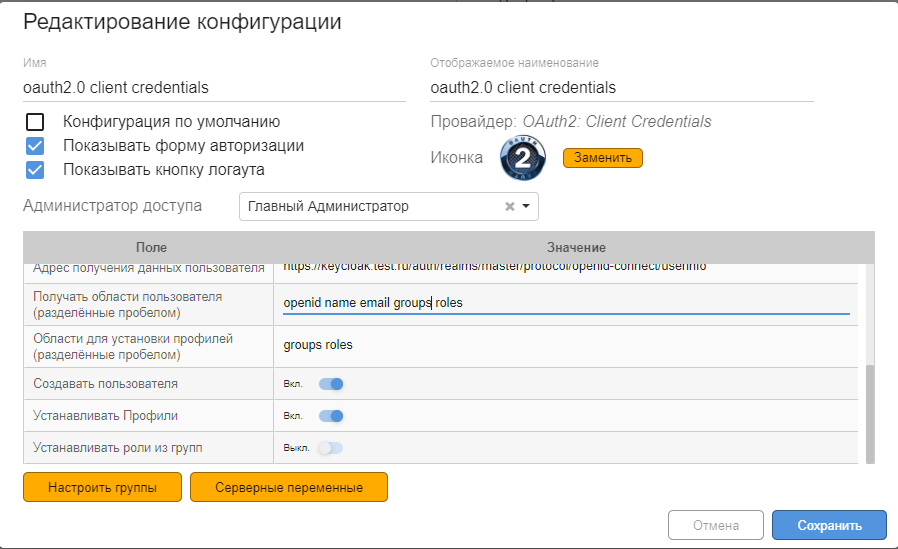
We, for example, have our own authentication system – we can create users on the portal itself. This is the simplest “boxed” option. There are also integrations with SSO systems. You can use SAML (the most popular) or OAuth 2 protocols.
Setting up roles, accesses and RLS
Usually in BI systems there are 3 roles under which you can work:
– users – only view dashboards;
– analysts – can create and view reports allowed by their access profiles;
– administrators – manage the entire portal as a whole: create users, manage access, configure connections to databases, etc.
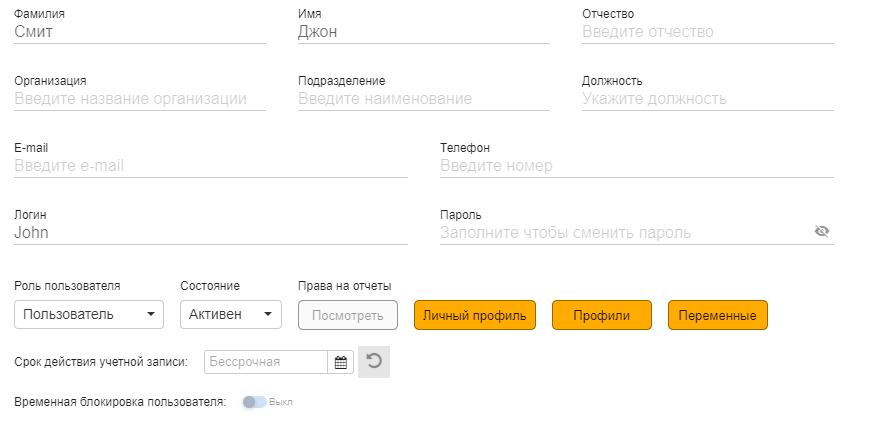
RLS profiles restrict viewing of records at the row level. This is necessary so that users who have access to only a certain part of the information can only view it. For example, in one data set there may be information for all of Russia, and the head of a department should see information only for his region.
When using external authentication services, the connection of user data from an external system with roles and settings in the BI system is very important. The SAML and OAuth 2 protocols convey various information related to account settings. In Modus BI, we can configure the relationship between the transmitted settings and access settings on the portal (flexible data access model).
Storage of settings and metadata
To store meta-information, the BI system must have an internal database. It can be both classic relational DBMS and NoSQL databases. We use PostgreSQL metadatabase. It stores user lists, settings, reports, and so on.
Data caching
For quick return of “hot” information, the BI system can use a caching layer. As a cache, they can use both their own developments and open-source solutions.
We also have a caching layer in Modus BI. It saves the history and next time it will return data for a similar request many times faster. If there is no data in the cache, then it is requested from the source and stored in the cache. This greatly speeds up the work. For example, getting data from ClickHouse can take 500 milliseconds-10 seconds, and from the cache – 1-100 milliseconds.
On-the-fly data correction
It often happens that you need to “correct” the data in the warehouse, without going through the long path “adjustment at the source – updating the raw data layer – the storage core layer – the marts”. To do this, you can adjust the data directly in the dashboard. For example, there is a numerical indicator in the table, and the user wants to edit it. He enters the dashboard, selects the desired entry and edits the indicator. And this change immediately affects the panels associated with it.
Sharing dashboards and embedding in other resources
In BI, it is possible to make individual dashboards public. This is useful if you want to share your work with colleagues or superiors. You can also embed dashboards via iframes on third-party sites and services so that all users can see graphs and charts, for example, on a company website.
Constructor (configuration) of dashboards
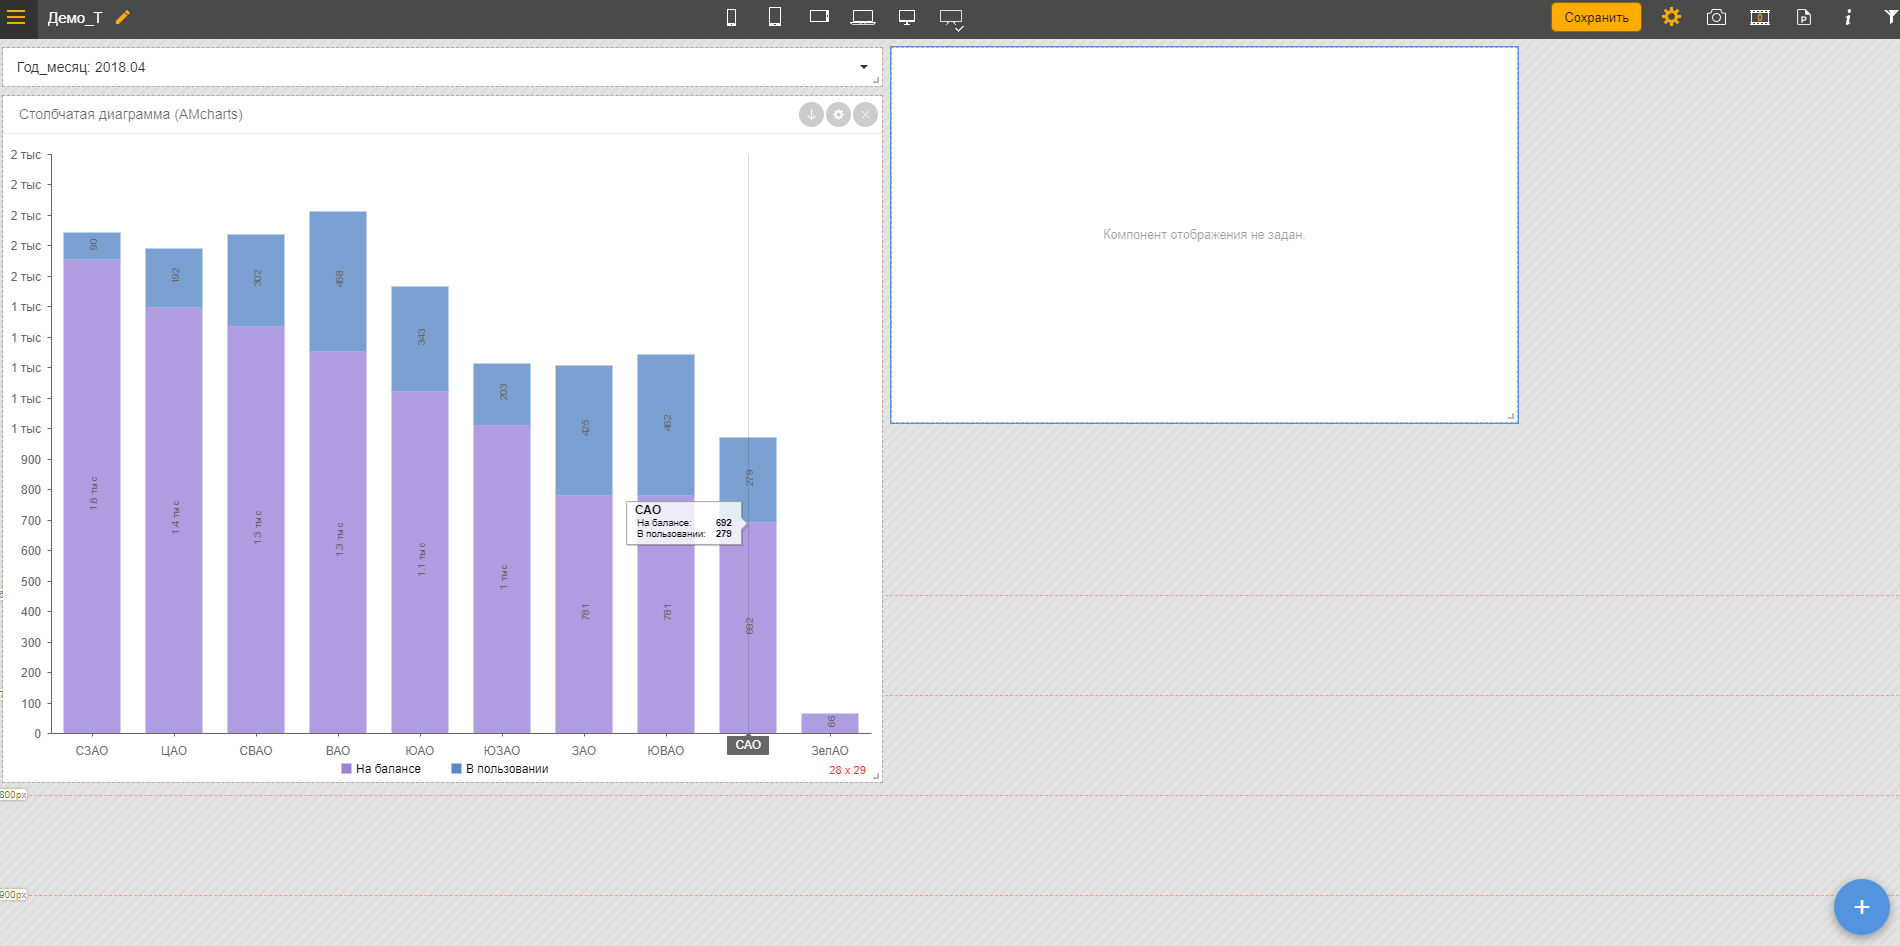
The dashboard builder is a self-service tool that allows the user to customize visualizations and dashboards. All drill-down`s, cross highlighting of the cursor (when we want to see the same indicator on different charts), design settings, layout, etc. configured using the settings fields displayed in the interface.
Each section of the settings is displayed in a separate block. The dashboard is configured in a special editing mode. When the user has selected a data source, configured the indicators that he would like to see, he can, by changing the presentation mode, see how it will look in several versions.
Layout setup
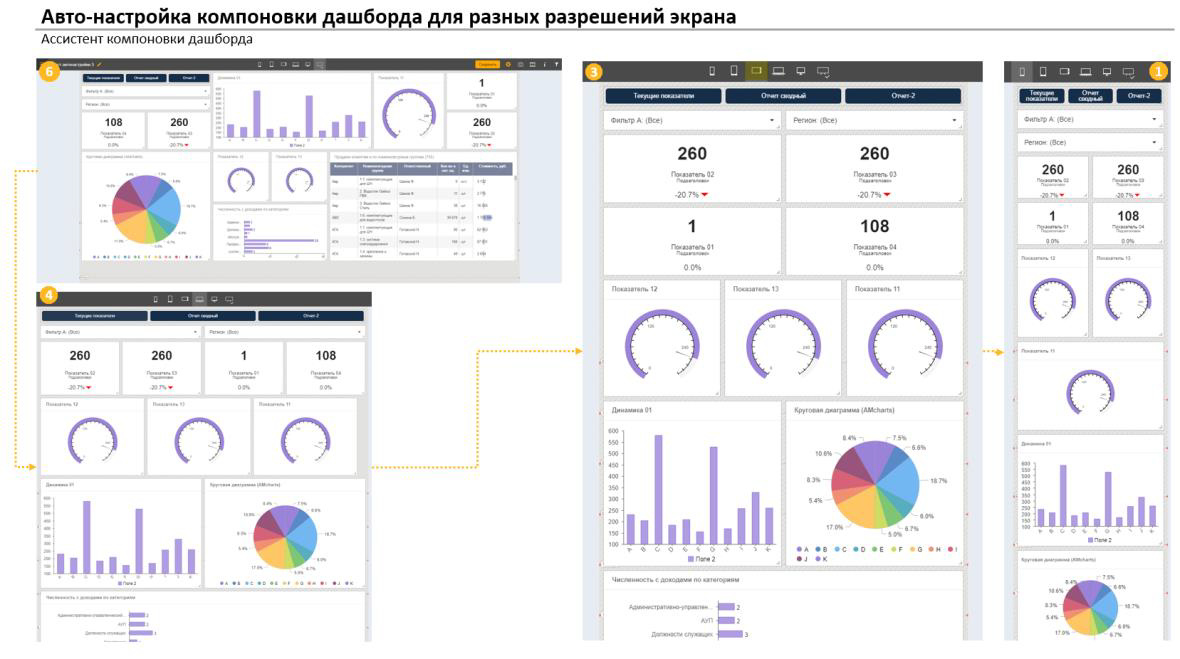
In order for the same dashboards to be convenient on different devices, the user configures the arrangement of elements separately for each resolution: horizontal and vertical options for tablets, scale for regular and widescreen monitors.
Filtration
When viewing dashboards, the user is usually not interested in the entire array of data, but only part of it. Therefore, there are local and global filters. A combination of values can be saved to filter sets, and they become available to other users. When applying different filters, the dashboard is automatically rebuilt. In this case, the filter set can be applied to another related dashboard.
Export dashboard and reports
The user can upload one dashboard element or the entire dashboard. If one element is to be exported, then it can be displayed as a picture or as an Excel file template: you can pre-install a corporate style design template. The shared dashboard canvas can be uploaded as an image (png or jpeg) or as a pptx presentation. This is very convenient, for example, for showing at planning meetings.
Instead of totals
The BI system includes ETL processes, DWH and the analytical platform itself, which can be in the form of a desktop client or a web portal.
Data for BI must be prepared: normalized and cleaned, otherwise you will get a crooked analytics. It is convenient to use ETL tools for this.
Data warehouses (DWH) and OLAP systems are used as a data source for the analytical platform. As an exception, unstructured data, including Excel files, can be used.
The speed of BI depends, among other things, on the chosen DBMS (DWH) and its architecture.
In addition to data visualization, BI systems have a wide range of functions for working with data: setting up user access roles, including at the data row level (RLS), embedding in other services, storing and editing data, filtering, exporting dashboards, etc. P.
BI systems, in general, are a convenient tool for companies with a large amount of data or their sources. This direction is now actively developing towards self-service and low (no)-code, therefore it takes less time compared to the classic methods of analytics “on the knee” in Excel.
In addition, systems are constantly evolving and “overgrown” with additional functionality. For example, this year we are planning to release a functionality with which you can develop and upload your visual components to the portal.
