Svelte – charts
Implementation of interactive charts on svelte…
We will build graphs on frappevia a module made specifically for svelte. The module is called svelte-frappe-charts… More details can be found here:
github.com
The frappe configuration can be found here:
frappe.io
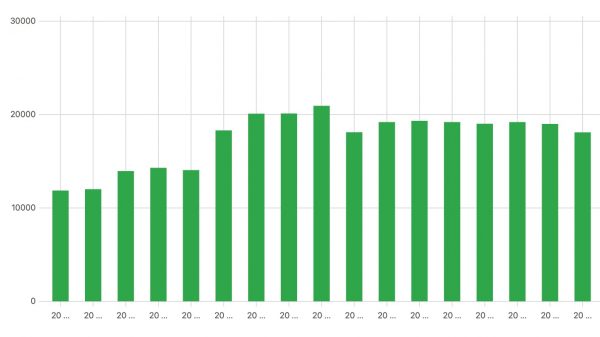
At the output, we get this:
Install svelte-frappe-charts:
npm i –S svelte svelte–frappe–charts
Essential elements. Read why itemsBackup is needed in the svelte table filtering article.
import {getFetch} from ‘../assets/js/main’;
import Chart from ‘svelte-frappe-charts’;
// Essential elements
let items = [];
let itemsBackup = [];
// Graphs
let chartLabels = []
let chartDeposits = []
We load data into svelte asynchronously:
onMount(async () => {
getFetch(‘deposit / get-deposits /’)…then((r) => {
items = r;
itemsBackup = r;
// For charts
r.forEach(function (x) {
chartLabels.push(x.date)
})
r.forEach(function (x) {
chartDeposits.push(x.deposit)
})
chartLabels.reverse()…length = twenty
chartDeposits.reverse()…length = twenty
});
});
Data for graphs:
let chartRef;
let colors = [‘green’]
let data = {
labels: chartLabels,
datasets: [{values: chartDeposits}]
};
Inside contains data of this format:
labels: [‘Sun’, ‘Mon’, ‘Tues’, ‘Wed’, ‘Thurs’, ‘Fri’, ‘Sat’],
datasets: [{values: [10, 12, 3, 9, 8, 15, 9]}]
Graph refresh function:
chartLabels = []
chartDeposits = []
items.forEach(function (x) {
chartLabels.push(x.date)
})
items.forEach(function (x) {
chartDeposits.push(x.deposit)
})
chartLabels.reverse()…length = twenty
chartDeposits.reverse()…length = twenty
data = {
labels: chartLabels,
datasets: [{values: chartDeposits}]
};
}
We put the update on the filter buttons:
function displayOnlyWithNotes() {
items = items.filter(el => el.description ! == ”);
updateData(items)
}
function displayAllNotes() {
items = itemsBackup;
updateData(itemsBackup)
}
Filter buttons:
<div class=“menu-second”>
<div class=“link” on:click={displayOnlyWithNotes}>Show with records onlydiv>
<div class=“link” on:click={displayAllNotes}>show alldiv>
div>
Graph output:
<Chart data={data} type=“bar” colors={colors} height=“400” bind:this={chartRef}/>


