Modeling and visualization in the analysis and design of IT systems. And not only
Problem
No, this is not about visualizing desires and not at all about psychology.
IT professionals apply modeling and visualization to simplify object analysis. Objects can be different: corporations, business processes, customer requirements, or information systems of all sizes.
One of the great philosophers of the 20th century, Ludwig Wittgenstein, pondered how people can exchange ideas among themselves. He suggested that language triggers pictures of objects of reality in people. That is, following the word, a picture-model of reality comes to mind, it helps to mentally see the situation and understand it.
Different situations + different life experiences = different pictures in the head of different people. This interferes with the high-quality transmission of information. Often, we ourselves do not have a clear picture of what we want to convey.
Modern research (for example “Picture or Text First? Explaining Sequence Effects when Learning with Pictures and Text” by K. Scheiter and A. Eitel) confirms that if you supplement the textual information with its visual version, it will be easier to understand and remember.
What is visualization and modeling
Visualization is the general name for techniques for presenting numerical information or a physical phenomenon in a form convenient for visual observation and analysis.
A model is a simplified representation of reality designed to convey information to a specific audience to support analysis, communication and understanding (BABOK 3.0).
Model – A representation of a system, process, service, or other entity that is used to understand and predict their behavior and interactions (ITIL 4).
I had three reasons to write this:
In the modern world, there are a lot of opportunities for self-development. But deciding what is useful and what will increase my value for the employer is a big question.
When I changed jobs, the analyst and project jobs were bewildering with strange skill sets. Often the descriptions were copied explicitly, especially in terms of modeling notations and the use of software for them.
In the integration team, it is important to use such communication methods that the team and outside experts understand. Otherwise, you will not integrate with anyone.
All this led to the idea – to do a little research. I asked IT professionals what modeling and visualization methods they use most often in their work. Now I want to share with you an unbiased and data-driven assessment. Please use.
To whom and why the article is useful:
To whom | Why |
Analysts | Newbies: will understand what to learn to increase their relevance in a desired area, rather than waste valuable time on what later turns out to be inapplicable. Experienced: Will enrich their toolbox based on the practice of other analysts. |
HR | Increase the quality and relevance of vacancies. Jobs will no longer have requirements for skills that are not being used. |
For those who want to work in IT or a related field | They will understand how the models differ from each other, which ones to study first, and which ones later. |
How the data was collected and the study was conducted
The data was collected for 2 months, 193 people participated in the survey. Most of the participants are analysts. The detailed composition will be described inside. The survey was conducted among colleagues in various thematic groups of TG, FB.
Most of the respondents live and work in IT companies in the CIS. There is an opinion that there is a serious difference between these markets. Ukraine and Belarus have a large share of outsourcing projects in Europe and the USA. There is another specificity. This is not taken into account in the survey.
Data has been normalized to improve clarity and readability.
Main part
Visualization and modeling can greatly facilitate understanding of the various processes and situations we are working on. Often, a huge array of unstructured information can lead to analytical paralysis even in the usual subject area. What can we say about new areas.
Presentation in the form of images:
+ Easier to read and understand text.
+ Makes text less monotonous;
+ Information becomes more familiar to the brain. Instead of complex meanings – simple visual objects;
+ Can reflect connections and trends that are difficult to capture through text or numbers;
+ Creates a single information field and context within it with different levels of abstraction;
+ It’s just beautiful;
– May lose some of the transmitted information and oversimplify;
– Often depends on its own context, who creates the model or render;
– Some notations and models require specialized knowledge.
Here’s what Karl Wigers writes in the “Skills for an Analyst” part of the book “Developing Software Requirements”:
“An analyst must be able to work with a variety of tools, from ancient flowcharts and structured analysis models (flow diagrams, entity-relationship diagrams, etc.) to the modern UML (Unified Modeling Language) … Some of these tools are useful for communicating with users, others with developers. “
It is important how Wiegers defines analytics. “Analyst is one of the roles of project participants, not necessarily a job title. The analyst functions can be performed by the project manager, product manager, developer, and even the user. ”
That is, Wiegers considers modeling skills to be indispensable for analytical work, regardless of who is doing it on the team.
The body of knowledge on business analysis (BABOK) distinguishes among the techniques for analysis: modeling of concepts, data, requirements, solutions, scope, processes, states and organizational modeling. As tools it is suggested to use a rich zoo of various notations.
Obviously modeling is an important and useful skill. But what specific models, notations, and styles should you use to make them as clear and useful as possible?
Of this statistician George Box said: “Basically, all models are wrong, but some are useful.”
Poll results
Roles of team members
The poll was placed mostly among analysts. Therefore, the bulk of the 193 participants are system analysts and business analysts (by the way, you can read about how I distinguish them HERE).

How often do they use models
In this table, you can see how often participants use visualizations and models. Obviously, this skill is almost always required. It is important for a systems or business analyst, IT project manager, or IT architect. More than 90% of professionals use visualization and modeling on a daily or frequent basis.

The data supports what was said earlier – modeling is a skill that is used frequently. In the poll the answer was “I never use it,” he received 0 responses.
In what areas do they work
Several areas of specialization could be selected in the survey.
The survey participants are more likely to be involved in fintech, public sector projects, and the introduction of “boxes”. There are even lucky ones (in my opinion) who develop drones.

I cannot say, but it seems that this reflects well the direction of the bulk of IT projects that are being implemented now.
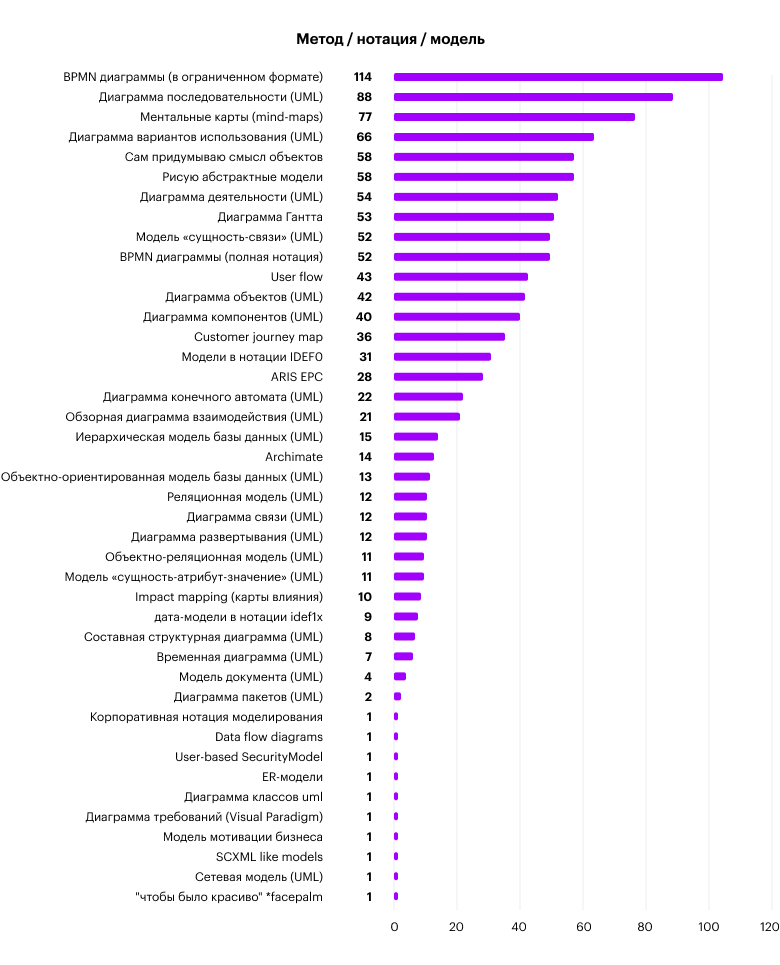
What charts and models are used
In the survey, there was an opportunity to choose a type of model from the list or supplement your own. For more information, I am adding the list in full, so that it is clear both what is used often and what is rather a rarity.
! Important. Note that BPMN is listed in two flavors – full (analytical or executable) and simplified (descriptive).
Where to model and draw
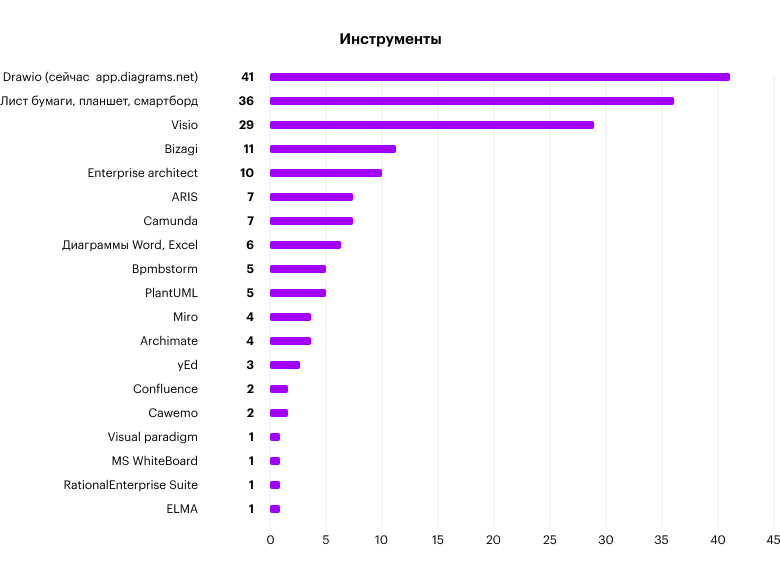
With the information received, everyone will act in their own way. For me personally, the following is obvious:
Working in IT requires understanding and using visualizations and models;
Many of the notations and diagrams that are traditionally taught in universities and courses are obsolete;
My attempts at sketching need to continue as often draw abstractly and by hand;
Job requirements and interview questions often differ from those required in the industry;
This article is not a guide to action and not a requirement to “bury” unused ones. For me, this is a reflection that should be used more often in order to be better understood;
It is now clear which modeling skills should be kept up to date and which of the diagram will not be misunderstood by colleagues.