Making the most of PostgreSQL
. In the laboratory we are testing new equipment for data centers. Find out how we measured PostgreSQL performance on different configurations below!
As before, one of the key goals of the research is to provide useful data that will help you tailor configurations for various databases. Another application of the results is to improve Selectel's internal processes, for example in the area of cloud databases.
The research results are already helping our clients choose ready-made equipment suitable for the load of their service.
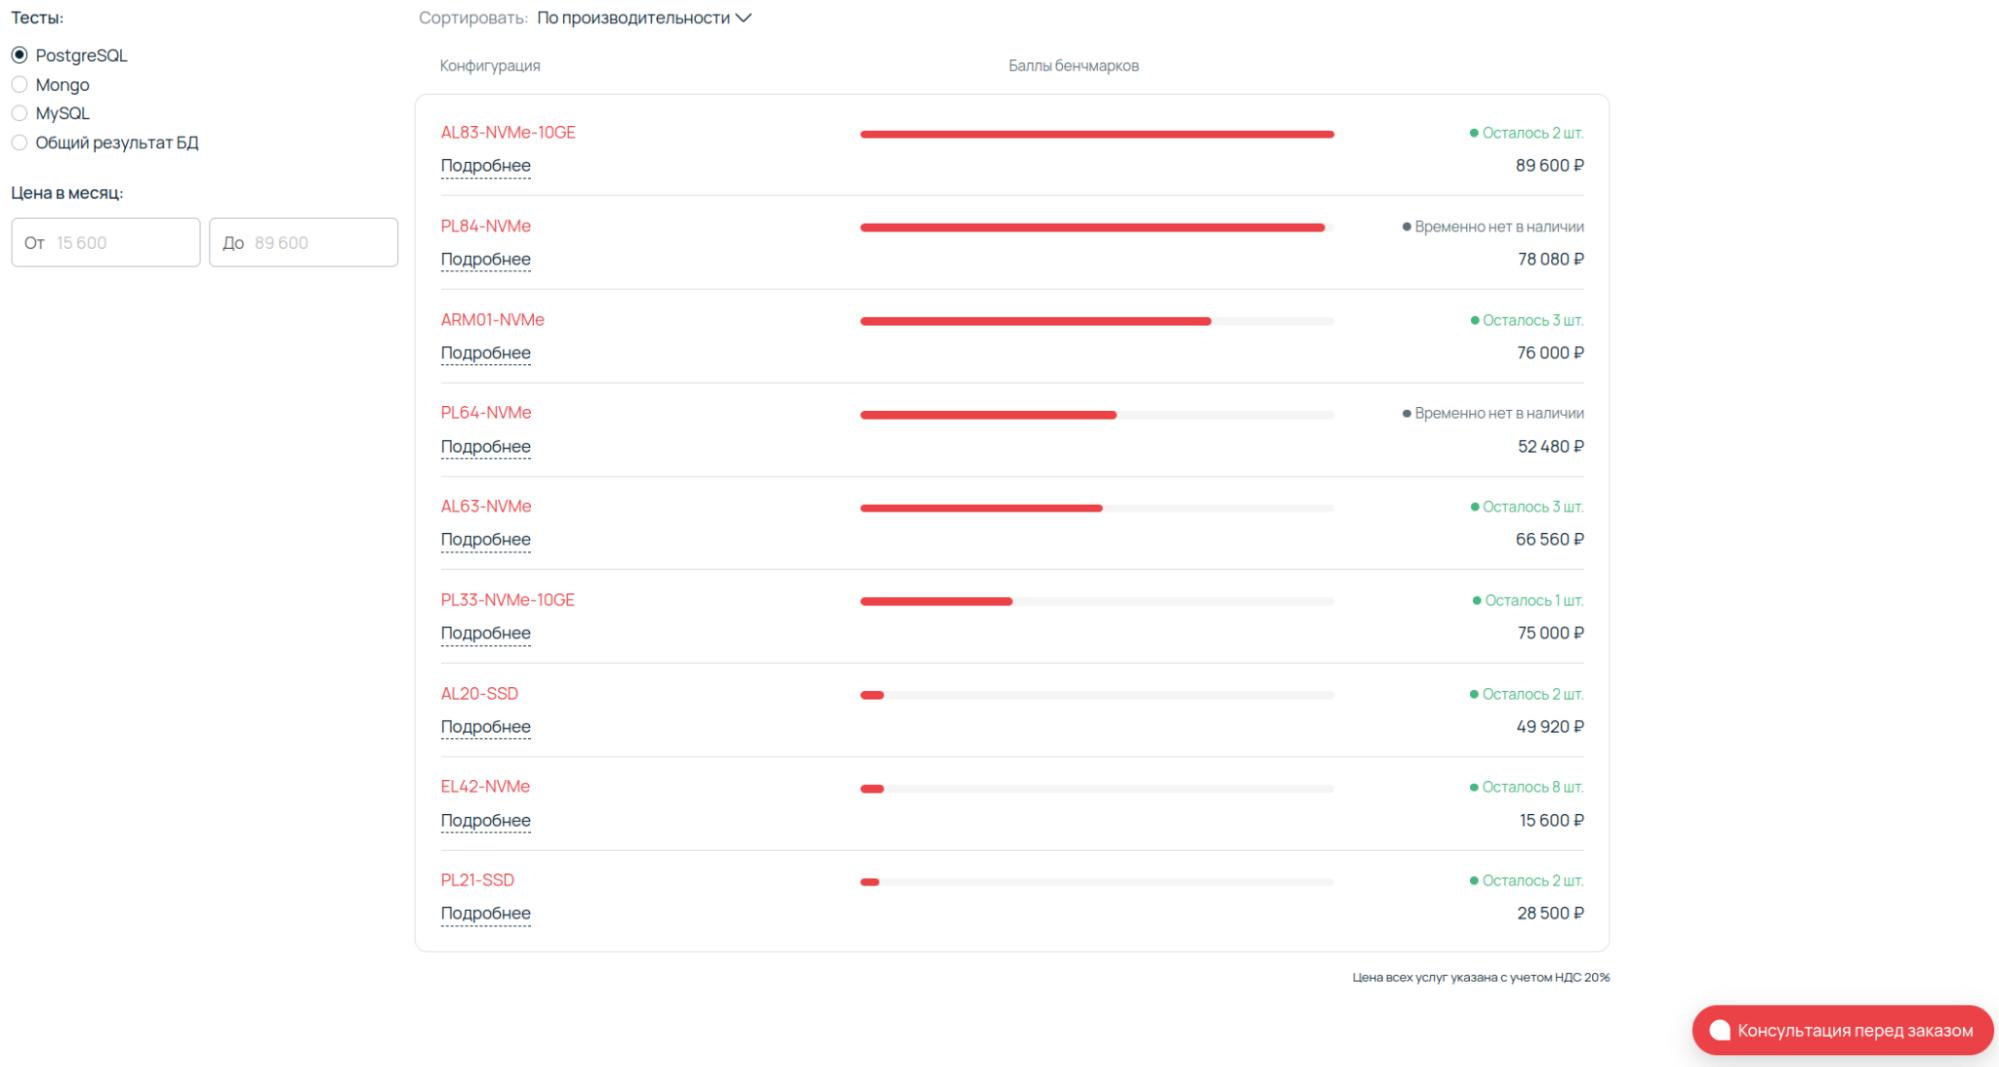
Comparison of performance of ready-made configurations.
Use navigation if you don't want to read the entire text:
→ Server configurations
→ Preparing for testing
→ Automating the pgbench test
→ Parsing results into a Google spreadsheet
→ Test results
→ Conclusion
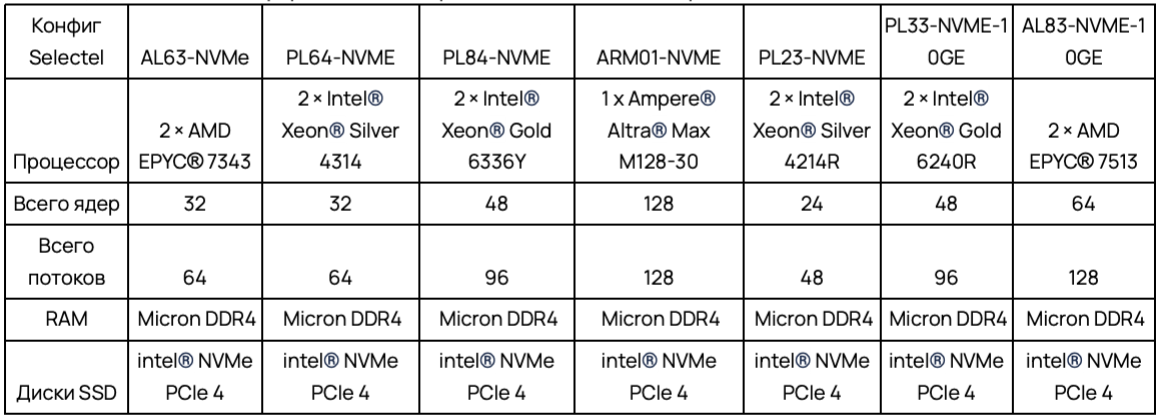
Server configurations
The list of selected configurations is almost the same as in the previous testing, but this time custom solutions are not included in the comparison. Were selected the most popular Selectel dedicated servers. Since the comparison table contains an ARM platform with a large number of cores and threads, the remaining platforms were selected as close as possible to these indicators.
Based on
from previous test results
, our favorite is the single socket ARM01-NVME. For its price, it is an excellent competitor to two-socket systems.
I note that the comparison participants use DDR4 RAM from the same manufacturer, as well as the same SSD drives with support for NVMe and PCIe Gen 4.
All servers under consideration are of a fixed configuration. This means they can be used for work tasks within minutes of being rented. You can assemble any solution, including a custom one, in the dedicated servers configurator.

Preparing for testing
Selecting OS and PostgreSQL version
The operating system was installed on SSD drives. We used Ubuntu 22.04 LTS.
The reason for choosing PostgreSQL is simple – it is one of the most popular databases among our users. Let me remind you that
we used PostgreSQL 14:
PostgreSQL took the latest version 14. I chose it because of its increased performance. In a number of tests, it showed a twofold increase in comparison with version 12 of the database.
This time we will compare Postgres Pro Enterprise 15-16 and PostgreSQL 15-16.
BIOS setup
BIOS and OS are configured in performance mode. Let's look at key BIOS settings that can affect maximum server performance. Next, I'll show the most common settings for Intel®, AMD®, and Ampere® processor platforms.
Intel®
Enable Hyper-Threading
Thanks to Intel® Hyper-Threading Technology, each processor core can run two threads at once. This allows you to increase the number of simultaneously processed tasks and improve the efficiency of using processor resources.
Enabling Hyper-Threading can significantly improve performance in multi-threaded applications and environments where many tasks are running at the same time. For example, in virtualization servers.
Turn on Turbo Boost
If the thermal package and power consumption conditions allow, then Intel® Turbo Boost Technology dynamically increases the operating frequency of processor cores above the base one.
Enabling the setting can significantly improve performance for short-term, high-load tasks. This will ensure efficient energy consumption during idle periods.
Enable Power Management (C-States, P-States) on P0 and C0
C-States allow the processor to enter a low-power state when idle. P-States regulate processor performance by changing its frequency and voltage depending on the current load.
Proper state configuration will help achieve the optimal balance between performance and energy efficiency. This is especially true for environments with variable load.
In Memory Configuration, enable the maximum frequency and use dual-channel mode
Thus, we open access to settings such as choosing the memory operating mode (single, dual, channel, etc.) and manually configuring its delay time.
Optimizing settings can significantly improve memory throughput and speed, which is critical to the performance of computing systems.
AMD®
Enable SMT (Simultaneous Multithreading)
Similar to Intel® Hyper-Threading, SMT® increases the number of threads each core can handle. This improves overall system performance in multi-threaded applications.
Enable Core Performance Boost
AMD® Core Performance Boost technology is similar to Intel® Turbo Boost. It allows processors to increase their frequency above the base frequency depending on heat generation and power consumption conditions.
Enabling the setting provides additional performance for tasks that require high processing power. At the same time, energy efficiency is maintained in less intensive modes.
Disable Power Management (Cool'n'Quiet, Global C-state Control)
Settings help manage processor power consumption by adjusting its frequency and voltage depending on the current load.
Power Management optimization strikes a balance between performance and energy efficiency, reducing power consumption during off-peak periods.
Enable Memory Interleaving
The setting allows you to optimize memory access by distributing data accesses across its various channels.
Enabling Memory Interleaving can significantly improve memory throughput and access time. Particularly important for memory-intensive applications.
Ampere® (ARM server processors)
In Frequency Scaling we enable max_perfomance
The setting allows you to dynamically change the processor frequency depending on the current workload, thereby optimizing power consumption and performance.
This strikes a balance between required processing power and energy efficiency (by adapting to changes in workload).
In Memory Configuration we enable the maximum memory frequency
Provides access to timing settings and memory configurations aimed at optimizing its speed and throughput.
I note that correct memory settings are critical to ensure high system performance. This is especially true for memory-intensive tasks.
Disable Energy Efficiency Modes
Energy efficiency mode settings allow you to choose the optimal balance between performance and energy consumption.
Adaptation to different operating conditions allows you to maximize productivity while minimizing energy consumption. Particularly important for long-term server operation.
General settings for all platforms
Memory Timing. Setting memory timings affects the speed of data processing. Setting lower latency values (CAS Latency, tRCD, tRP, tRAS) can improve performance.
NUMA (Non-Uniform Memory Access) Configuration. Tuning memory usage on multiprocessor systems can significantly improve the performance of applications that are sensitive to memory access latencies.
Intel® Specific Settings
SpeedStep/EIST (Enhanced Intel SpeedStep® Technology). Technology that allows you to change the processor frequency depending on the load. Essential for optimizing energy consumption and performance.
Intel® UPI Link Configuration. Setting the speed of interaction between CPUs using the Intel® Ultra Path Interconnect protocol, which connects processors in multi-socket systems. Affects system and memory performance.
AMD® Specific Settings
Memory Access Mode. Setting the memory access mode (Distributed or Local). Used to optimize performance for the nature of the workload.
Specific settings for Ampere®
Core Frequency Scaling. Dynamic adjustment of core frequency depending on load. With its help, it is possible to obtain a balance between performance and energy consumption.
Configurable TDP (Thermal Design Power). Setting the maximum power that the processor can consume. Allows you to manage the balance between performance and thermal conditions.
When configuring the BIOS, it is important to be aware of the possible impact on system stability and reliability. It is recommended to test after applying changes.
OS setup
In the OS, disable energy saving policies and enable performance mode. Let me remind you that we are using Ubuntu 22.04.
echo performance | tee /sys/devices/system/cpu/cpu*/cpufreq/scaling_governorIn tests we use the maximum operating frequency of processors and memory. Cooling is also set to maximum. On dual-socket systems, NUMA is configured to distribute memory evenly among the CPUs.
We set the number of connections (MAX connection) and database location addresses. In our case, tests are performed locally to eliminate additional points of failure and network delays. We leave the rest of the database settings as default.
We use standard PostgreSQL settings because we do not know the user load profile on the system and we need a performance reference point.
Selecting a test mode
We use the built-in benchmark pgbench, designed to run tests on PostgreSQL. It executes the same sequence of SQL commands and then calculates the average transaction speed (transactions per second, TPS).
By default, pgbench tests a TPC-B based script. It includes five SELECT, UPDATE, and INSERT commands for each transaction. We used the default method and test modifications.
Selected testing keys (modes):
- pgbench –– (mixed queries),
- pgbench –S –T (SELECT ONLY),
- pgbench –N –T (UPDATE).
Automating the pgbench test
Already during the first tests, it became clear that doing this manually would be long and difficult. In addition, when obtaining the first results, an error due to the operation of the iron was discovered.
To eliminate errors, it was decided to conduct the test three times in a row with the calculation of average values. Below is the semantic part of the code.
CORES=$((CPU_THREADS))
HOST="127.0.0.1"
TIME="600"
# Создаем базу данных генерим таблицы
pgbench --username=root -h "${HOST}" test -i -s 10000
# Считаем кол-во потоков и подключенных пользователей
THREADS=(1 2 $(echo "scale=0; $CORES * 20 / 100" | bc -l) \
         $(echo "scale=0; $CORES * 40 / 100" | bc -l) \
         $(echo "scale=0; $CORES * 60 / 100" | bc -l) \
         $(echo "scale=0; $CORES * 80 / 100" | bc -l) \
         $(echo "scale=0; $CORES * 99.9 / 100" | bc -l))

  echo "pgbench --username=root -h ${HOST} test ${PARAM} -T ${TIME}" >> "${FILE}"
  pgbench --username=root -h "${HOST}" test ${PARAM} -T "${TIME}" >> "${FILE}"

  echo "pgbench --username=root -h ${HOST} test ${PARAM} -S -T ${TIME}" >> "${FILE}"
  pgbench --username=root -h "${HOST}" test ${PARAM} -S -T "${TIME}" >> "${FILE}"

  echo "pgbench --username=root -h ${HOST} test ${PARAM} -N -T ${TIME}" >> "${FILE}"
  pgbench --username=root -h "${HOST}" test ${PARAM} -N -T "${TIME}" >> "${FILE}"
done
Here we get the number of cores and calculate the number of threads in a particular system. Next, we indicate to HOST that the database will be located locally on the machine, set the testing time in seconds (TIME), after which we create the test database and set the number of rows. In our testing, a billion rows were created, which took up approximately 250 GB.
As you can see, the pgbench test uses three keys for testing:
- “-” – mixed SQL queries (Select, Update),
- “-S -T” is an ordered sequence of SQL queries (Select only),
- “-N -T” — mode of simple SQL queries (Update only).
We receive the test results in the form of a text file:
pgbench --username=admin -h 127.0.0.1 test -c 52 -j 26 -T 600
pgbench (14.6 (Ubuntu 14.6-0ubuntu0.22.04.1))
starting vacuum...end.
transaction type: <builtin: TPC-B (sort of)>
scaling factor: 10000
query mode: simple
number of clients: 52
number of threads: 26
duration: 600 s
number of transactions actually processed: 22881325
latency average = 1.363 ms
initial connection time = 235.470 ms
tps = 38150.347817 (without initial connection time)
Parsing results into a Google spreadsheet
As a result of each test, we created a .txt file in which the necessary numbers and results were buried. Here is an example of a script with which I collected data and entered it into a Google spreadsheet:
#!/usr/bin/awk -f

BEGIN {
    # Параметры таблицы, выравнивание
    client_width = 10
    thread_width = 12
    tps_width = 20
    trans_width = 20
    latency_width = 20
    init_conn_width = 25

    # Вывод столбцов
    printf "%-s%-s%-s%-s%-s%-s\n", "Num Clients", "Num Threads", "TPS", "Num Transactions", "Latency Average", "Initial Connection Time"
}

# Извлечение нужных значений из строки запуска pgbench
match($0, /-j\s+([0-9]+)/, arr) {
    num_clients = arr[1]
}
match($0, /-c\s+([0-9]+)/, arr) {
    num_threads = arr[1]
}

# Поиск по строкам нужных значений
/number of transactions actually processed:/ {
    num_transactions = $NF
}
/latency average/ {
    latency_average = $(NF-1) " " $NF
}
/initial connection time.*[0-9]+\.[0-9]+/ {
    # Извлечение только числовых значений
    for (i = 1; i <= NF; i++) {
        if ($i ~ /^[0-9]+\.[0-9]+$/) {
            init_conn_time = $i " " $(i+1)
            break
        }
    }
}
/tps/ {
    # Извлечение всех знаков (if present)
    for (i = 1; i <= NF; i++) {
        if ($i == "tps") {
            tps = $(i+2)
            gsub(/[()]/, "", tps) # Удаление TPS знач
            break
        }
    }

    # Вывод
    printf "%-*s%-*s%-*s%-*s%-*s%-*s\n", client_width, num_clients, thread_width, num_threads, tps_width, tps, trans_width, num_transactions, latency_width, latency_average, init_conn_width, init_conn_time
}
After executing the script, columns with the necessary data are displayed in the terminal.
Test results
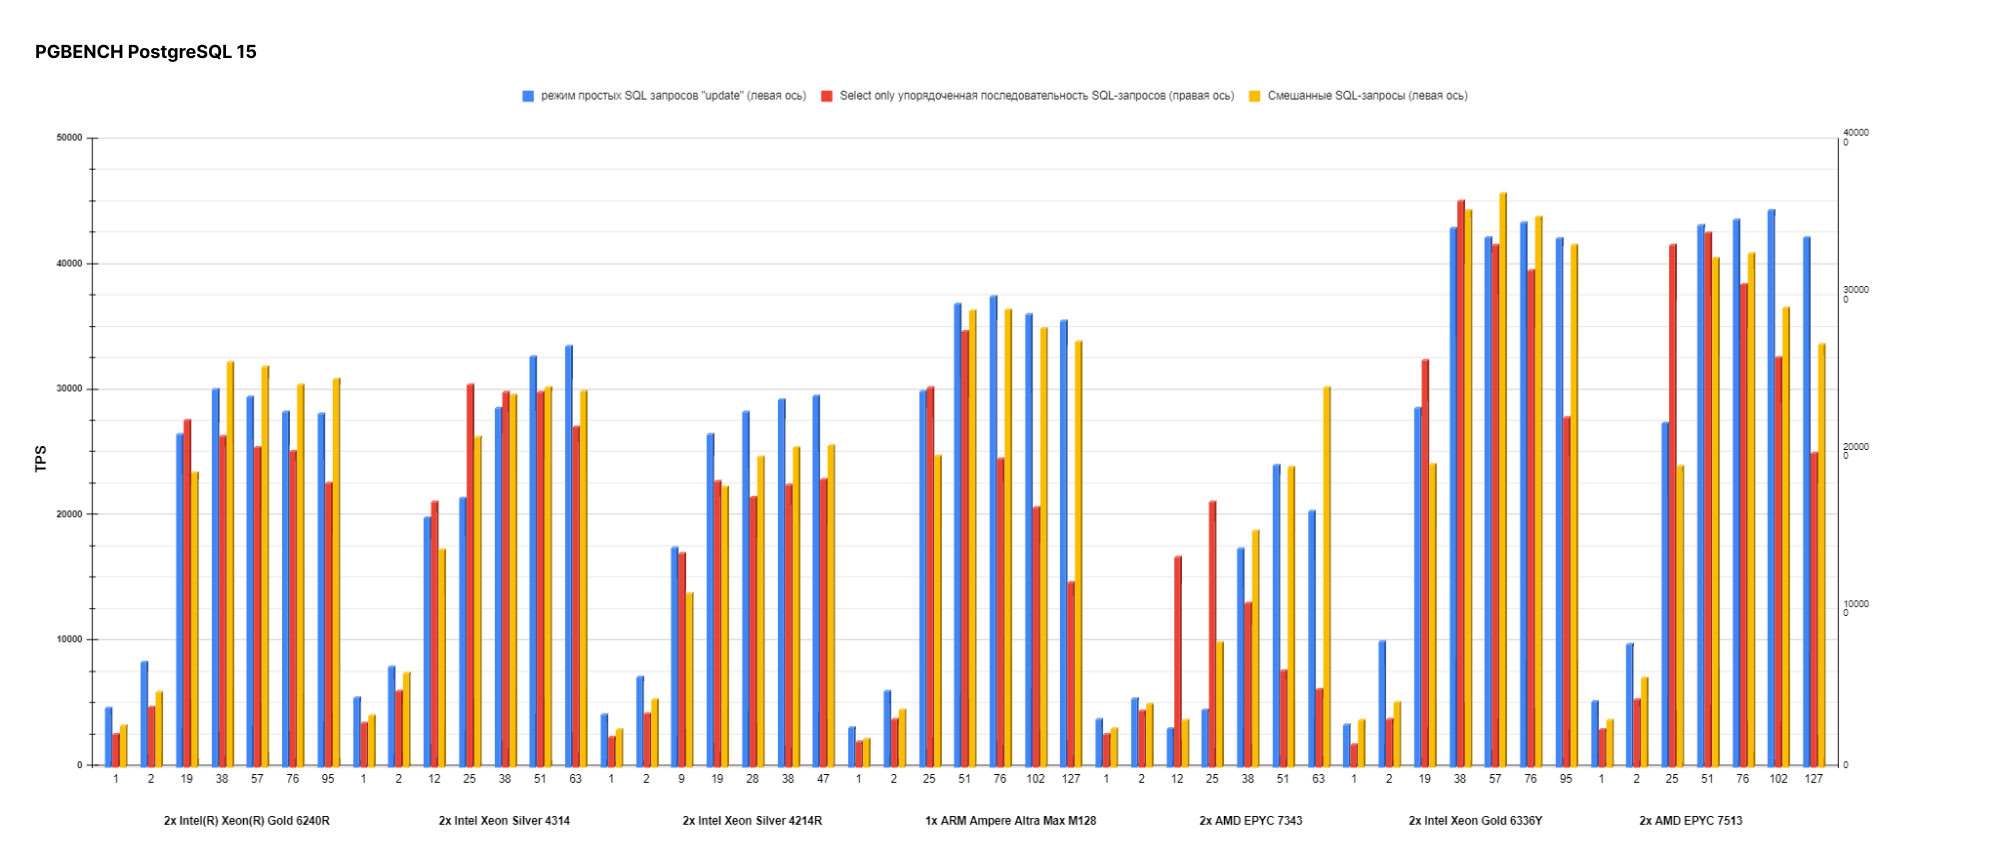
For each version of PostgreSQL and PostgreSQL Enterprise, we generated a graph to evaluate performance in multi-threaded mode:
Graph for evaluating performance per core (in one and two threads):

According to the previous graph, you can see that second-generation processors outperform third-generation processors in terms of performance per core. So a new and expensive solution is not optimal for all scenarios.
Let's move on to the main task – assessing the overall performance of different versions. The values in the graphs are the number of operations per second (TPS).

When comparing standard versions, we found a performance difference of 2 to 7%, as well as a significant gap in SELECT only. Let's move on to the comparison of PostgreSQL Enterprise.
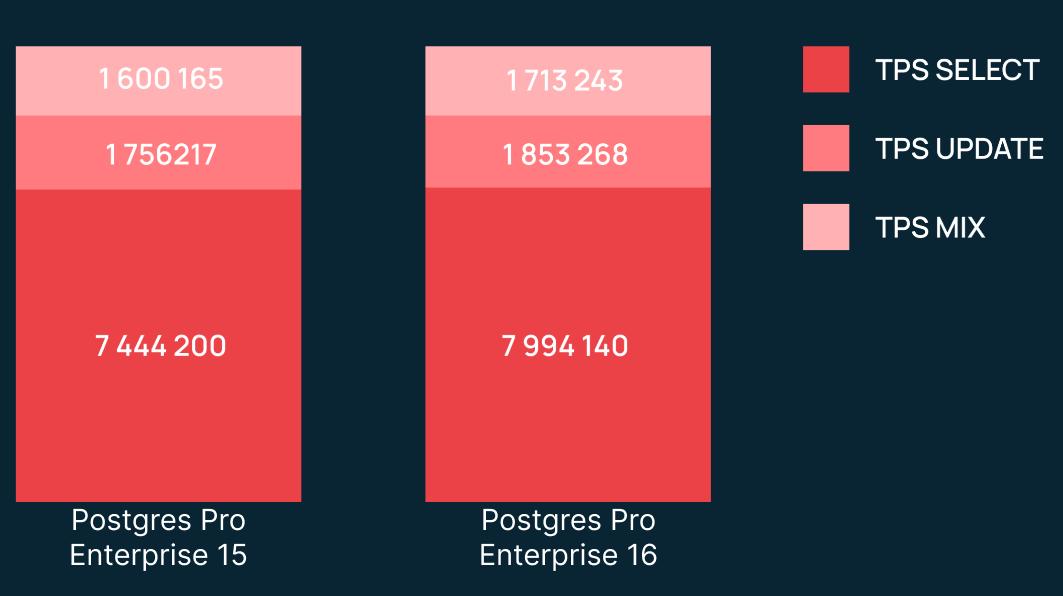
We see that in percentage terms the result is similar to the comparison of standard versions. However, the number of operations per second is much higher here. Now let's compare PostgreSQL and PostgreSQL Enterprise:

Here we see a significant difference in TPS MIX between the standard and Pro versions. One of the reasons is the auto-configuration of Postgres Pro Enterprise, which slightly “tunes” the database for better performance (for us this is still the default, since we don’t do anything out of the box).
There are likely many more optimizations under the hood that we don't see as regular database users.
Next, we decided to squeeze the maximum out of the hardware. Here's what we got:
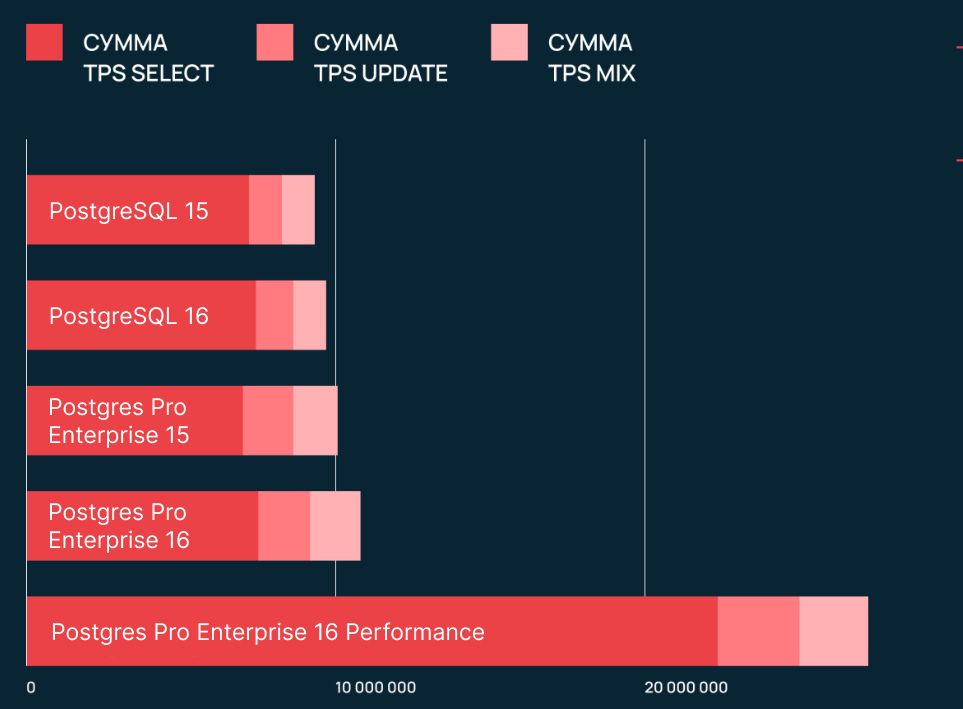
For the performance mode, the database was configured for maximum performance.
- Huge Pages manages large amounts of memory efficiently.
- BG Writer optimizes background writing of data to disk.
- Prefetching provides improved performance when scanning data.
- Moving the pg_stat_tmp directory to RAM (tmpfs) allows you to speed up work with temporary files.
- Autovacuum provides automatic cleaning.
- Write-Ahead Logging – writing before reading, increases the log size, which allows checkpoints to be performed infrequently.
Below is a complete list of settings. You can read their detailed description
in the PostgreSQL documentation
.
#Определить количество HugePages. Обычно их размер равен 2 МБ. Например, нам нужно 3 100 страниц.
#Прописать в /etc/sysctl.conf настройку число больших страниц:

systemctl stop psotgresql
#Проверяем сколько нужно Huge page.
sudo -u postgres/opt/pgpro/ent-15/bin/postgres --shared-buffers=2GB -D /var/lib/pgpro/ent-15/data/ -C shared_memory_size_in_huge_pages
systemctl start psotgresql

echo 3100 | sudo tee /proc/sys/vm/nr_hugepages

#Проверяем настройку:
cat /proc/meminfo
#Число HugePages должно быть ненулевое, а общее должно равняться 3 100.
#Выключаем настройку THP:
echo never > /sys/kernel/mm/transparent_hugepage/enabled
#Устанавливаем группу для Huge Pages.
pg_group_id=$(id -g postgres)
echo "$pg_group_id" | sudo tee /proc/sys/vm/hugetlb_shm_group

sudo sed -i 's/huge_pages = try/huge_pages = on/' /var/lib/pgpro/ent-16/data/postgresql.conf

systemctl restart psotgresql

sudo sed -i "s/^#bgwriter_delay =.*/bgwriter_delay = '10ms'/" /var/lib/pgpro/ent-16/data/postgresql.conf && \
sudo sed -i "s/^#bgwriter_flush_after =.*/bgwriter_flush_after = 0/" /var/lib/pgpro/ent-16/data/postgresql.conf && \
sudo sed -i "s/^#bgwriter_lru_maxpages =.*/bgwriter_lru_maxpages = 4000/" /var/lib/pgpro/ent-16/data/postgresql.conf && \
sudo sed -i "s/^#bgwriter_lru_multiplier =.*/bgwriter_lru_multiplier = 10/" /var/lib/pgpro/ent-16/data/postgresql.conf && \
sudo sed -i "s/^#checkpoint_completion_target =.*/checkpoint_completion_target = 0.9/" /var/lib/pgpro/ent-16/data/postgresql.conf && \
sudo sed -i "s/^#checkpoint_timeout =.*/checkpoint_timeout="30min"/" /var/lib/pgpro/ent-16/data/postgresql.conf

sudo sed -i "s/^#max_wal_size =.*/max_wal_size="32GB"/" /var/lib/pgpro/ent-16/data/postgresql.conf && \
sudo sed -i "s/^#wal_compression =.*/wal_compression = 'lz4'/" /var/lib/pgpro/ent-16/data/postgresql.conf && \
sudo sed -i "s/^#default_toast_compression =.*/default_toast_compression = 'lz4'/" /var/lib/pgpro/ent-16/data/postgresql.conf && \
sudo sed -i "s/^#lwlock_shared_limit =.*/lwlock_shared_limit = 16/" /var/lib/pgpro/ent-16/data/postgresql.conf && \
sudo sed -i "s/^#log2_num_lock_partitions =.*/log2_num_lock_partitions = 8/" /var/lib/pgpro/ent-16/data/postgresql.conf && \
sudo sed -i "s/^#slru_buffers_size_factor =.*/slru_buffers_size_factor = 6/" /var/lib/pgpro/ent-16/data/postgresql.conf && \
sudo sed -i "s/^#default_statistics_target =.*/default_statistics_target = 1000/" /var/lib/pgpro/ent-16/data/postgresql.conf && \
sudo sed -i "s/^#autoprepare_threshold =.*/autoprepare_threshold = 2/" /var/lib/pgpro/ent-16/data/postgresql.conf && \
sudo sed -i "s/^#autoprepare_for_protocol =.*/autoprepare_for_protocol="simple"/" /var/lib/pgpro/ent-16/data/postgresql.conf && \
sudo sed -i "s/^#generic_plan_fuzz_factor =.*/generic_plan_fuzz_factor = 0.9/" /var/lib/pgpro/ent-16/data/postgresql.conf && \
sudo sed -i "s/^#effective_io_concurrency =.*/effective_io_concurrency = 100/" /var/lib/pgpro/ent-16/data/postgresql.conf && \
sudo sed -i "s/^#autovacuum_naptime =.*/autovacuum_naptime="1s"/" /var/lib/pgpro/ent-16/data/postgresql.conf && \
sudo sed -i "s/^#autovacuum_max_workers =.*/autovacuum_max_workers = 6/" /var/lib/pgpro/ent-16/data/postgresql.conf && \
sudo sed -i "s/^#vacuum_cost_limit =.*/vacuum_cost_limit = 2000/" /var/lib/pgpro/ent-16/data/postgresql.conf && \
sudo sed -i "s/^#autovacuum_work_mem =.*/autovacuum_work_mem = '1GB'/" /var/lib/pgpro/ent-16/data/postgresql.conf
Script for transferring the pg_stat_tmp directory to a RAM disk:
#!/bin/bash

# Путь к RAM-диску
RAMDISK_PATH="/mnt/ramdisk"

# Размер RAM-диска (1GB)
RAMDISK_SIZE="1G"

# Путь к каталогу pg_stat_tmp
PG_STAT_TMP_PATH="/var/lib/pgpro/ent-16/data/pg_stat_tmp"

# Переменная для резервного копирования оригинального каталога
PG_STAT_TMP_BACKUP_PATH="/var/lib/pgpro/ent-16/data/pg_stat_tmp_backup"

# Создание каталога RAM-диска
sudo mkdir $RAMDISK_PATH

# Примонтирование RAM-диска
sudo mount -t tmpfs -o size=$RAMDISK_SIZE tmpfs $RAMDISK_PATH

# Копирование данных из pg_stat_tmp в RAM-диск
sudo cp -r $PG_STAT_TMP_PATH/. $RAMDISK_PATH/

# Создание символической ссылки
sudo mv $PG_STAT_TMP_PATH $PG_STAT_TMP_BACKUP_PATH
sudo ln -s $RAMDISK_PATH $PG_STAT_TMP_PATH

# Проверка создания символической ссылки
ls -l $PG_STAT_TMP_PATH
Conclusion
All the optimal performance settings that I talked about in the article have already been performed during the development of the Cloud product for PostgreSQL. Also, the service has additional advantages such as:
- selection of equipment for high performance DBMS;
- installation and optimization of DBMS parameters;
- installation, configuration and updating of the OS and service components;
- setting up failover cluster replicas;
- providing resources for scaling the DBMS;
- setting up a local network in the data center for high cluster performance;
- DBMS monitoring;
- Free daily cluster backup (Point-in-time Recovery), storage depth – one week;
- storage of data according to 152-FZ;
- compliance with major security standards, including PCI DSS 3.2.1, ISO 27001, ISO 27017, ISO 27018.
Research results are constantly used in the development of Selectel products and services, thanks to which
.
Among other things, in testing we confirmed that, if possible, it is better to always upgrade to a new version of PostgreSQL. This is true for both the standard and Pro versions. To preset the BIOS, OS and the database itself, you can use our tips. If you need a service where all the necessary optimizations have already been applied, then this is Selectel Cloud Databases. For best performance, use PostgreSQL Enterprise Pro with tuning database settings.
What databases do you use in your projects and how do you configure them? Share in the comments, it will be interesting to read!