how to find and eliminate the cause
.NET developers know what it's like to wait for code to build. It is impossible to work in this case: until you see how the application is updated, you will not move on to the next step. And you won’t have time to switch to another task during this time. It turns out that if you rewrite the code 5 times a day, you can lose half an hour during assembly, or even more.
Now using the Mindbox marketing automation platform as an example. The main software solution is a monolith in C#: several million lines, 50 projects, on which dozens of teams are working simultaneously. Even a minute saved during assembly adds up to a ton of productive man-hours. So when it came to talking about moving the entire company to MacBooks in the future, we decided to find out how this would affect productivity.
Comparison of code assembly speed on MacBook Pro and Dell XPS. We used .NET SDK 7.0.100-rc.2, the experimental conditions were set using two commands:
# Удаляет все файлы и папки, которые Git не отслеживает.
git clean -fxd

# Восстанавливает все пакеты в решении без использования фоновых процессов сборки (воркеров), так как их кэш может влиять на время сборки.
# Аргумент --disable-build-servers доступен начиная с .NET 7.
dotnet restore --disable-build-servers
To measure the build time of the project, we used the command:
# Собирает решение без запуска фоновых воркеров, пропуская этап восстановления пакетов.
dotnet build --no-restore --disable-build-servers
It turned out to be a MacBook three times loses in performance:
Device | CPU | RAM, GB | Time |
MacBook Pro 16″ (2021) | Apple M1 Pro 10c | 16 | 00:10:27.56 |
Dell XPS 9510 | Intel Core i9 11900H 8c16t | 32 | 00:03:28.55 |
After this result, we began an investigation: we analyzed the load on the cores, studied the logs, traced all suspicious processes and found out where 7 minutes were lost. In this article we will tell you how to detect and overcome the cause of a slow build.
The problem is not in the processor: three erroneous hypotheses
The first guess was that the poor performance of the build process on the MacBook was due to processor deficiencies.
Hypothesis 1: CPU performance is not enough for fast assembly on a MacBook. This assumption can be easily verified with Activity Monitor, a utility that shows the load on each core in the processor:
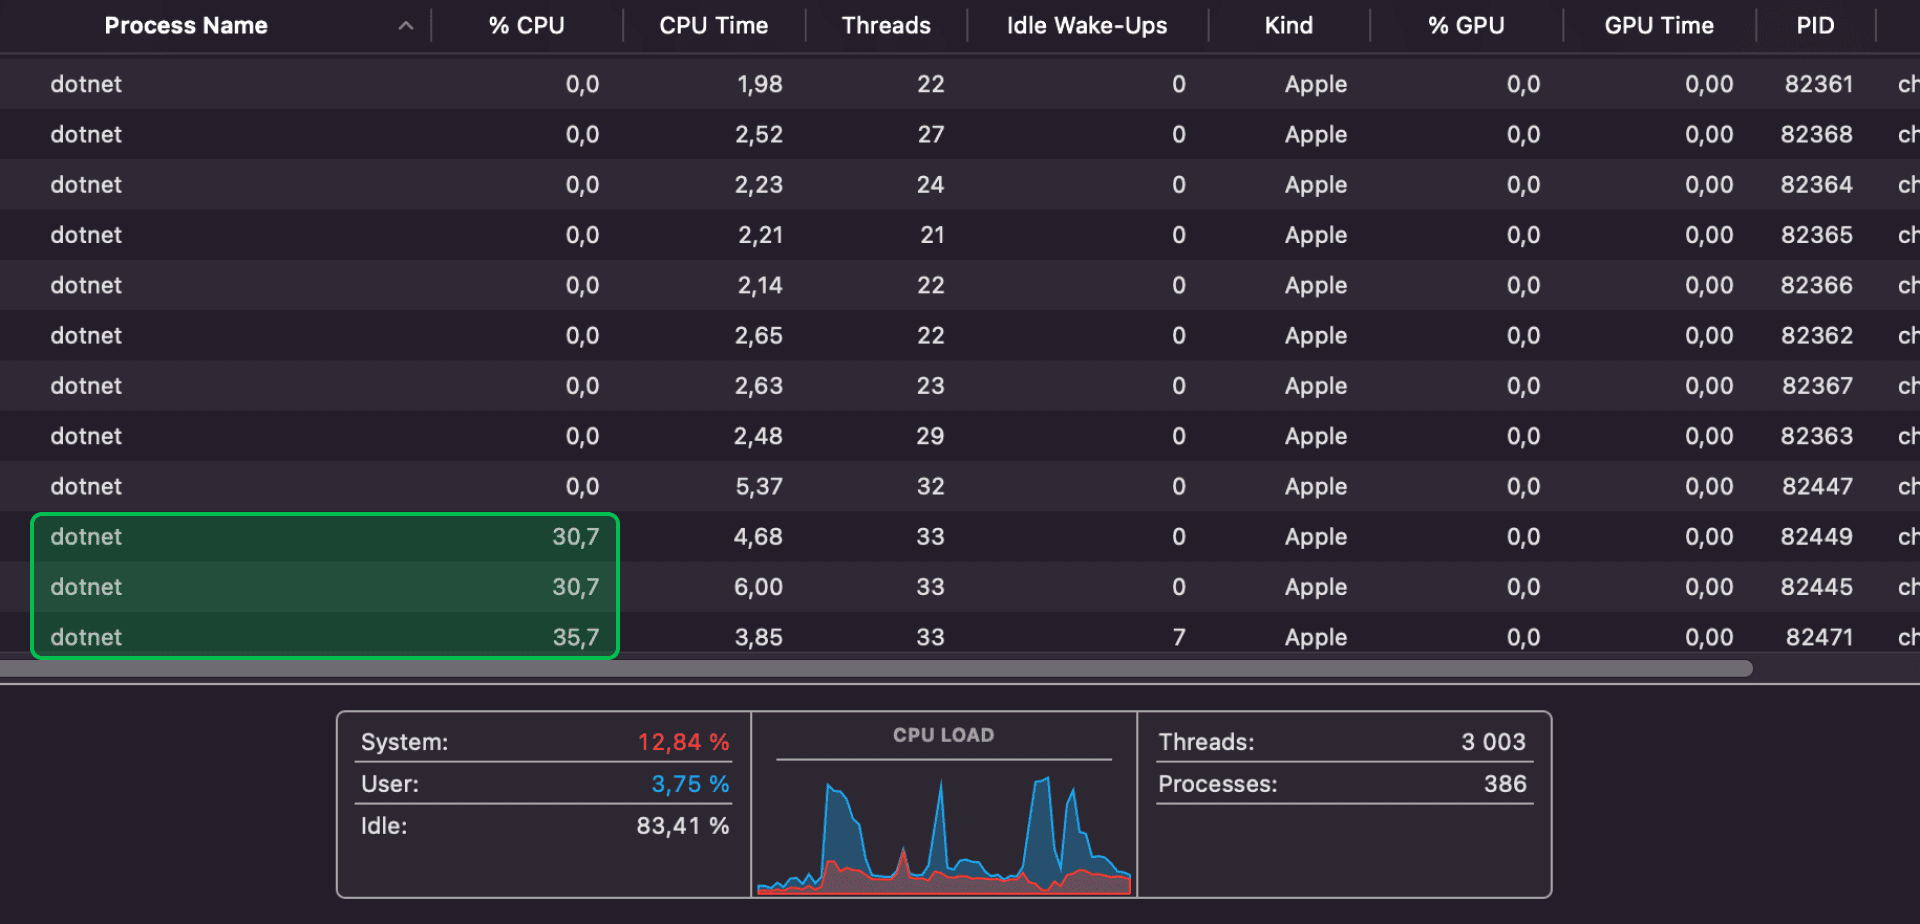
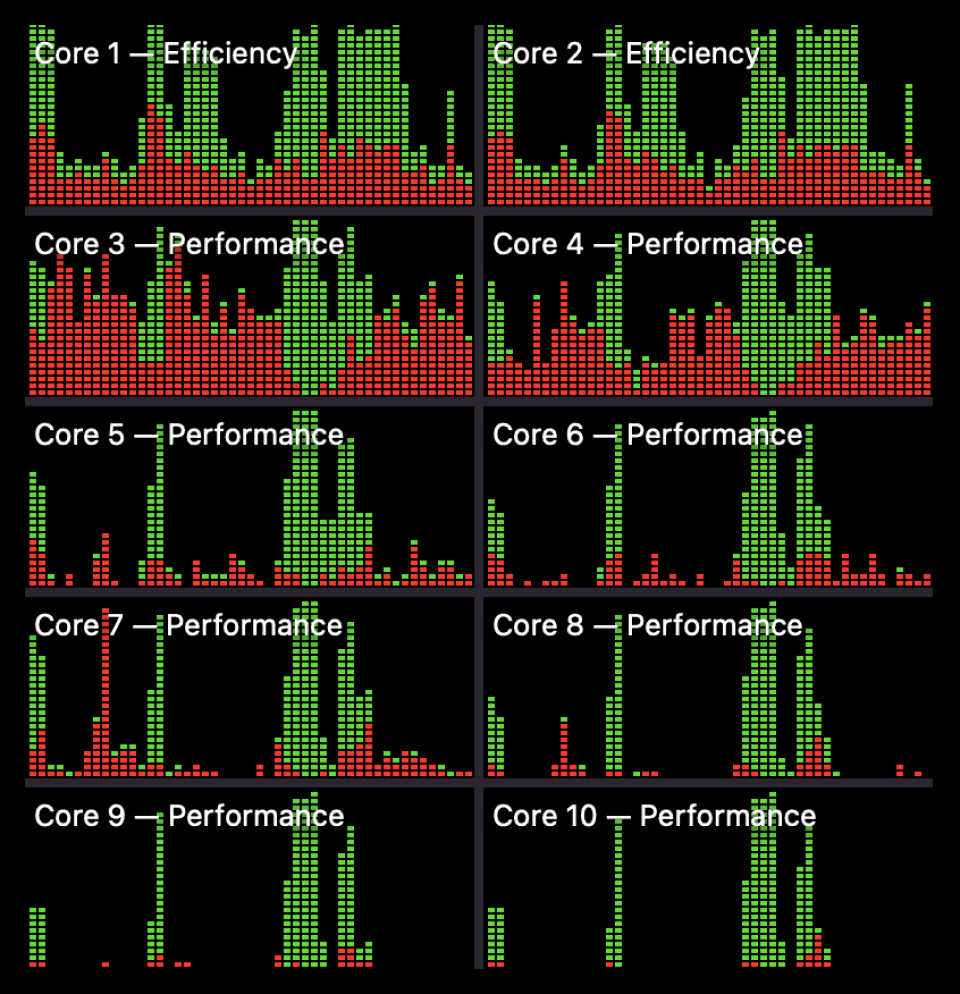
The graph above shows rare load peaks when all 10 cores are used. But basically, the third and fourth ones, between them, execute system code sufficient to occupy one entire core. It turns out that it is constantly working, although it is not involved in assembling the code. Meanwhile, 6 cores are completely free, which means CPU performance is not a problem.
Hypothesis 2. The processor compiles on energy-saving cores. The processor in the MacBook M1 Pro uses ARM architecture with technology big.LITTLE. This technology divides all processor cores into two types – energy-saving and productive. It can be assumed that performance drops due to the compiler running on energy-saving cores. But this option is out of the question: the previous graph shows that the main load is divided between two productive cores (Performance).
Hypothesis 3. .NET is poorly optimized for ARM processors. To test whether ARM has an impact on performance, we conducted several experiments. At the time of testing, support for macOS on ARM by .NET runtime was quite recent, and flaws were regularly found in it.
First, we tested the behavior when using a Windows virtual machine under ARM. The virtual machine was allocated 6 cores and 8 GB of RAM. Result compared to MacBook:
OS | Number of cores | Time |
Windows | 6 | 00:05:41.69 |
macOS | 10 | 00:10:27.56 |
Even with fewer cores, Windows builds twice as fast as macOS.
The problem is probably due to the specifics of macOS running on ARM. To find out, we tested the build on a MacBook Pro 16″ (2019/i9 8-core/16GB) with an Intel processor and on a Windows virtual machine with the same Intel, for which we allocated 4 cores and 6 GB of RAM. Results:
OS | Number of cores | Time |
Windows | 4 | 00:07:42.12 |
macOS | 8 | 00:13:50.22 |
It turns out that the processor does not play a role – the performance problem is specific to macOS.
MSBuild log analysis: error during build process
When all the processor-related hypotheses were refuted, all that remained was to look for the problem in the assembly process itself, that is, in the logs.
MSBuild describes in detail each action performed if you set the logging level (verbosity) in the command line arguments to detailed or diagnostic. However, such logs are often inconvenient to analyze: they mix events from different workers working in parallel. The resulting file can weigh hundreds of megabytes and be difficult to find anything in it. Binlog (also known as structured log) helps – a log recorded in binary format and structured by types and order of events. It untangles the stream of logs from different workers, but this is not the only advantage of binlog compared to a text log:
it is 10–20 times lighter;
less impact on assembly speed;
can be converted to a text log if necessary.
To write binlog during build, just pass the argument -bl:
dotnet build -bl ...You can analyze such logs in the program MSBuild Structured Log Viewer. There is a version based on WPF (Windows Presentation Foundation) for Windows, a cross-platform version based on the Avalonia framework, and even online version on Blazor. However, you can currently view the timeline only in the WPF version, and this is important: otherwise you won’t be able to calculate at what point and at what operation the build slows down.
The build binlog is written with the command dotnet build -bl --no-restore --disable-build-servers in the folder with all the solution projects. The msbuild.binlog file appears there with all the recorded information. You need to open it in MSBuild Structured Log Viewer, go to the folder with the ten most time-consuming tasks and see how long they took to complete.
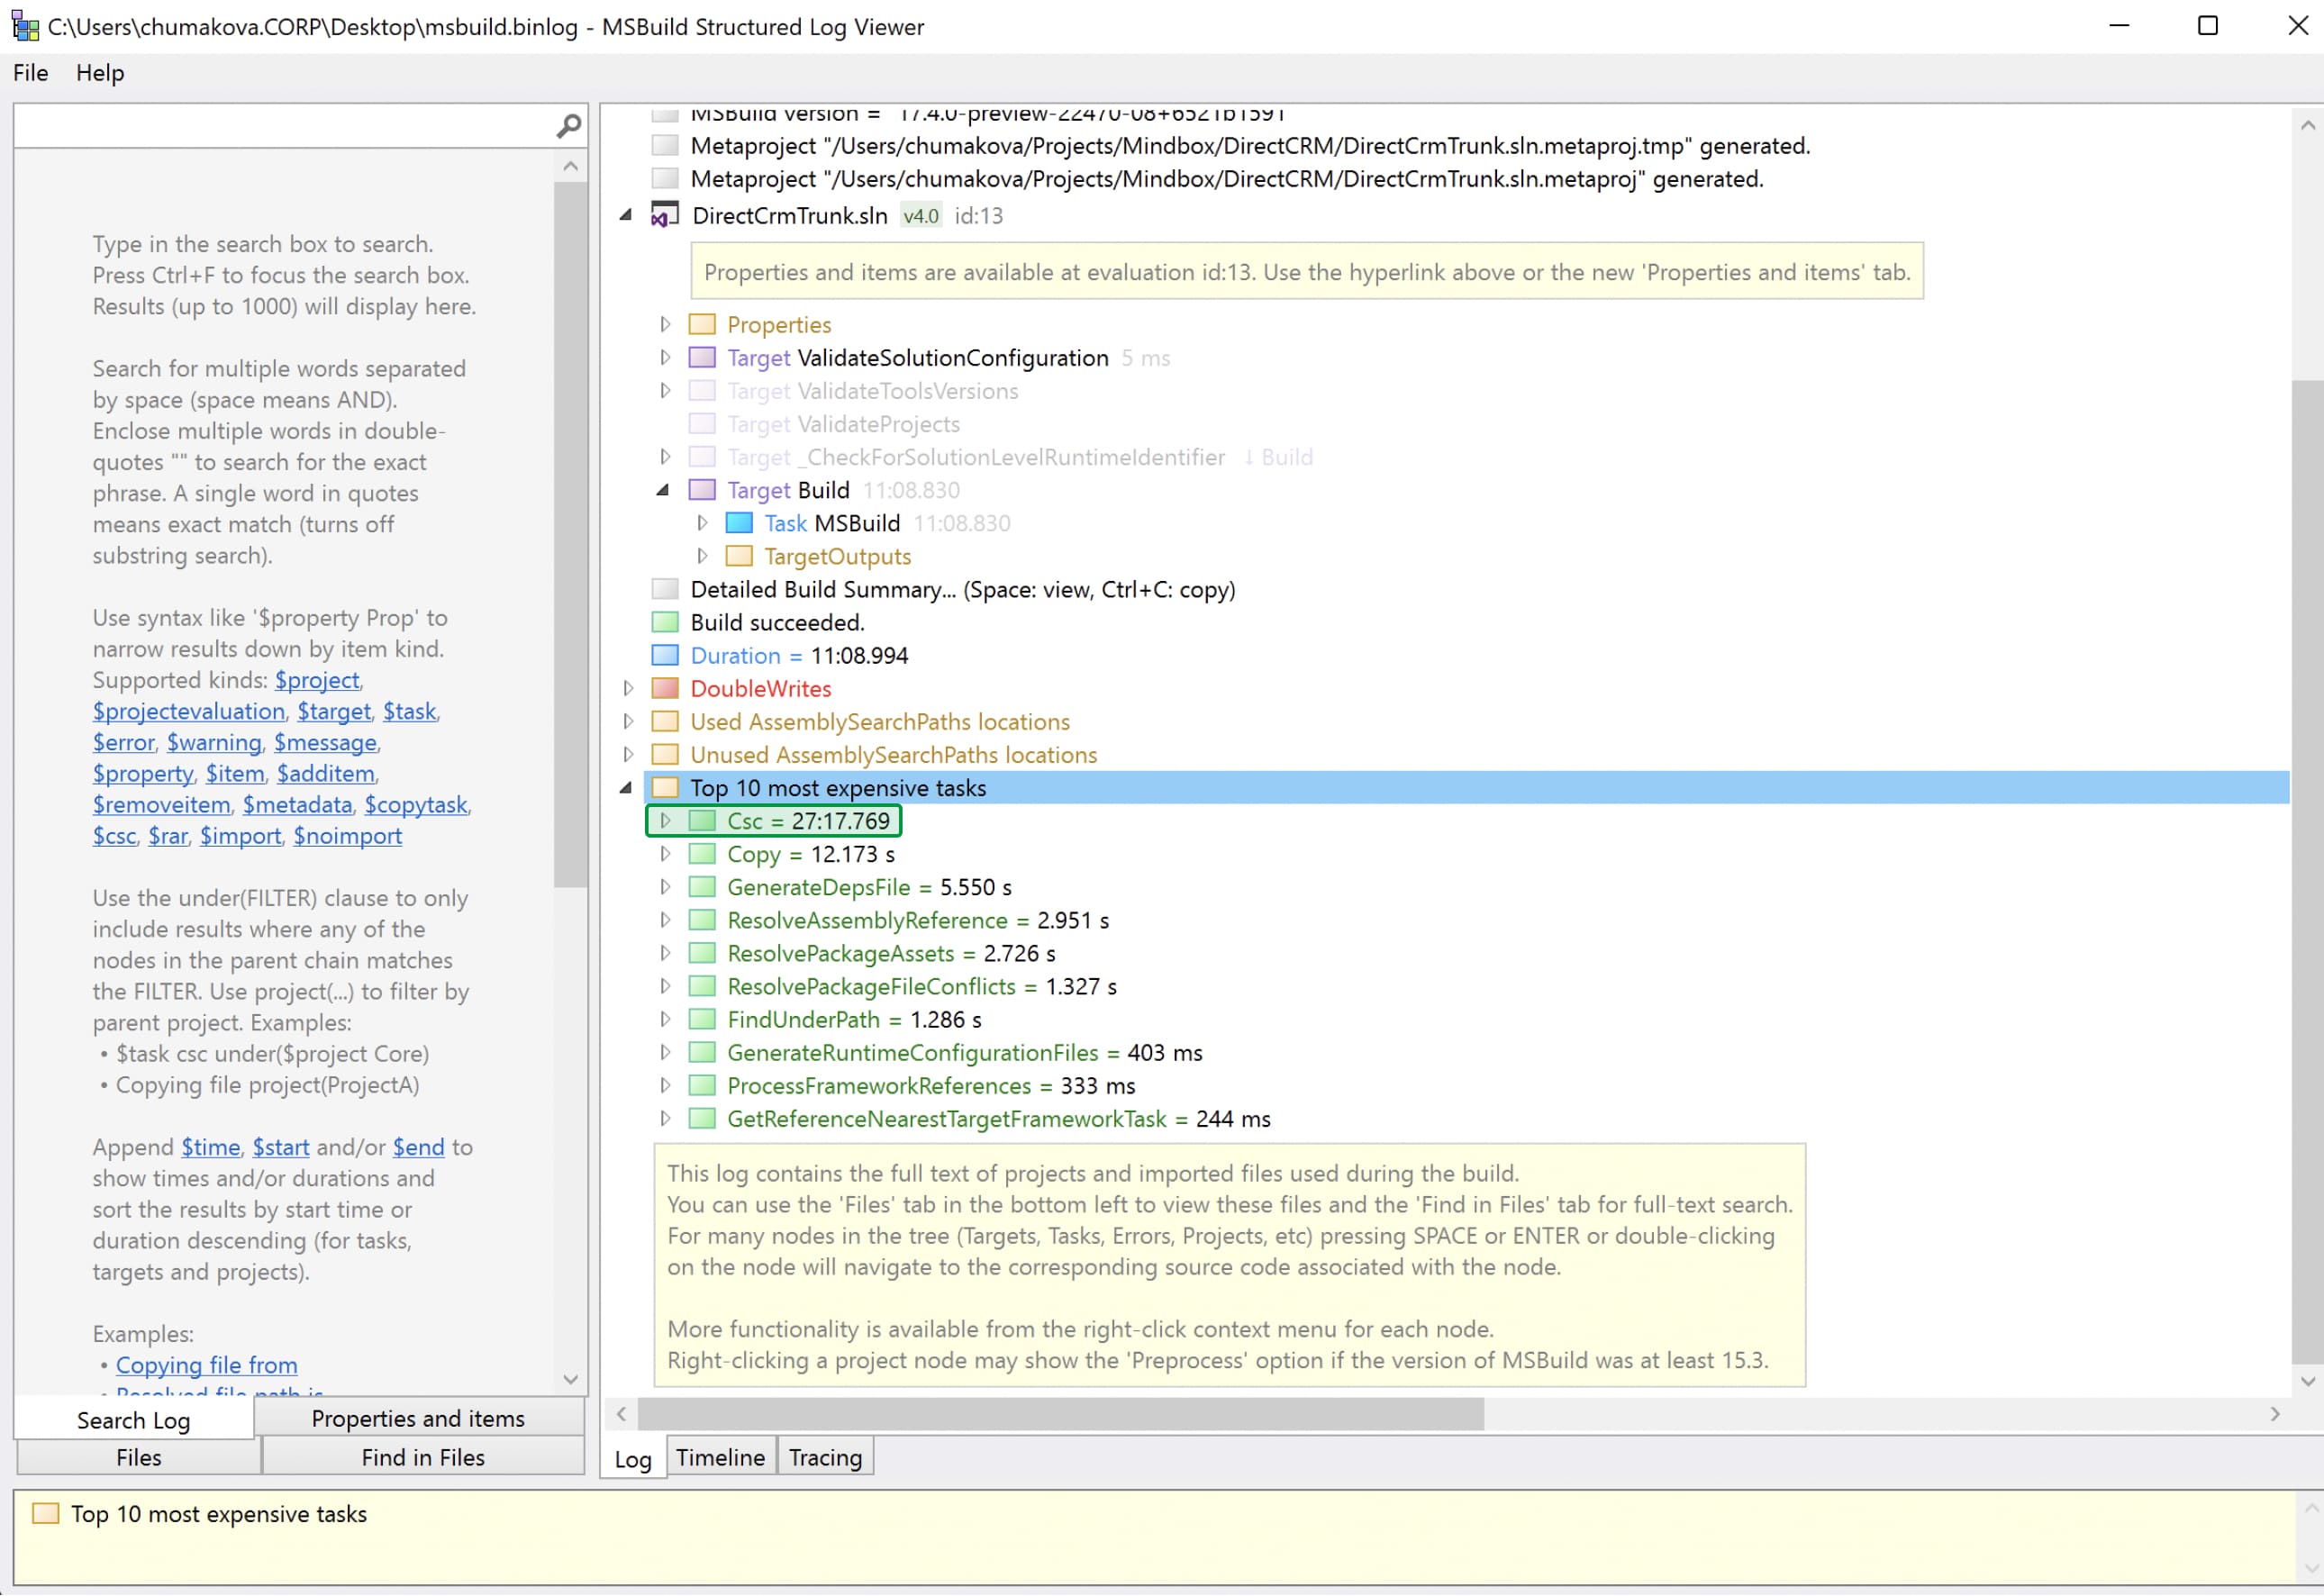
The Tracing tab displays by the second what each worker was doing. Let's filter out everything unnecessary, leaving only the display of tasks being performed:


As you can see, most of the time only one or two tasks are executed at a time and they last on average a minute. It is not clear why these tasks take so long to complete. To find out, we analyzed one of these tasks and tried to find a parameter that slows down the code assembly, but without success.
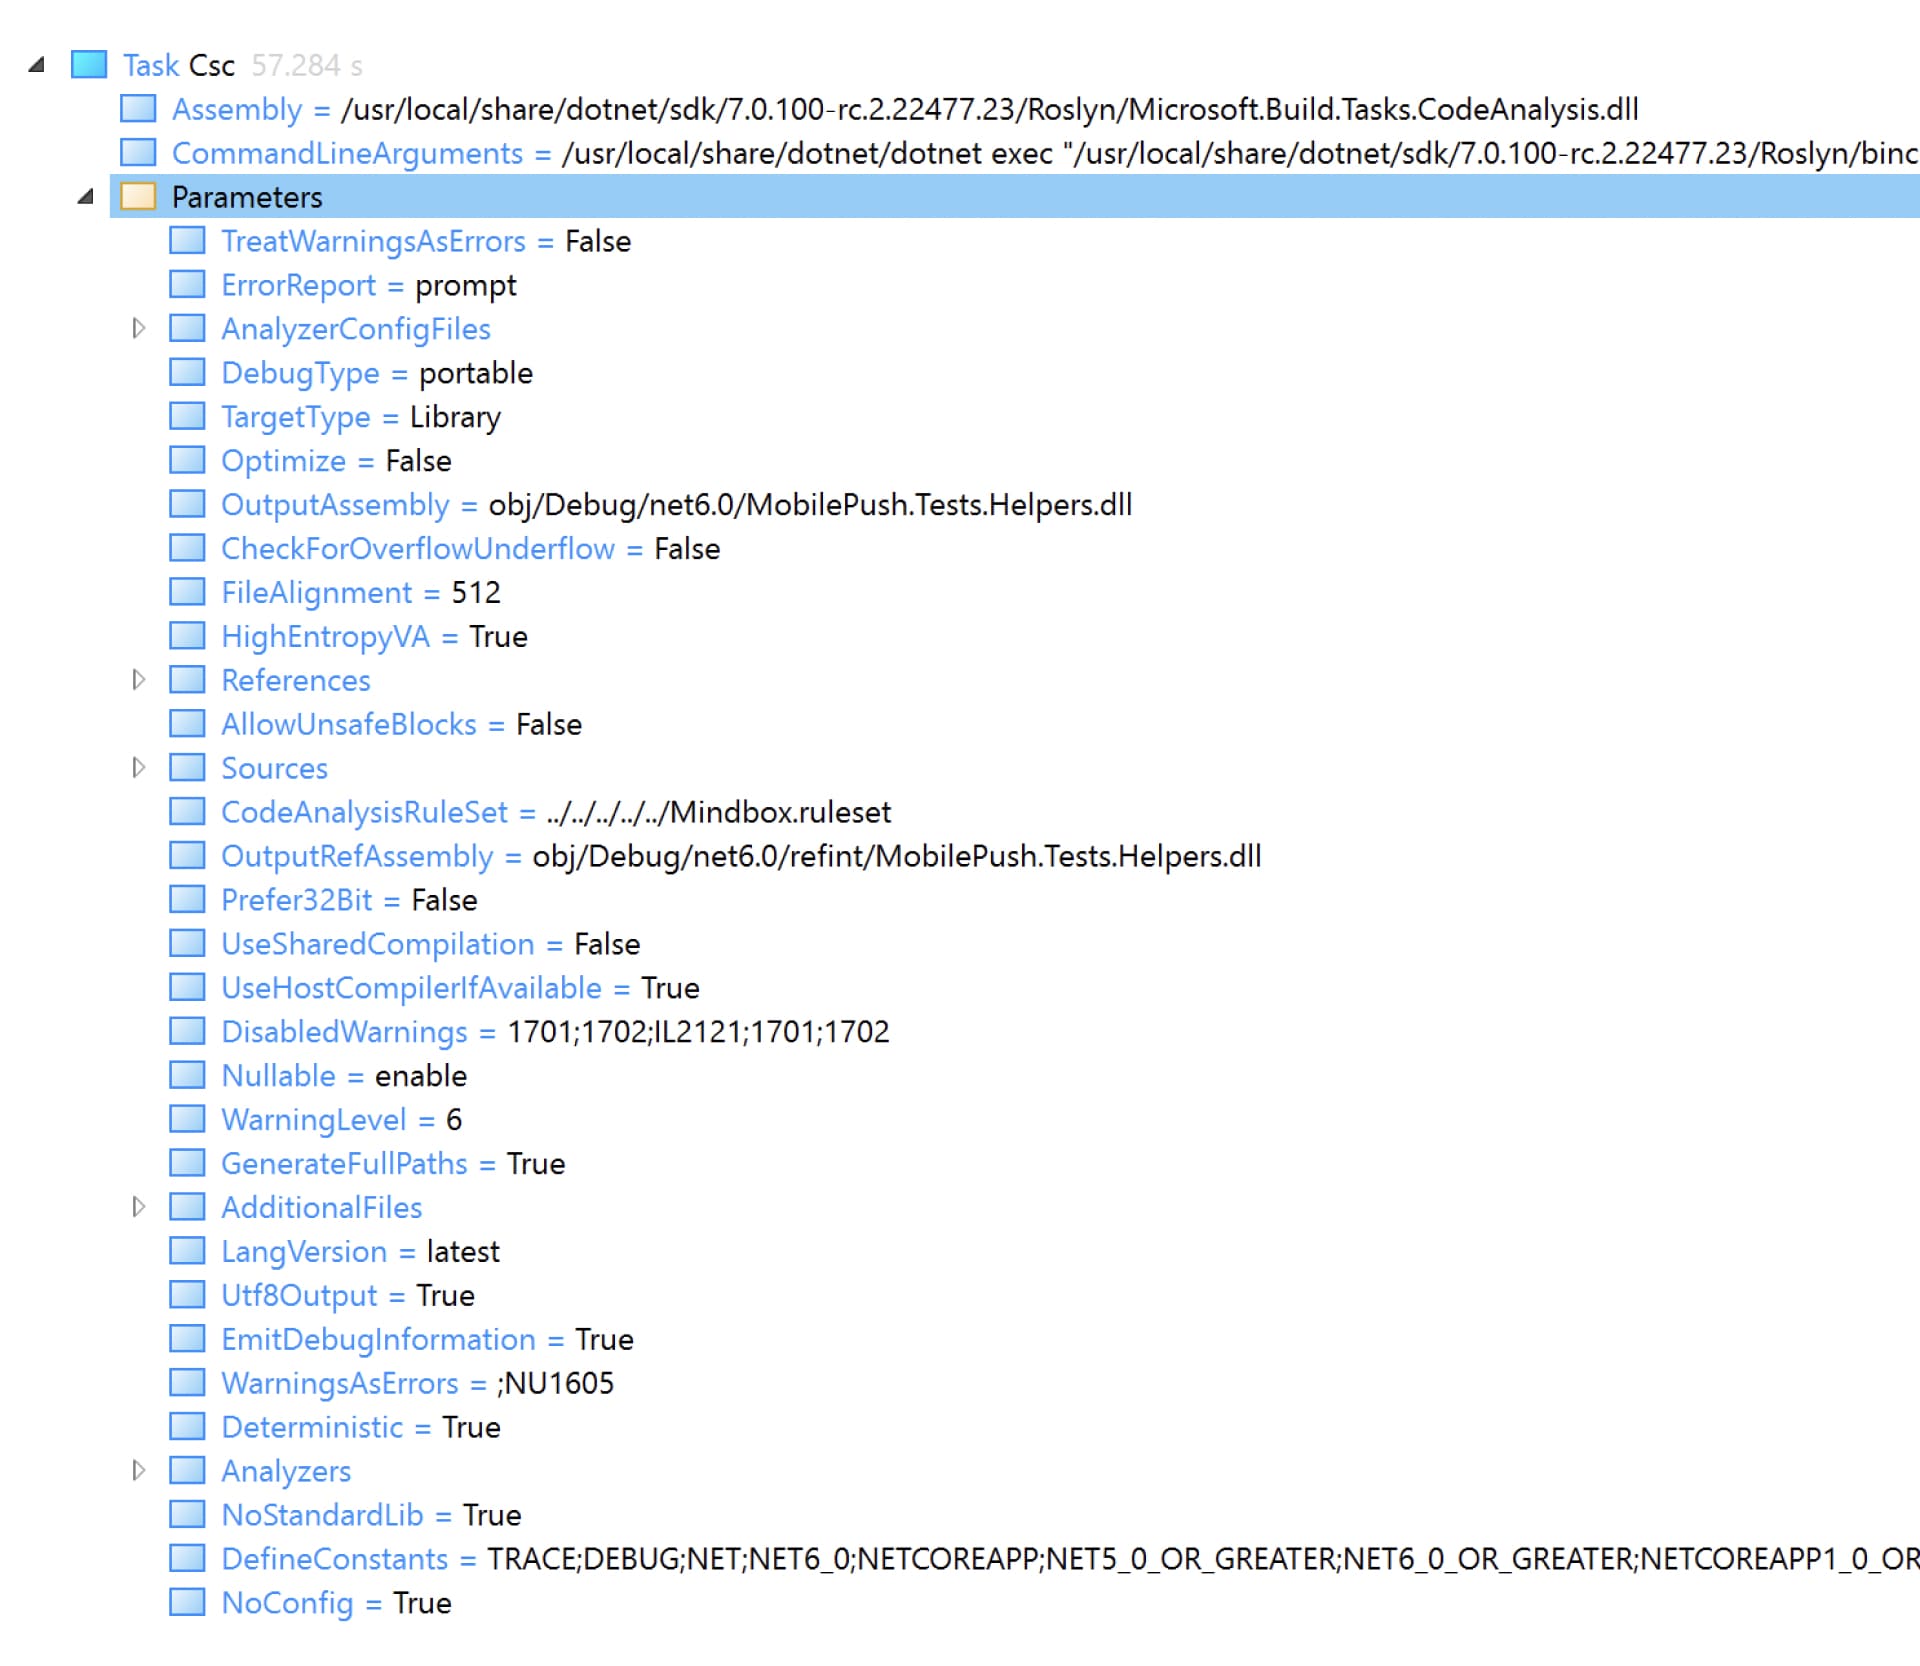
Taking a quick look at the parameters passed to the compiler, it is obvious that they are no different from the build parameters in another environment. But in this case, it is unclear why the compiler behaves differently in another OS. We need to monitor his behavior.
Trace results: the problem is in the system call
You can observe the behavior of the compiler by tracing already running build processes with the tool dotnet-trace. Team dotnet build launches a worker on each processor core, which means you need to collect a trace from each of the 10 processes. It will not be possible to run the build itself via dotnet-trace, since the tool will record a trace only for the main process, excluding all workers. To trace worker processes, you need to manually specify the ID of each of them in dotnet-trace. This can be automated using a script:
for pid in $(pgrep dotnet)
do
	dotnet trace collect -p $pid -o $pid.nettrace --duration 00:00:00:15
done
This way you can perform a background trace recording for 15 seconds – this is enough to track the methods and identify an error, if any.
The recorded traces need to be converted for analysis. Dotnet-trace has a command to convert files convertwhich we will use in the following script to convert all traces in the current folder:
for i in *.nettrace
do
	dotnet-trace convert --format speedscope $i
done
dotnet-trace supports several formats – we chose Speedscope. Speedscope – an online utility for visualizing traces in the form of flamegraphs. Each trace contains information about the threads of the process and which method was executed in each thread at what point in time. Looking through trace after trace and thread after thread, we find an interesting thread:
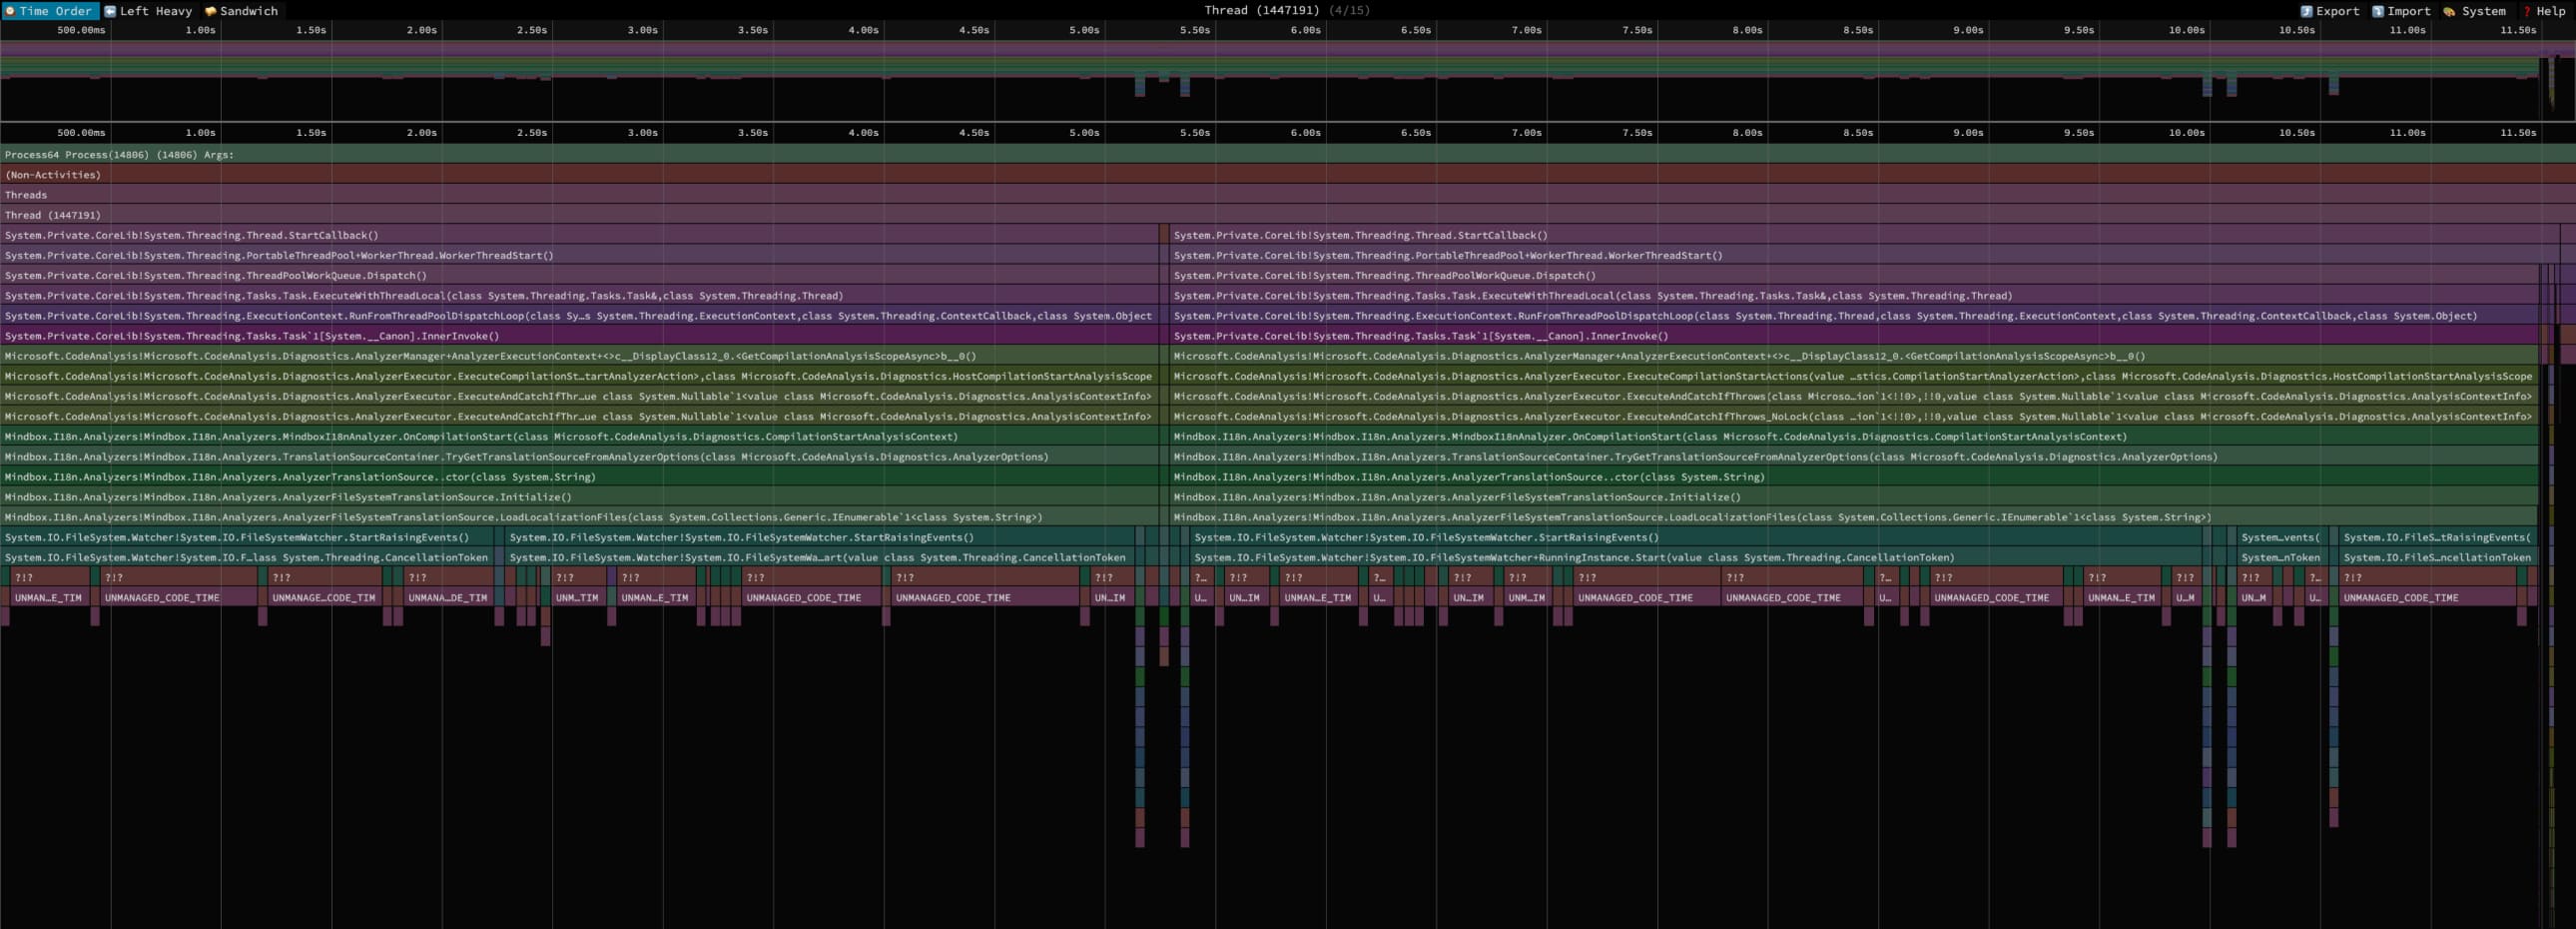
As you can see from the calls at the top of the stack, the thread runs Roslyn analyzers when compiled. Roslyn is a .NET compiler framework that provides SDKs and APIs to extend the functionality of the compiler. Roslyn allows you to write custom analyzers that indicate errors in the code to the developer or display warnings.
The screenshot of the thread shows an unusual pattern. The operating time of the self-written Mindbox analyzer is highlighted in green. Ideally, it should take a couple of seconds, but in fact it takes almost a minute. This is not visible because we interrupted the assembly at the 12th second – otherwise there would be too many unnecessary threads in the illustration. What’s even more interesting is that the assembly goes into unmanaged code for a long time – these periods of time are shown in burgundy. We have not yet found out the reason, but we believe that the assembly is delayed at this stage.
The analyzer that slows down code execution is Mindbox.I18n.Analyzer, specially written for checking localization keys. The code of our localization framework is publicly available.
The analyzer creates an instance FileSystemWatcher for each of the localization files and project files to track any changes to them. As soon as FileSystemWatcher detected a change, it signals this to the analyzer. It scans localization files, identifies new or deleted keys and, based on this, indicates errors in the code or displays warnings. This is convenient for the developer because it reduces the time feedback loop: It notices the error and corrects the code even before running automated builds (CI) and tests.
Below – code that is responsible for loading and tracking changes in localization files:
private void LoadLocalizationFiles(IEnumerable<string> localizationFiles)
{
	foreach (var localizationFile in localizationFiles)
	{
		var watcher = new FileSystemWatcher
		{
			Path = Path.GetDirectoryName(localizationFile),
			Filter = Path.GetFileName(localizationFile),
			IncludeSubdirectories = false,
			NotifyFilter = NotifyFilters.LastWrite | NotifyFilters.FileName
		};

		watcher.Changed += (s, ea) => HandleLocalizationFileChange(localizationFile);
		watcher.Renamed += (s, ea) => HandleLocalizationFileChange(localizationFile);

		if (_localizationFileSystemWatchers.TryAdd(localizationFile, watcher))
		{
			watcher.EnableRaisingEvents = true;
		}
		else
		{
			watcher.Dispose();
		}
	}
}
This code snippet contains the method LoadLocalizationFileswhich, according to Speedscope, slows down the Mindbox analyzer, and therefore the code assembly.

When exhibiting EnableRaisingEvents = true method runs StartRaisingEvents, which starts tracking changes. This, again, is visible on the Speedscope. Each OS has its own implementation of this method, which means it is performed differently on macOS and Windows.
Below – property fragment EnableRaisingEvents from the .NET standard library:
/// <devdoc>
///    Gets or sets a value indicating whether the component is enabled.
/// </devdoc>
public bool EnableRaisingEvents
{
    get
    {
        return _enabled;
    }
    set
    {
        // [опущено для краткости]

        if (value)
        {
            StartRaisingEventsIfNotDisposed(); // will set _enabled to true once successfully started
        }

        // ...
    }
}
The call stack shows that after StartRaisingEvents the last call in managed code is in RunningInstance.Start(). This is what it looks like source code for macOS:
internal unsafe void Start(CancellationToken cancellationToken)
{
    // ...
    try
    {
        // Get the path to watch and verify we created the CFStringRef
        path = Interop.CoreFoundation.CFStringCreateWithCString(_fullDirectory);

        // ...

        // Take the CFStringRef and put it into an array to pass to the EventStream
        arrPaths = Interop.CoreFoundation.CFArrayCreate(new CFStringRef[1] { path.DangerousGetHandle() }, (UIntPtr)1);

        // ...

        // Make sure the OS file buffer(s) are fully flushed so we don't get events from cached I/O
        Interop.Sys.Sync();

        // ...
    }

    // ...
}
Earlier, when we analyzed the load on the CPU through Activity Monitor, we noticed that one core was constantly busy with system code. That is, the load is caused by system calls to the OS kernel. Now we have tracked them. The first two calls CFStringCreateWithCString And CFArrayCreate, responsible for creating objects, do not look at all heavy. Therefore, let us pay attention to the challenge Interop.Sys.Sync(). This method causes another method from the native part of runtime .NET, whose body consists of a single call – sync().
sync() is a Unix system call that synchronizes all file changes stored in memory to disk, while completely blocking system I/O. It is usually used to prevent data from being lost when the device is suddenly turned off. In our situation, sync should prevent FileSystemWatcher from receiving events that occurred before changes began to be monitored. We were sure that the problem was in this call, but we decided to check – again using a trace.
If you have traced system calls in Linux, you probably know that the utility is used for this strace. However, it does not exist in Darwin, the OS based on the Unix specification on which macOS is based. Despite the fact that Linux and Darwin have a common ancestor – Unix, they developed in different ways. One OS originated from GNU and the other from BSD.
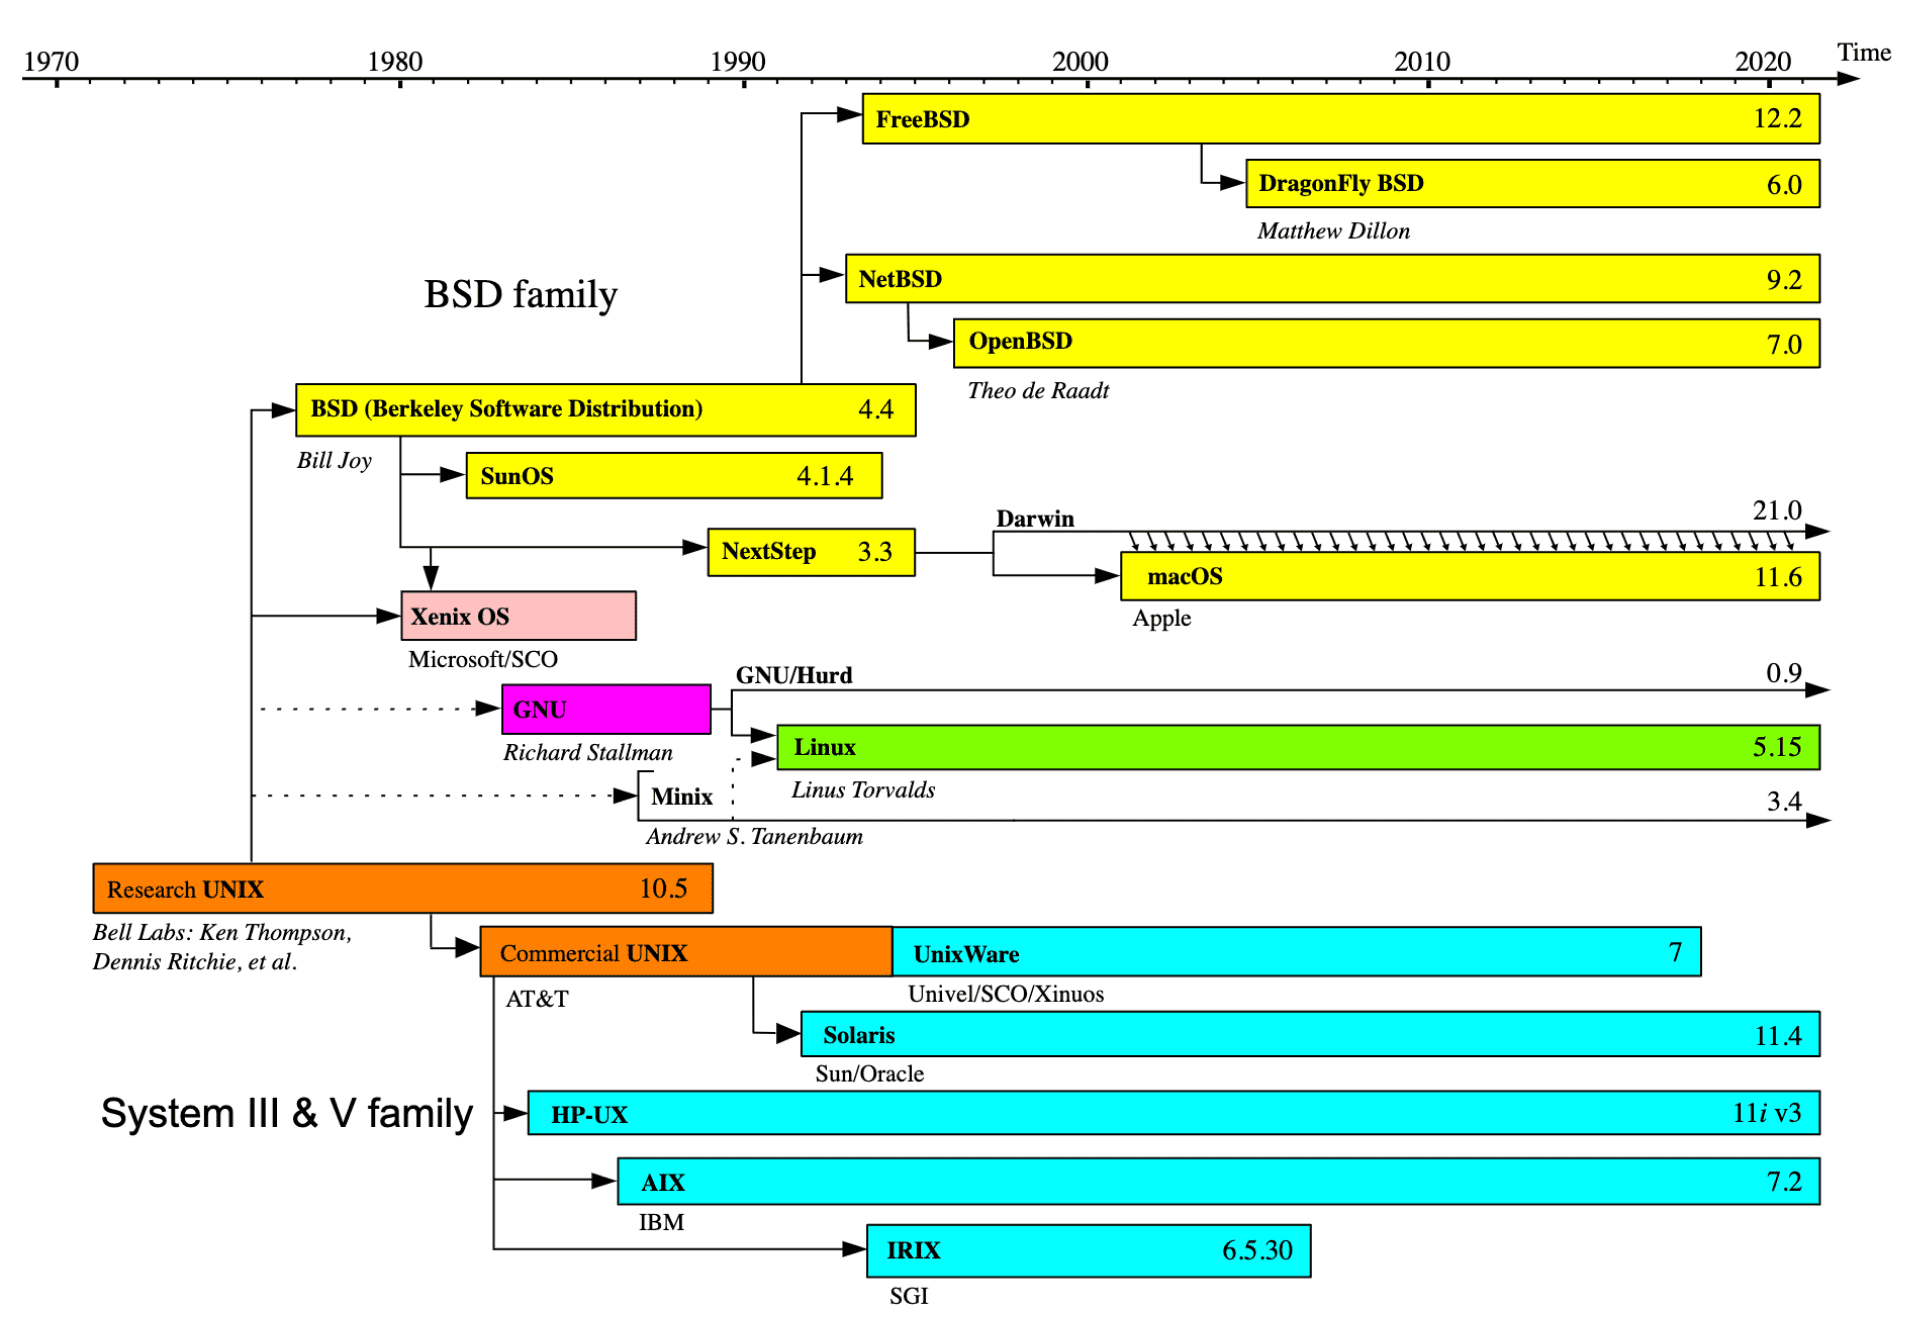
As a descendant of BSD, macOS inherited many utilities. Including dtruss: this is analog strace, which allows you to dynamically trace system calls. You can read more about the strace, ptrace, dtrace, dtruss utilities and their differences in an English article.
So, with the help dtruss we trace calls during assembly to test our hypothesis. You can record the system calls performed when building the solution with the command:
sudo dtruss -ef -t sync dotnet build --no-restore --disable-build-servers 2> log-dtruss.txt
# Флаг -f позволяет автоматически трассировать потомков процесса;
# -e выводит общее время в микросекундах, потраченное на вызов;
# -t фильтрует все системные вызовы, кроме sync().
Using dtruss on macOS may require disabling System Integrity Protection, you can read how to do this in Apple documentation.
After assembly we get the file log-dtruss.txt with full output of the utility dtrussand stdout himself dotnet build. Filter out extra lines from the file using grepformat it as it suits us, and present it in the form of a histogram:

Since all sync calls occur sequentially, we added up their duration and found out how much time they took. In total, the 5271 sync calls took approximately 7 minutes. This is the difference between code build times on macOS and Windows, where there is no problem with sync.
Solution: how to speed up code assembly
We found a solution without changing the source runtime code, and were able to speed up code assembly on a MacBook Pro from 10 minutes to three. To make the Mindbox analyzer work faster, the instances in its code were reduced FileSystemWatcher from several hundred to one. Now an instance is created not for each localization file, but for the entire folder where they are stored. The analyzer immediately sees all changes in localization files and filters out unnecessary events at the code level.
Below – corrected part of the analyzer code:
private void CreateTranslationFileChangeWatcher(string solutionDirectory)
{
   _translationFileChangeWatcher = new FileSystemWatcher
   {
       Path = solutionDirectory,
       Filter = $"*.{TranslationFileSuffix}",
       IncludeSubdirectories = true,
       NotifyFilter = NotifyFilters.LastWrite
   };

   _translationFileChangeWatcher.Changed += (_, ea) => HandleLocalizationFileChange(ea.FullPath);
   _translationFileChangeWatcher.EnableRaisingEvents = true;
}
We checked – this approach really speeds up the assembly up to 3 minutes:
Build succeeded.
    0 Warning(s)
    0 Error(s)
Time Elapsed 00:03:00.67
To globally solve the problem of slow builds due to the sync call, we opened an issue in the .NET runtime repository. However, Microsoft has not yet responded. In the meantime, we looked at the method code for other platforms in the same repository. It turned out to be a challenge sync() is not used in them at all. So perhaps an easy way to speed up the build is to simply not make the corresponding call. True, in theory this could cause problems due to the cache, but whether they will exist in practice is unknown.
Tips and useful links to help find the cause of a slow build
If you're investigating slow code builds, you may find the key findings from our research useful:
You can look for tasks that slow down the build in the MSBuild logs. The best option is binlog (aka structured log) – a log written in binary format and structured by types and order of events. In MSBuild Structured Log Viewer, you can even check the parameters passed to the compiler to see if any of them are slowing down the build.
If you don’t find energy-intensive tasks in the logs, trace the assembly and look for methods that take a suspiciously long time to execute. The most convenient way to trace compiler processes is with the dotnet-trace tool. Then we recommend visualizing the traces in Speedscope: the flamegraphs will clearly show which methods take the longest to execute. In our case, this turned out to be the method
StartRaisingEventswhich is implemented differently for each OS and runs at different speeds on macOS and Windows.In the code of suspicious methods, look for system calls that are difficult to process if you observe a high load of OS kernel code. These calls can be traced during the build process using the utility
dtrusson macOS orstraceon Linux. If you present the log as a histogram, you will see how many calls were made during the build and how long they took. In our case, the callsync()from a self-written Mindbox analyzer took ~7 minutes to assemble.
Services and utilities that may be useful:
MSBuild Structured Log Viewer — for analyzing logs in binlog format. We recommend the WPF version for Windows: only it has a timeline where you can track at what point and at what operation the build slows down.
Dotnet-trace — to trace already running build processes.
Speedscope – for visualizing traces in the form of flamegraphs. Helps you find methods that take too long to execute.


