How to configure Kafka Connect Source connectors to optimize throughput

Kafka Connect is an open source data integration tool that simplifies the process of streaming data between Apache Kafka® and other systems. Kafka Connect has two types of connectors: Source connectors and Sink connectors. Source connectors allow you to read data from various sources and write them to Kafka topics. Sink connectors send data from topics to another endpoint. This article discusses how to configure Source connectors to provide maximum throughput to your computing resources. This article covers the following topics:
General overview of what can and cannot be configured
Setting up connectors
What Producer configuration parameters can be changed
What JMX metrics should you monitor?
Example of step-by-step setup
What can you customize? general review
When it comes to configuring Source connectors, you need to understand how connectors work. First, let's look at an example JDBC Source connector, which is divided into three sections:

We have an endpoint/source that we retrieve records from (a database in our example) and then a Kafka Connect that contains the following:
Connector – returns a number of records received from the source.
Converter – Converts records to the selected data type, for example Avro.
Transformations (transformations) – applies Simple Message Transformations (SMT) that were defined in the connector configurations.
Producer – sends records to the Kafka topic.
Finally comes Kafka, which accepts the producer's records.
Now that we've covered the basics of Kafka Connect, let's discuss what can't be configured:
Converter – converting a record to Avro/Protobuf/JSON always takes a certain amount of time.
Transformations – although the transformation is very fast, it always takes some time to apply it. If you want to avoid this delay, you can choose not to use transformations.
What can be configured includes four components:
Connector – we can use the connector configurations for further customization.
Producer – certain configuration parameters, such as
batch.sizecan be used to further increase throughput.Data source – is not considered because it depends on which source you choose.
Kafka itself – is not covered in this article, however, you can read the following managementto find out more.
Setting up connectors
Configuring a connector depends on what configuration parameters it has. If the connector does not provide any configuration to receive more data from the source, then the connector cannot be configured to achieve more throughput.
For example, the Confluent JDBC Source connector has the following configurations provided by the connector:
batch.max.rows– the maximum number of rows that can be included in one package when requesting new data.poll.interval.ms– interval in milliseconds for requesting new data in each table.
We can force the connector to return more records to the producer by increasing batch.max.rows. If the connector did not provide this configuration and had a static value of 5 entries as batch.max.rows, then the maximum number of records that the connector can receive for each request would be only 5 records. A connector can only be configured according to its public configuration options.
What Producer configuration parameters can be changed
When it comes to setting up Producer, there are a few common configurations to consider:
batch.size– specifies the maximum packet size in bytes (default 16384).linger.ms– specifies the maximum duration of packet filling in milliseconds (default 0).buffer.memory– the total number of bytes of memory that the producer can use to buffer recordings waiting to be sent to the server (default 33554432).compression.type– indicates the final compression type for this topic (default “producer”).
Configuration batch.size must match the number of records returned by the connector. A simple example: if the connector returns 500 records, the batch size should be set using the following equation:
batch.size = number_of_records * record_size_average_in_bytesIf, for example, the connector returns 500 records every time it retrieves data from the database, and each record is 1.76KiB in size, then the equation would be:
(500*1.76) * 1024 = 901,120(*Multiplied by 1024 to convert KiB to bytes)
Configuration linger.ms depends on how many records the connector returns to the producer. If there are 10 records the producer may only need to wait 5ms, however when returning 100,000 records the wait time is linger.ms should be increased. Reason for the increase linger.ms is that the package will take longer to fill. If for configuration linger.ms If set too low, this will cause packets to not have enough time to complete in many requests. The opposite situation may arise for linger.msif the value is too high, then the producer waits unnecessarily and packets are sent more slowly.
Configuration buffer.memory represents the total number of bytes of memory that the producer can use to buffer recordings waiting to be sent to the server. This setting should roughly correspond to the total amount of memory that the producer will use, but it is not hard-wired since not all of the memory used by the producer is used for buffering. If, for example, the Kafka producer is unable to send messages (packets) to the Kafka broker (let's say the broker is down). The producer will begin accumulating message packets in buffer memory (default 32 MB). When the buffer is full it will wait max.block.ms (default 60,000 ms) so that the buffer can be flushed. If the buffer is not cleared, the producer will throw an exception. If the value buffer.memory set too low, the buffer will instantly fill and throw an exception. Although the opposite can happen when the value is too large buffer.memory may throw an OOM exception if memory in the OS is exhausted.
And finally, the last configuration is compression.type, which can be enabled to compress messages before they are sent. Each type of compression has many pros and cons, so you'll have to do your own research to determine which type of compression is best for your use case. Next KIP contains additional information about the performance of each compression type. Although compression is great for reducing the size of messages, its use increases the delivery time of messages because the messages must be compressed.
What JMX metrics should you monitor?
JMX metrics should be divided into three sections: connector metrics, broker metrics, and producer metrics (from the Kafka Connect framework).
Level | Metrics | Description | Why is this useful? |
|---|---|---|---|
Connector |
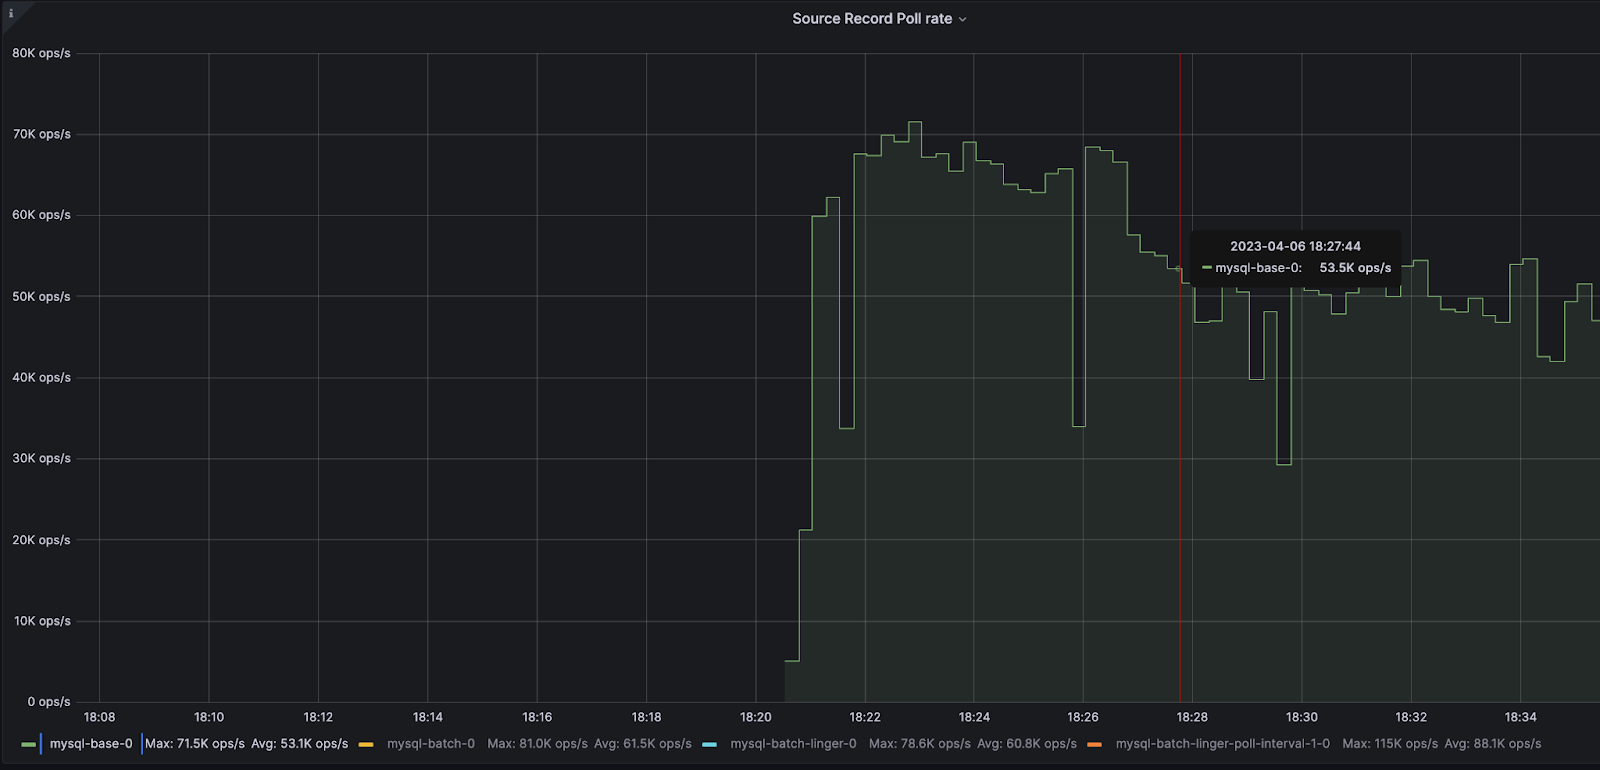
| Before applying transformations, this is the average number of records per second produced or requested from the source by a task belonging to the specified Source connector in the worker process. | Tells us the average number of writes per second produced before transformations. |
Connector |
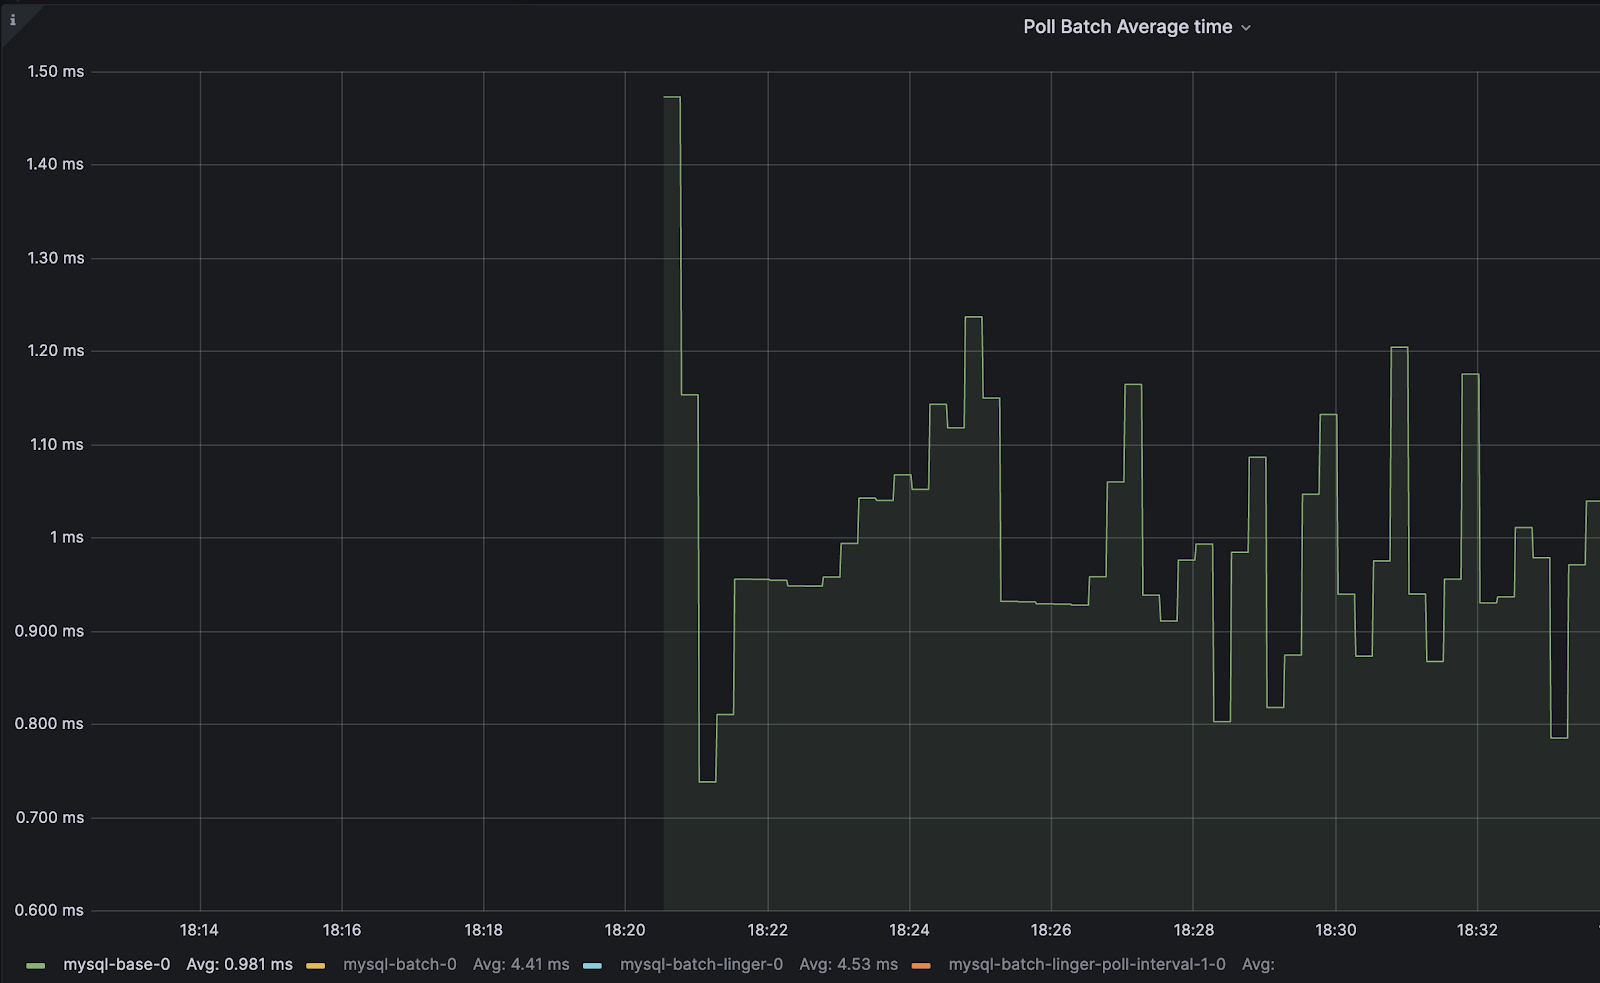
| The average time, in milliseconds, that this task spent requesting a batch of source records. | A metric that can tell you how long it will take for a record to be returned by the source. |
Connector |
| After applying transformations, this is the average number of records per second resulting from transformations and written to Kafka for a task belonging to a named Source connector in a worker (excluding records filtered by transformations). | Useful when applying transformations to determine their impact on performance. |
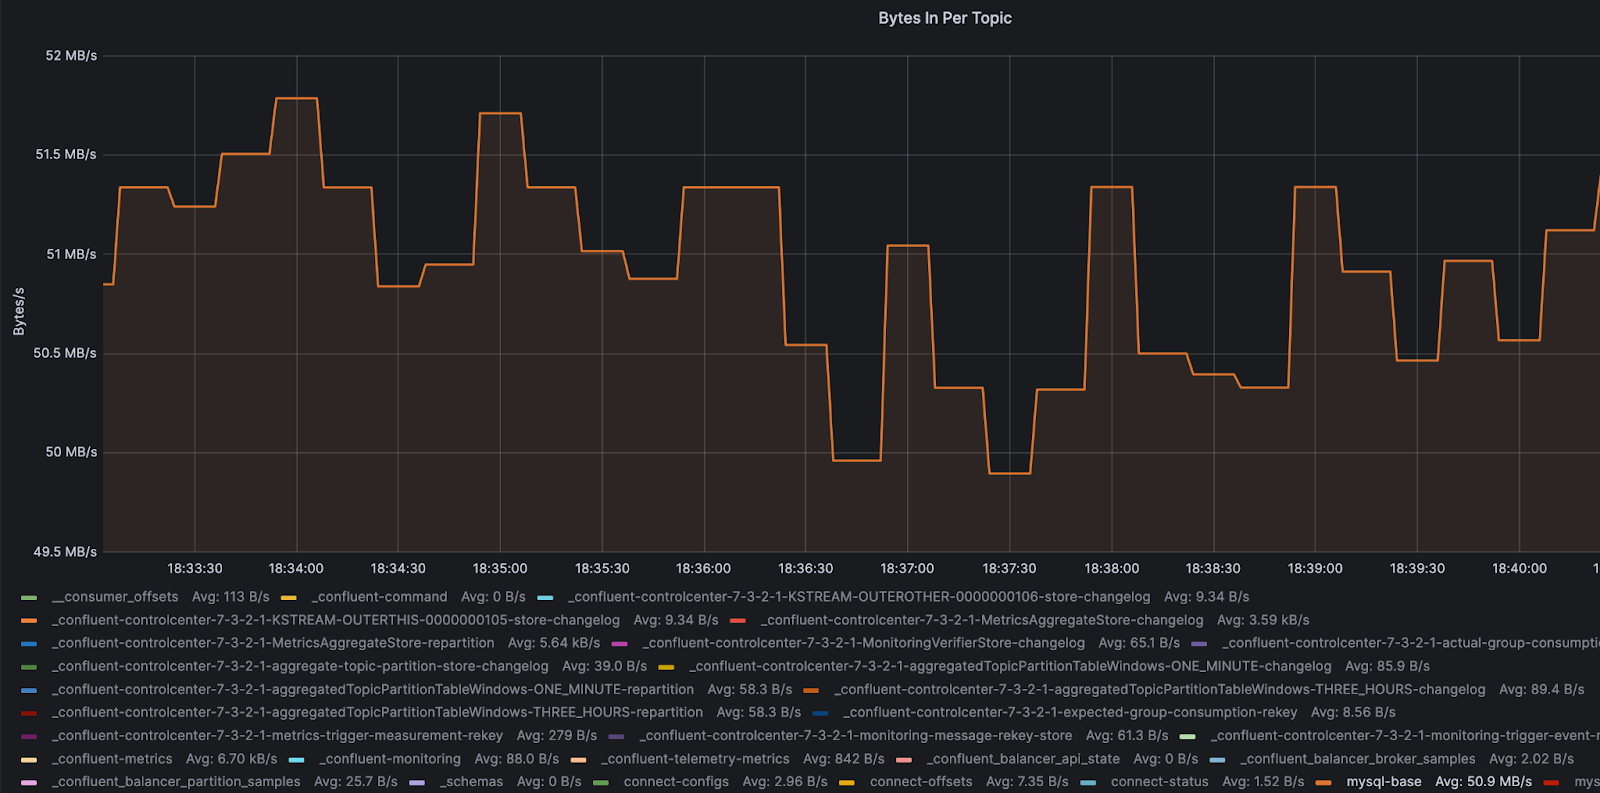
Broker | | The rate at which bytes are received from clients. | It's useful to see the throughput for each topic to ensure that throughput has increased. |
Producer |
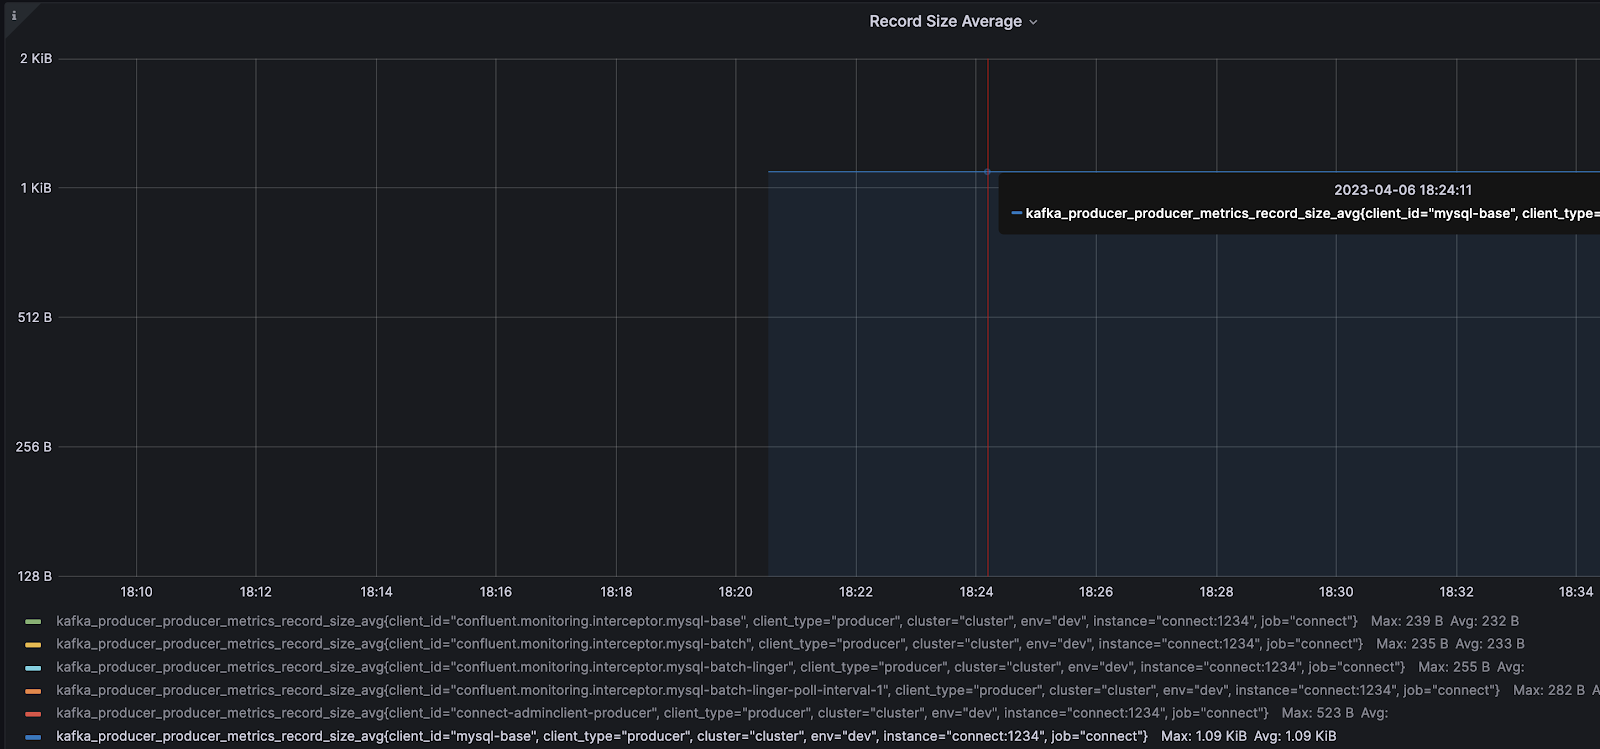
| Average record size. | Metric used for calculation |
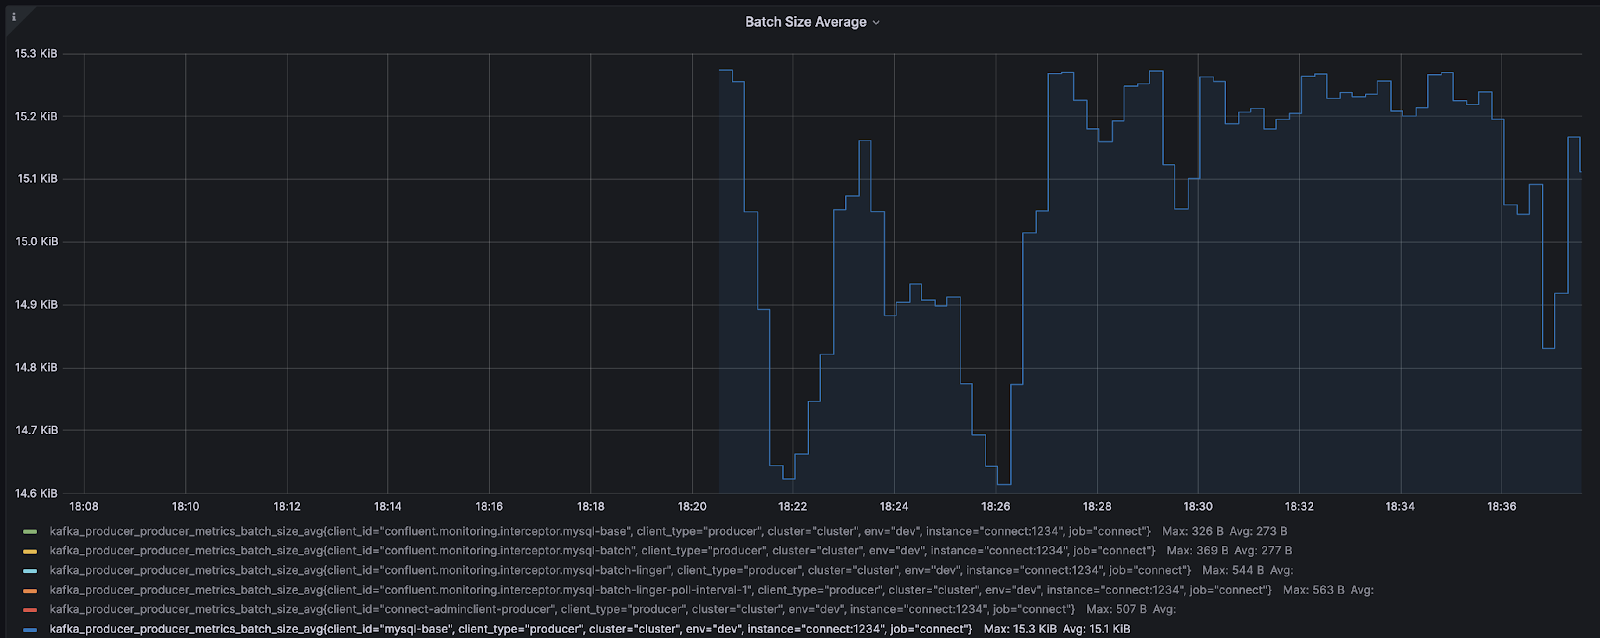
Producer | | The average number of bytes sent to the partition per request. | Check that |
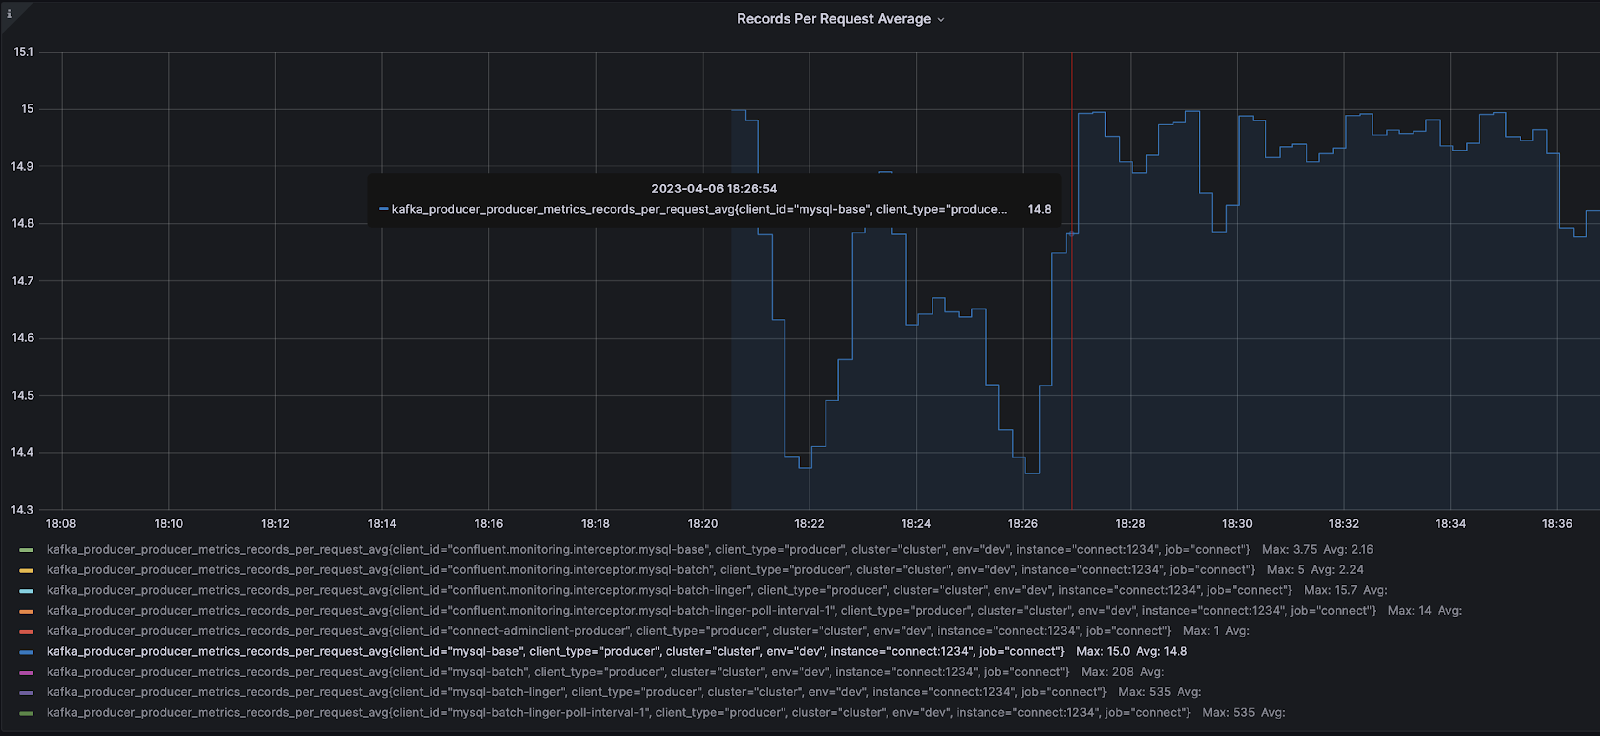
Producer | | Average number of records per request. | Check how many recordings are sent in each producer package. |
Producer | | The average number of records sent per second to a topic. | Used as an indicator that the connector needs further configuration. |
Example of step-by-step setup
This example shows how to increase the throughput of a Confluent JDBC Source connector connecting to a MySQL database. This methodology can be applied to any Source connector. The following steps must be taken:
Determine which connector/producer configurations can be changed and configure Grafana to display JMX metrics.
Determine your initial throughput.
Determine which configurations should be changed (producer vs. connector).
Change the producer configuration.
Change the connector configuration to improve throughput.
Step 1: Determine which connector/producer configurations can be changed and configure Grafana to display JMX metrics.
JDBC Source connector configuration:
batch.max.rows– the maximum number of rows that can be included in one batch connector request. This setting can be used to limit the amount of data buffered by the connector (default is 100).poll.interval.ms– interval in milliseconds to wait before requesting new data for each table (default 5000).
Producer Configurations:
batch.size– specifies the maximum packet size in bytes (default 16384).linger.ms– specifies the maximum duration of packet filling in milliseconds (default 0).buffer.memory– the total number of bytes of memory that the producer can use to buffer recordings waiting to be sent to the server (default 33554432).compression.type– indicates the final compression type for this topic (not specified by default).
This example uses kafka-docker-playground the environment in which the script mysql.sh deploys a MySQL instance, inserts 10 million records into the database and launches the connector with Grafana, enabling export ENABLE_JMX_GRAFANA=true.
Step 2 – Determine Initial Bandwidth
First, you need to determine the initial throughput when using standard connector configurations. This way you can see before and after JMX metrics to determine how to increase throughput. Keep in mind that when setting up, you need to configure for one task. Once the base throughput is determined for one task, you can always increase task.max later (if the connector allows).
Below is my connector configuration:
curl -X PUT \
     -H "Content-Type: application/json" \
     --data '{
               "connector.class":"io.confluent.connect.jdbc.JdbcSourceConnector",
               "tasks.max":"1",
               "connection.url":"jdbc:mysql://mysql:3306/mydb?user=user&password=password&useSSL=false",
               "mode":"bulk",
               "producer.override.client.id": "mysql-base",
               "query":"SELECT * FROM mydb.team WHERE mydb.team.id < 7900000 ",
               "topic.prefix":"mysql-base"
          }' \
     http://localhost:8083/connectors/mysql-base/config | jq .
Basic Grafana JMX metrics:
Broker
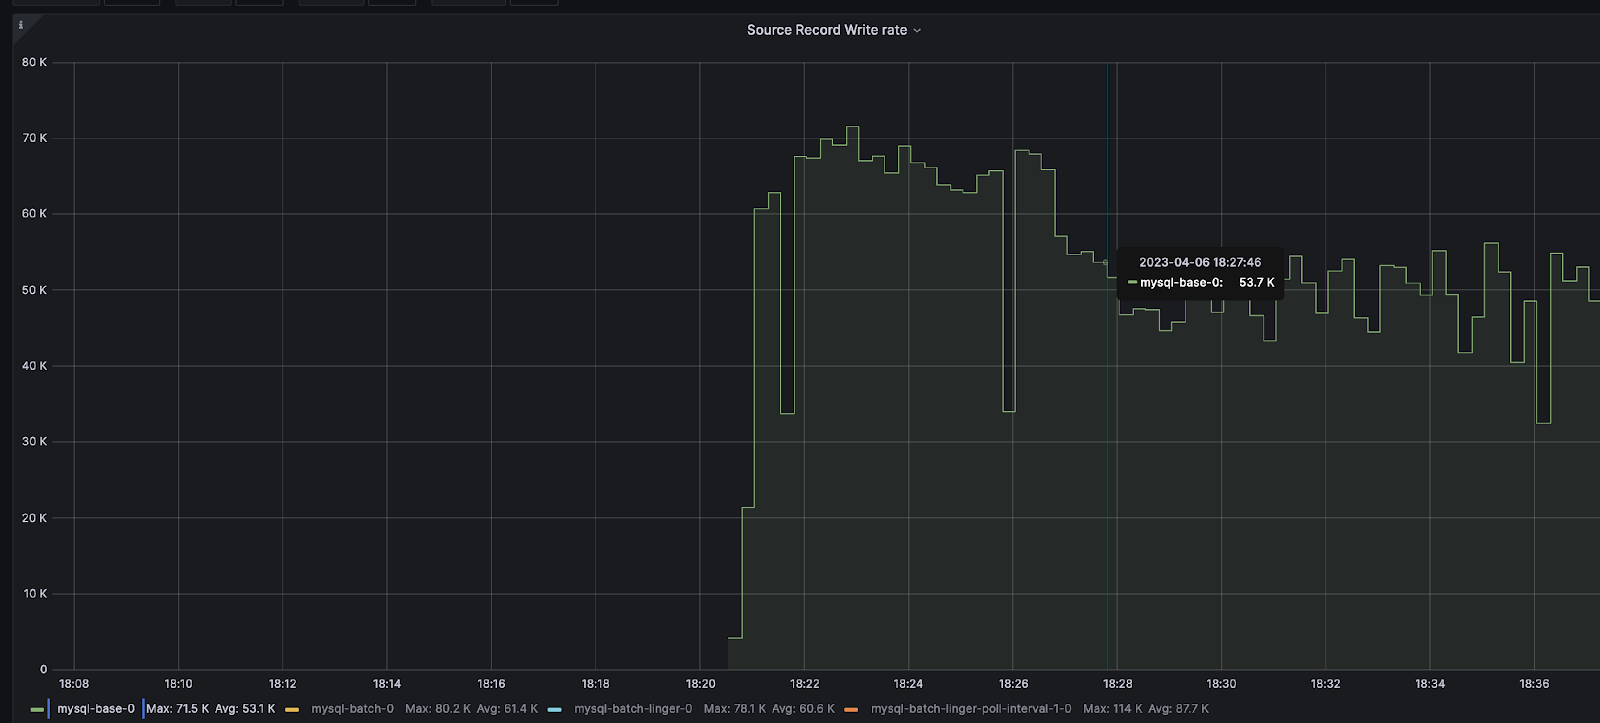
Connector
Producer
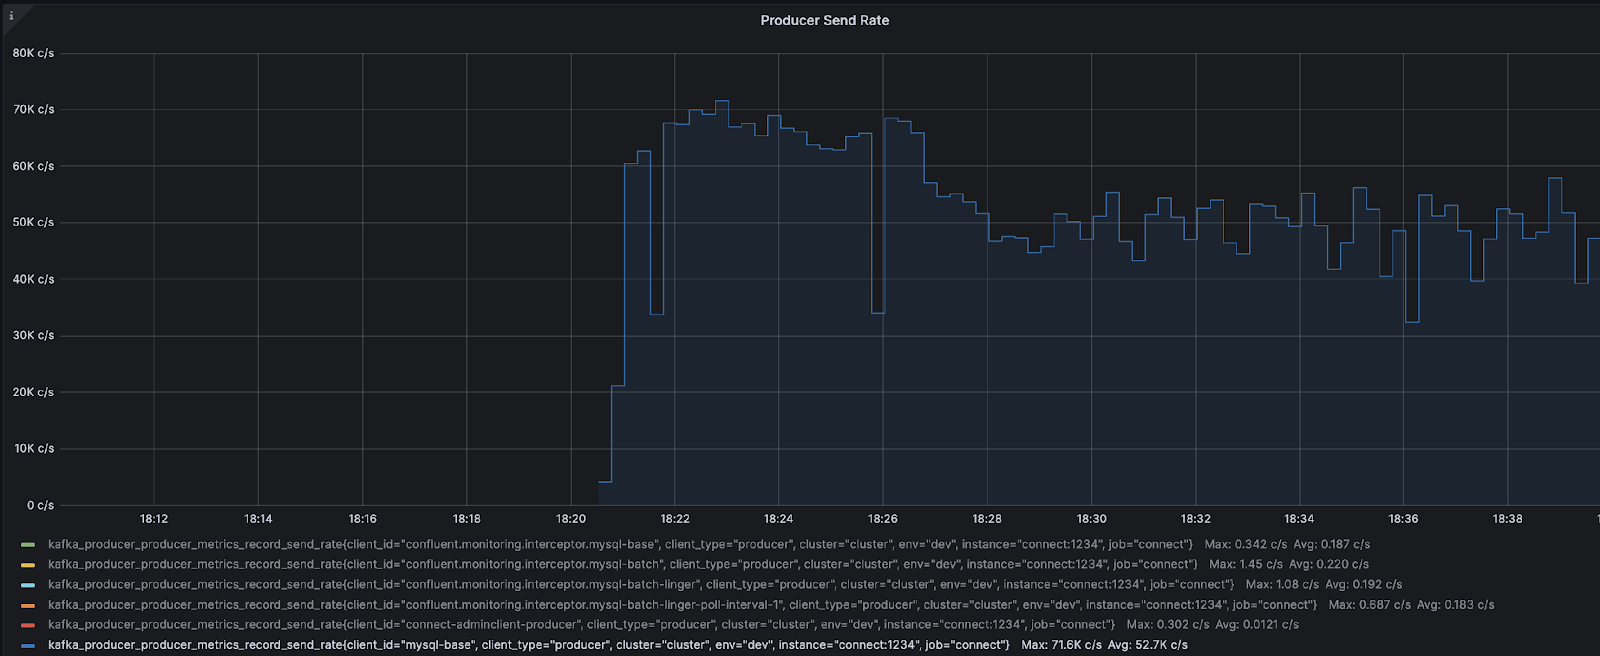
Step 3: Determine which configurations to change (producer vs. connector).
To determine which configurations to change, let's summarize our metrics in a simple table:
Metrics | Meaning |
|---|---|
| 50.9 MB/s |
| 53.1K ops/s |
| 0.981ms |
| 53.1K ops/s |
| 1.09 KiB |
| 15.1 KiB |
| 14.8 records on average per request |
| 71.6K records on average per request |
Based on the above metrics, you should first pay attention to the producer level metrics. The main reason we decided to configure the producer first is due to JMX metrics batch-size-avg And records-per-request-avg. These two values should be cause for concern since the average packet size is 15.1 KiB and the average number of records per request is - 14.8. Meaning batch-size-avg becomes limiting because by default batch.size is 16384 and adding another entry is not possible since the average entry size is 1.09 KiB. If you look at the metric records-per-request-avgon average 14.8 records are sent per request, however the connector returns 100 records per request due to configuration batch.max.rows. This indicates that the connector is returning 100 more records, however batch.size limited to ~15 records only.
You can check the number of records returned by the connector to the producer by enabling TRACElogging level for AbstractWorkerSourceTask:.
curl -s -X PUT -H "Content-Type:application/json" \
    http://localhost:8083/admin/loggers/org.apache.kafka.connect.runtime.AbstractWorkerSourceTask \
    -d '{"level": "TRACE"}' \
    | jq '.'
Then the logs are searched for the following lines:
About to send <integer> records to KafkaBased on the producer metrics, the first component to configure is the producer.
With that said, one might ask, “How can you tell if a connector is not a bottleneck?” When it comes to determining whether a connector is a bottleneck, one or both of the following scenarios typically occur:
Bandwidth does not increase even if producer configurations have been changed.
When changing producer configurations
send-rateremains unchanged or does not increase.
When one or both of the above scenarios occurs, it is a sure sign that the connector needs modification. JMX metric send-rate tells us what the producer is doing at the moment. If send-rate does not increase or remains relatively unchanged, this indicates that the producer is waiting for records from the connector. This means that the connector is a bottleneck because the producer is in “standby” mode.
Step 4: Changing Producer Configurations
To configure the producer, you need to increase batch.size. You can use the following equation to calculate the packet size:
batch.size = number_of_records * record_size_average_in_bytesSince our current batch.size filled with 100 records coming from the connector, in this example I will increase batch.size And batch.max.rows to further increase throughput. The reason for setting is also batch.max.rows is rather a personal preference to avoid recalculation batch.size a second time. I know I want to get more data from the source, so I prefer to configure both at the same time. This modification will also remove the connector's role as a bottleneck since we will now be requesting more messages. For parameter batch.max.rows will be set to 500 records and we can use the above equation to determine batch.size. To determine the average packet size, note that batch-size-avg indicated in KiB. KiB needs to be converted to bytes by multiplying by 1024:.
batch.max.rows * record-size-avg * 1024(из-за KiB)
500 * 1.09 * 1024 = 558080
Our connector configuration will now be updated and you should notice that the parameters batch.max.rows And batch.size increased. Once again, the reason is based on the JMX metric batch.sizesince we know our package is filled with 100 entries:.
curl -X PUT \
     -H "Content-Type: application/json" \
     --data '{
               "connector.class":"io.confluent.connect.jdbc.JdbcSourceConnector",
               "tasks.max":"1",
               "connection.url":"jdbc:mysql://mysql:3306/mydb?user=user&password=password&useSSL=false",
               "mode":"bulk",
               "batch.max.rows": 500,
               "producer.override.client.id": "mysql-batch",
               "producer.override.batch.size": 558080,
               "query":"SELECT * FROM mydb.team WHERE mydb.team.id < 7900000 ",
               "topic.prefix":"mysql-batch"
          }' \
     http://localhost:8083/connectors/mysql-batch/config | jq .
After running the connector, you will get the following JMX metrics summary:
Metrics | Meaning |
|---|---|
| 61.0 MB/s |
| 61.5K ops/s |
| 4.41ms |
| 61.4K ops/s |
| 1.09 KiB |
| 95.3 KiB |
| 95.9 records on average per request |
| 60.8K records on average per request |
Based on the above JMX metrics, you can see that records-per-request-avgdoes not reach the number of records set in batch.max.rows. records-per-request-avg - this is an indicator that the producer needs to wait a little longer to fill the package. When a scenario like this occurs, linger.ms - this is a parameter that needs to be increased. linger.ms may vary depending on your environment, however for this example I will choose a simple small number 10. Below is the new connector configuration:
curl -X PUT \
     -H "Content-Type: application/json" \
     --data '{
               "connector.class":"io.confluent.connect.jdbc.JdbcSourceConnector",
               "tasks.max":"1",
               "connection.url":"jdbc:mysql://mysql:3306/mydb?user=user&password=password&useSSL=false",
               "mode":"bulk",
               "batch.max.rows": 500,
               "producer.override.client.id": "mysql-batch-linger",
               "producer.override.batch.size": 558080,
               "producer.override.linger.ms": 10,
               "query":"SELECT * FROM mydb.team WHERE mydb.team.id < 7900000 ",
               "topic.prefix":"mysql-batch-linger"
          }' \
     http://localhost:8083/connectors/mysql-batch-linger/config | jq .
Updated JMX metrics summary:
Metrics | Meaning |
|---|---|
| 61.0 MB/s |
| 60.8K ops/s |
| 4.53ms |
| 60.6K ops/s |
| 1.09 KiB |
| 543 KiB |
| 534 records on average per request |
| 58.0K records on average per request |
At the moment, the average number of records per request is satisfied, but the indicators BytesInPerSec And record-send-ratehave not increased. These two metrics indicate that the problem is that the connector is not sending recordings to the producer quickly enough. The producer can send more entries, but he doesn't receive them fast enough.
Step 5: Change the connector configuration to improve throughput
In Step 4, we configured the producer and determined that the connector is the current bottleneck since throughput did not increase and record-send-rate remained relatively stable. There are only two configurations that can help increase throughput on the connector side:
batch.max.rows– the maximum number of rows that can be included in one package when requesting new data. This parameter can be used to limit the amount of data buffered by the connector.poll.interval.ms– interval in milliseconds for requesting new data in each table.
Because the value batch.max.rows has already been changed and the throughput has not increased, it remains poll.interval.ms. This setting determines how often data is retrieved from a new table, the current value is 500. This means that the connector only retrieves data from the table every 5 seconds.
Below are the new connector configurations where for poll.interval.ms set to 1:
curl -X PUT \
     -H "Content-Type: application/json" \
     --data '{
               "connector.class":"io.confluent.connect.jdbc.JdbcSourceConnector",
               "tasks.max":"1",
               "connection.url":"jdbc:mysql://mysql:3306/mydb?user=user&password=password&useSSL=false",
               "mode":"bulk",
               "poll.interval.ms": 1,
               "batch.max.rows": 500,
               "producer.override.client.id": "mysql-batch-linger-poll-interval-1",
               "producer.override.batch.size": 558080,
               "producer.override.linger.ms": 10,
               "query":"SELECT * FROM mydb.team WHERE mydb.team.id < 7900000 ",
               "topic.prefix":"mysql-batch-linger-poll-interval-1"
          }' \
     http://localhost:8083/connectors/mysql-batch-linger-poll-interval-1/config | jq .
Updated JMX metrics summary:
Metrics | Meaning |
|---|---|
| 88.2 MB/s |
| 88.1K ops/s |
| 19.3ms |
| 87.7K ops/s |
| 1.09 KiB |
| 543 KiB |
| 534 records on average per request |
| 80.3K records on average per request |
Currently, our throughput has increased by 57% from the original 50.9 MB/s to 88.2 MB/s. The main bottleneck in this scenario was that the connector was too slow to retrieve records from the source.
Conclusion
In this example, the speed increased from 50.9 MB/s to 88.2 MB/s, which is a 57% increase in throughput. However, this testing scenario represents an “ideal world” scenario, while in reality production environments are not so clear-cut:
It's not common to insert 10 million rows of exactly 1.09 kilobytes into database tables.
Testing was carried out on one EC2 instance with all Docker containers running locally with virtually no delays.
The demo database was not configured to use its full potential.
While most scenarios are not as isolated as presented in this tutorial, the troubleshooting methodology remains the same:
Determine whether the connector or producer is the bottleneck.
Set up a producer to ensure the packages are filled.
Configure the connector to send messages to the producer faster.


