EremexControls.NET library for Avalonia UI – Update March-April 2024
In the previous article we talked about our first version of the UI controls library for creating multi-platform applications for Avalonia UI. Enough time has passed since then, during which we continued to work on a new version of Delta Design and expanding the line of controls for Avalonia UI. We'll talk about this below. We will also invite you to the ExpoElectronica 2024 exhibition, where the Delta Design and EMXControls teams will be ready to talk in detail about the new version of Delta Design and the EremexControls.NET line of controls.
Chart Control
When porting the Delta Design SimOne module to Avalonia UI, a question arose with the control for drawing charts, the so-called Chart Control.
The minimum requirements for such control were:
Display of 2D graphs: line and column.
Display multiple data series on one graph or in an adjacent panel.
Multi-axis support.
Scaling and scrolling of series (all at once and separately).
Correct display of data if there are gaps.
Tooltips showing values closest to the cursor in graphs.
Support for logarithmic axes.
Cartesian and polar coordinate systems.
Smith chart.
In addition, there was a requirement for the performance of ChartControl, since when modeling in SimOne, graphs can be built on a huge number of points (up to a million in each series).
Having analyzed existing opensource and other packages (LiveCharts2, Microcharts, OxyPlot, ScottPlot, TeeChart), we did not find a control that satisfied our conditions. So we had to create our own solution for displaying graphs. The first in a series of our controls for plotting charts – CartesianChart – designed to build graphs in the Cartesian coordinate system. It is already included in the EremexControls.NET library and is actively being developed.

At the moment, the control functionality includes:
Supports an unlimited number of data series and axes.
Axis titles and labels.
Setting the visible ranges of the displayed data.
Grid and the possibility of alternating its coloring.
Logarithmic axes.
Scaling and scrolling data using the mouse (all at once or independently along each axis).
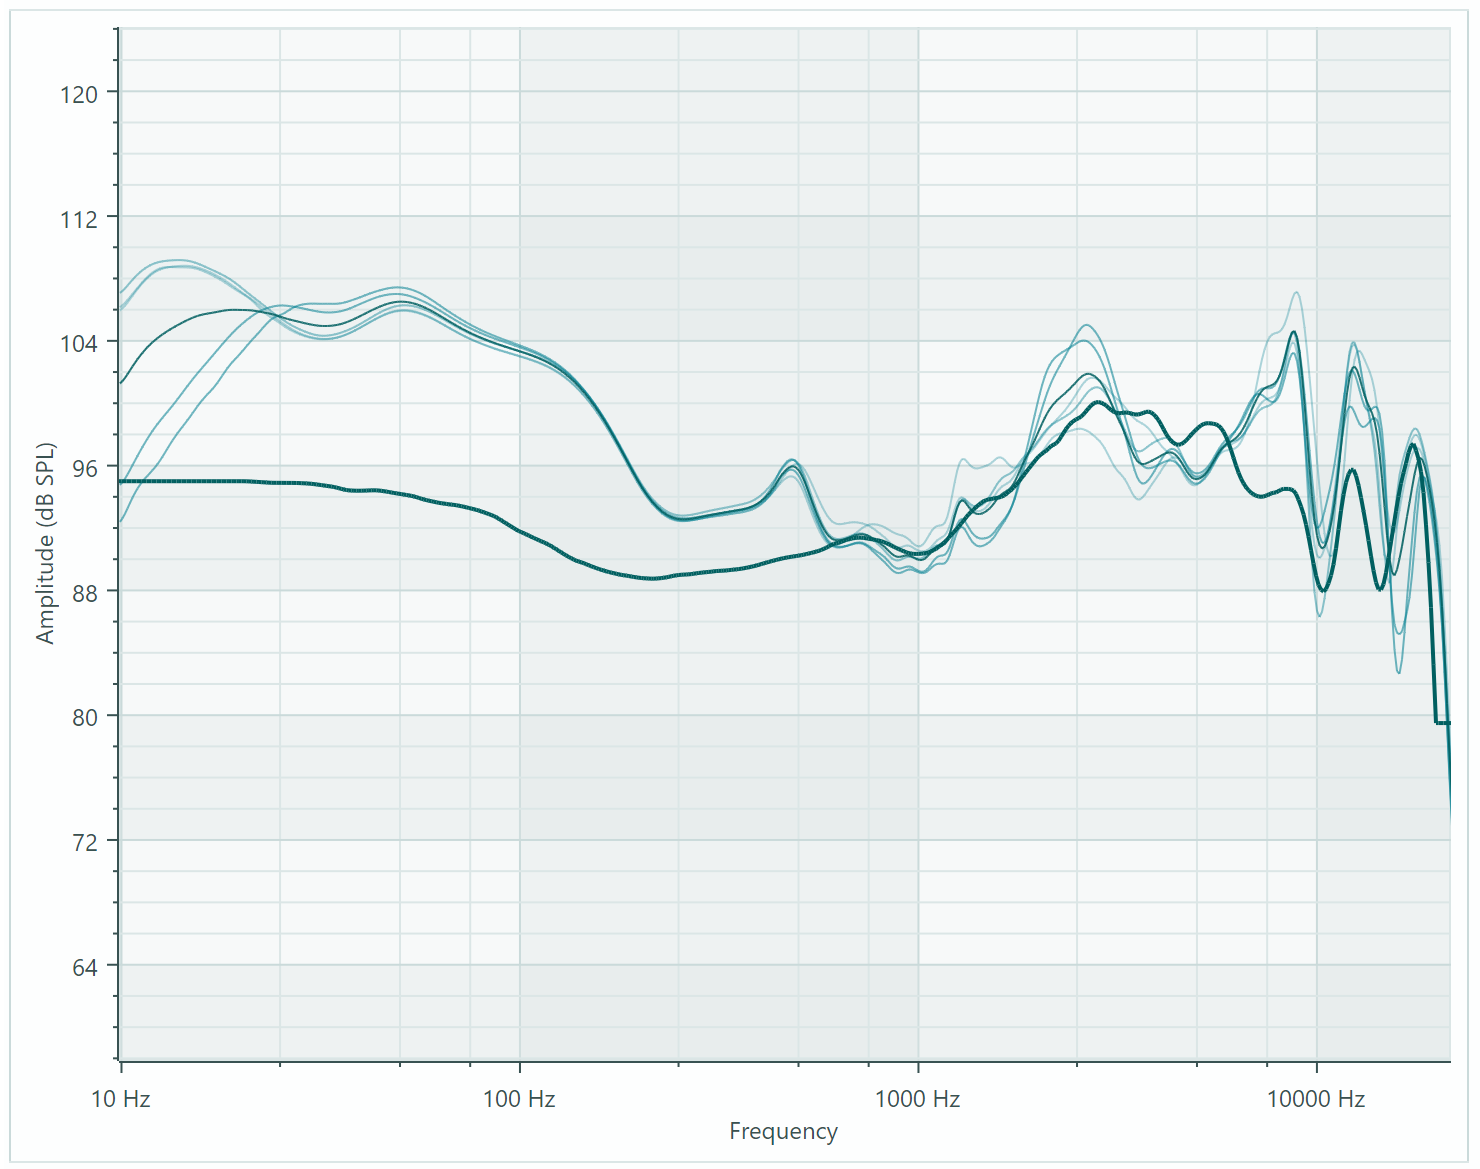
One of the important tasks when developing the control was optimizing the graphics engine for large volumes of data. And, it seems to us, we have successfully solved it. The updated demo application contains a new module with a CartesianChart control, which displays several data series consisting of a million points. You can open this module and test the scrolling and zooming functions for a large amount of data.
The ability to visualize real-time data has also been added to CartesianChart. In the demo application you can find the 'Real-Time Data' module, in which CartesianChart displays real-time data with a moving window effect.

In the future, we plan to create separate Chart Controls for displaying graphs in polar coordinates and Smith charts, as well as expanding the functionality of the CartesianChart control (legends, panels, bar charts, palettes, etc.).
Data Grid
The Data Grid control allows you to display and edit tabular multi-column data, supports sorting, grouping, data search, built-in editors and much more.
In the new version, Data Grid received the function of highlighting text in cells when searching for data.
The same functionality appeared in the Tree List and Tree View controls.
We have added a corresponding module to the demo center to show how the control works with large data sources.

The virtualization algorithm implemented by the control allows it to quickly display and scroll data sources containing millions of records.
Editors
A new control, MemoEditor, has been added to the editor package. This editor allows you to enter text in a drop-down window.

Another very significant update to editors is support for masks for text input. Masks allow you to validate values at the stage of entering into an editable field, and also serve to format values in display mode.
At the moment, masks have been implemented for entering numeric and DateTime values. In the SpinEditor and DateEditor editors, these masks are enabled by default. We plan to create masks of other types, including those based on regular expressions.
Controls for Delta Design
There are a number of internal controls that our team is working on as part of creating a multi-platform version of Delta Design. Although they are not yet included in the line of EremexControls.NET controls, your interest may prompt us to make the functionality of these controls public. Below we will briefly talk about two such controls, which within the team we call “Oscilloscope” and “3D Graphics Control”.
“Oscilloscope”
The “Oscilloscope” control (conventional name) is used in Delta Design Simtera to display a set of time series in the form of a hierarchical list. Data in each time series are presented in the form of meanders, characterizing transitions between logical zero and one. Oscilloscope also allows you to create graphical markers (in simple terms, vertical lines) to show the values of certain variables at specified points in time.

How often do you encounter time series display in UI? Do you need visualization of graphs (not only in the form of meanders) in the cells of table controls, such as Data Grid and Tree List. We welcome your comments.
“3D Graphics Control”
You may know that Delta Design allows you to view 3D models of components (packages) and the entire PCB. However, when porting Delta Design to Avalonia UI, we could not find a ready-made multi-platform solution for displaying 3D graphics. As a result, we had to create such a control for our CAD system.

Main functions of the “3D Graphics Control” control:
Own API for specifying models, cameras and materials (in PBR format).
The camera supports 3D views – perspective and isometry.
Rotate, scale and pan the model in runtime using the mouse and keyboard.
Uses Vulkan SDK to display 3D graphics.
As mentioned earlier, this control is not yet included in the EremexControls.NET library. Are controls for visualizing 3D graphics interesting to you as application developers? We are waiting for your comments.
Documentation
We recently launched a website with documentation of our controls in English and Russian.
https://eremexcontrols.net/docsru/
Documenting controls in Russian is somewhat difficult due to specific terminology, which originates from the English language. Often the terms do not have a comprehensive translation into Russian. For example, the term “control” is traditionally translated as “control element”, “toolbar container” – “toolbar container”. However, in such translations there is a certain cumbersomeness that distracts the reader from the essence of the description.
To document the product as accurately as possible, the main emphasis was placed on writing an English version of the documentation. The Russian version is created using the Yandex.Translator machine translation system. At the same time, certain edits are applied to the machine translation results to improve the quality of the translation of headings and terms.
Demo application and telegram channel
We have updated the demo application, which allows you to take a closer look at the EremexControls.NET library for Avalonia UI. The update includes additional modules for the CartesianChart and Data Grid controls:
https://github.com/Eremex/controls-demo
We also have a telegram channel where we will be happy to answer any questions about the control library:
Exhibition
And finally, about the ExpoElectronica 2024 exhibition, which starts on April 16. We invite everyone to the Eremex stand:
stand No. G9035, Pavilion No. 2, Hall 11 (3rd floor), Crocus Expo IEC.
For register and receive free tickets keep our promo code: ee24eESFE.
On April 16, the developers of the EMXControls team will be happy to communicate with you personally and present the EremexControls.NET control library. Come, we'll be waiting.
More detailed information about the exhibition program here: EREMEX at the ExpoElectronics exhibition.