DBGridChart framework and OLAP application Express_processing.exe for database maintenance and data analysis
The article discusses the purpose, main features and capabilities Framework “DBGridChart” And OLAP – applications “Express_processing.exe” (developer – Pleshchev V.V.., http://vipuskniki.usue.ru/Docum.html – DLLsource texts, description and demo examples).
The framework is focused on automating the development of programs using C# on the formation of input tabular and tape documents for maintaining databases c DBMS SQL Server, PostgeSQL, MySQL, Access in non-permanent connection mode ADO .NET and immediate (without intermediate accumulation of changes) adding, deleting or changing records while maintaining the integrity of the database, as well as for the formation of pre-unregulated analytical tables and charts for data analysis, using a unified technology (using control elements dataGridView And Chart in C#) with a multi-functional, unified, adaptive and user-friendly ready-made interface.
OLAP-application “Express_processing.exe” allows you to: display request descriptions Select from the source texts of the programs into a separate text file, which eliminates the need to develop original programs for maintaining databases with different DBMS and the formation of analytical tables and diagrams. A special visual constructor has been developed to generate queries. Information about tables, Select queries and their fields is taken automatically by the designer from the database. Without leaving the application, the user can quickly create, save and use queries using a visual query designer to analyze data and maintain a database. The application itself is implemented using Framework “DBGridChart”.
Let's briefly consider the main technical features of the Framework in relation to C#.
There is a class in C# DataGridView And TableAdapter for working with databases in tabular form using technology ADO. NET.
However, C# does not have a ready-made interface for working with databases in tabular form. The programmer has to either develop it in an original way or look for an appropriate tool. Existing tools provide a minimal interface, for example, the formation of three buttons for deleting, adjusting and adding new records highlighted with the mouse.
The “DBGridChart” framework completely solves this problem, offering a ready-made adaptive universal interface: substitution of codes from reference tables with code names; expanding many columnar tables into strip forms (each row of the source table is expanded into a single strip of multiple rows and up to five values of the source table in one row of the strip); generation of analytical charts of up to 30 different types and calculation tables, including summary, step and cross tables; filtering and sorting rows by several columns; hiding and pinning columns; expanding the table to full screen and collapsing it back; export and print tables; control of the display of hints, modes of changing values in table cells and access to the table; copying lines; setting the form layout (fonts, colors, data format in columns, size and location of the table on the form, operating modes, etc.) and saving the tabular form layout for later use, etc.
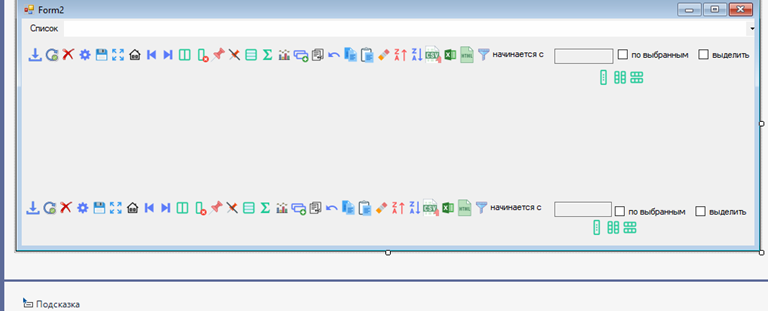
The programmer just needs to create a form inherited from the required form (out of 9 forms from 1 to 9 tables on each form, respectively) of the “Hablon” class of the Framework with ready-made 30 buttons with pictures and interface fields, make invisible buttons and elements that are not included in the interface for this program (Fig. 1).
In the “Hablon” class, the programmer can change the images on the buttons, the texts of tooltips, the composition of the elements on the form, etc.
In the form loading procedure, specify 5 to 6 commands for each table: creating an instance of a class ClassBD_dataGridView and set class properties: text of the database connection string, description of the dataGridView table, text of the Select command, text of the code substitution line, if there are substitutions, and execute a method for loading the query result into the table with data.
This concludes the programming. In practice, programming is about forming teams Select query constructors DBMS or DBGridChart framework. The table form layout is generated automatically with column headings from the names or aliases of the fields in the Select query. The Update, Insert and Delete commands are generated automatically from Select if in the text of the Select command after the name or alias of a field or table you specify special symbols: @ – key field, # – non-correctable field, * – mandatory field, ~ – adjustable table , if there are several tables in the query.
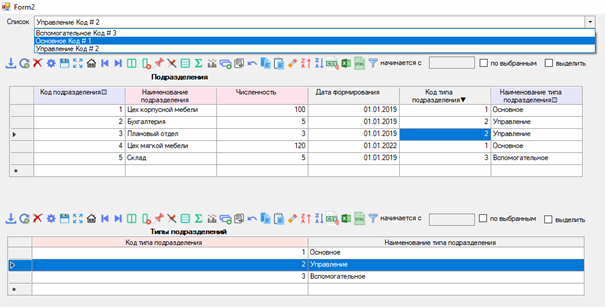
For clarity, special characters can be displayed in the column headings automatically at the beginning (←,↑,↓) and at the end (★,☒,▼) of the column names, which indicate additional characteristics of the columns:
★ – required column.
☒ – the column is read-only and changing the values of cells in the column is prohibited (adjustment is locked). If the symbols ★,☒ are not specified, then the column is optional.
▼– to enter values (usually codes) into column cells, substitution from tables with codes is allowed.
← – fixes a column when moving the table to the right.
↑ – the table is sorted in ascending order of cell values in the column.
↓ – the table is sorted in descending order of cell values in the column.
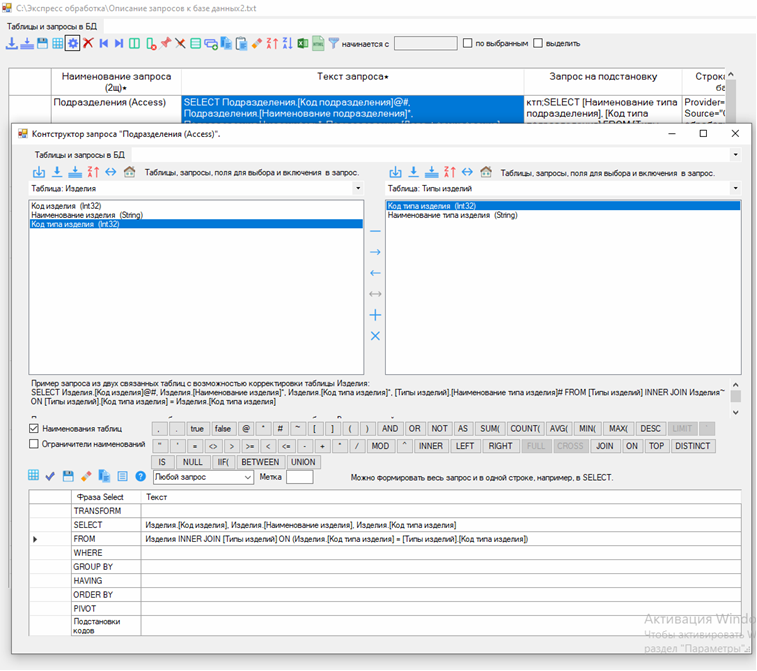
In OLAP application “Express_processing.exe” lines with the Select command, connections to the database with the text of substitutions were transferred to a text file with a description of the requests, which completely eliminated the programming process (Fig. 3).
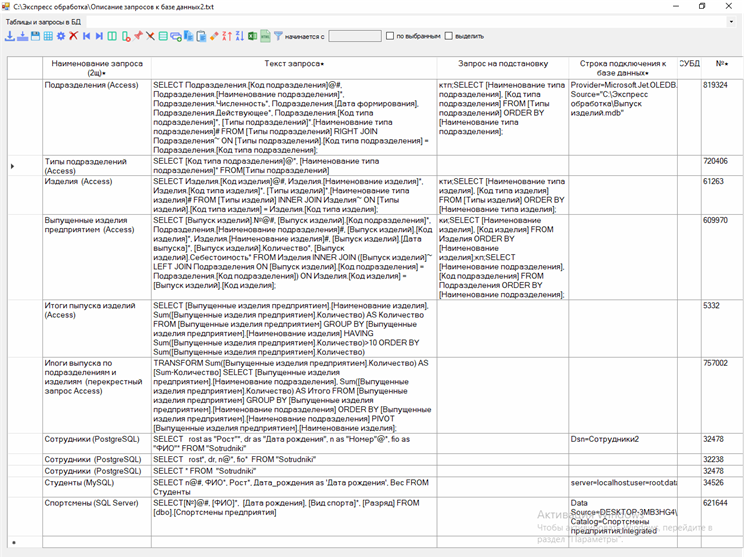
The user opens a file with a description of queries in tabular form, selects and executes the desired query.
Using the visual query designer of the “DBGridChart” Framework, the user can change the existing (delete or add new columns, including calculated ones, set a new sort order, rearrange columns, change column names or query types, etc.) and remember the new request without programming (Fig. 4).
The advantages of using a query builder include versatility and additional capabilities: the user can create unique conditions for selecting records, delete or add new columns, including calculated ones, set a new sort order, rearrange columns, change column names or query types, etc. Disadvantage – you need adjust command text Select.
Filling the table is done very quickly using TableAdapter C# without explicit visual creation of objects bindingSource, DataSet.
Disadvantage of technology ADO .NET V C# is to create a copy of a part of the database (temporary data storage) from a request and further work with this copy without connecting to the database. Changes are transferred to the database using the method Update (deferred adjustment) And In the event of an emergency shutdown, all changes will be lost! If the integrity of the database is violated, the rows in the table are marked with an exclamation mark and the user must find these rows and correct them again in a new adjustment session! Team Insert is not generated automatically.
In In the “DBGridChart” framework, a copy is not formed and after filling in all the required fields in the current row of the table, an immediate connection to the database is performed and the Update command is executed to correct the corresponding record in the database, a control read with the Select command and the changed record is output from the database to the current one a table row for visual verification of changes by the user and confirmation of changes being made to the database, then disconnection from the database is performed. Therefore, in case of an abnormal termination, only the changes in one current row can be lost. If the integrity of the database is violated, the DBMS displays an error message, the row remains in the state before the change, and the user can immediately repeat the changes with new data. If there is no record in the database, the Insert command is automatically executed. Thus, connection to the database occurs only for the duration of the command execution SQL and creates the illusion of a permanent connection to the database with its real advantage – immediate adjustment of the database.
Another problem in C# is hiding strings dataGridView takes a long time and filtering tables with more than 20,000 rows take more than 10 minutes to complete! In The DBGridChart framework solves this problem by highlighting the background color of the selected rows, which is different from the background of unselected rows that are not hidden on the screen.
The Framework provides sorting of table rows into several columns with the ability to specify the sort order for each individual column.
Let's look at other constructors and interface elements.
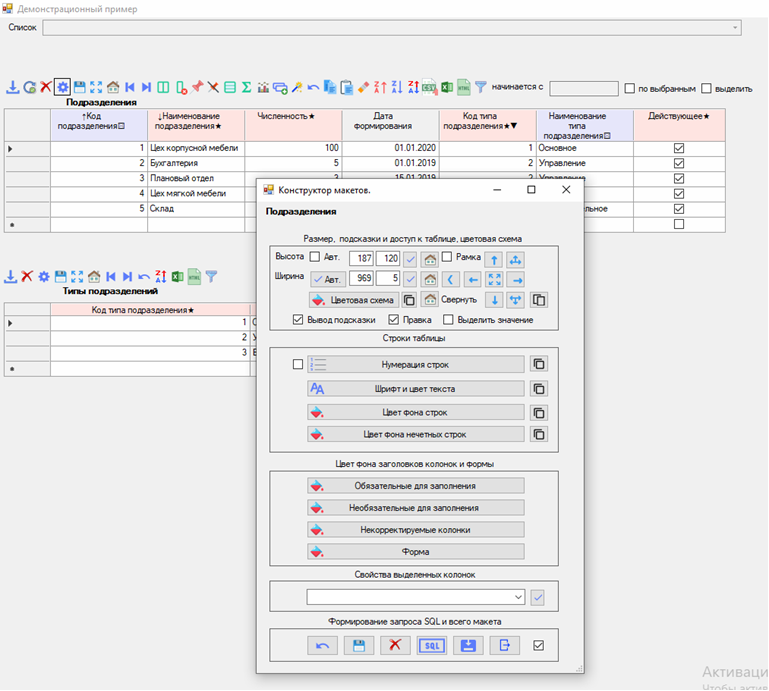
The layout designer allows the user to directly create the layout of the table form (Fig. 5). The user has a visual opportunity to create a new layout or change an old layout using the layout designer, for example: change the height and width (the minimum width of the table is equal to the sum of the widths of all visible columns) and the order of the columns in the table, hide columns unnecessary for work, specify the row numbering mode, set the name , the type and size of the font for the text displayed in the table rows and in the list for substituting codes, change the colors of table and form elements, set the formats of the data displayed in cells, etc.
The generated layout can be saved for subsequent user sessions. From the designer window, you can call the query designer using the SQL button to change the original query to create a table. Buttons for expanding the table to full screen and collapsing it to its original position are duplicated in the command line for quick access. This allows you to place many tables on one form and the user can select and expand the table needed for work to full screen.
The filter designer allows you to create various conditions for selecting records (Fig. 6).

Implemented work with multi-line queries and with variable queries and tabular forms using filter and query constructors.
The filter designer has a mode Filter rows in the database, not in the tablewhich automatically generates a phrase Where in the command text itself Select from the conditions for selecting records specified in the filter and this allows you to select as quickly as possible with the command Select records in the database itself with a large number of records. The advantage of this option is its simplicity – the user does not need to create conditions in the language SQL and adjust the team Select. This allows you to work effectively with large tables when the user does not need to completely load it into the DataGridView table.
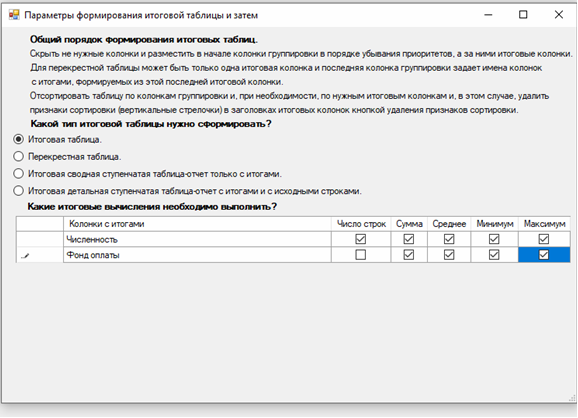
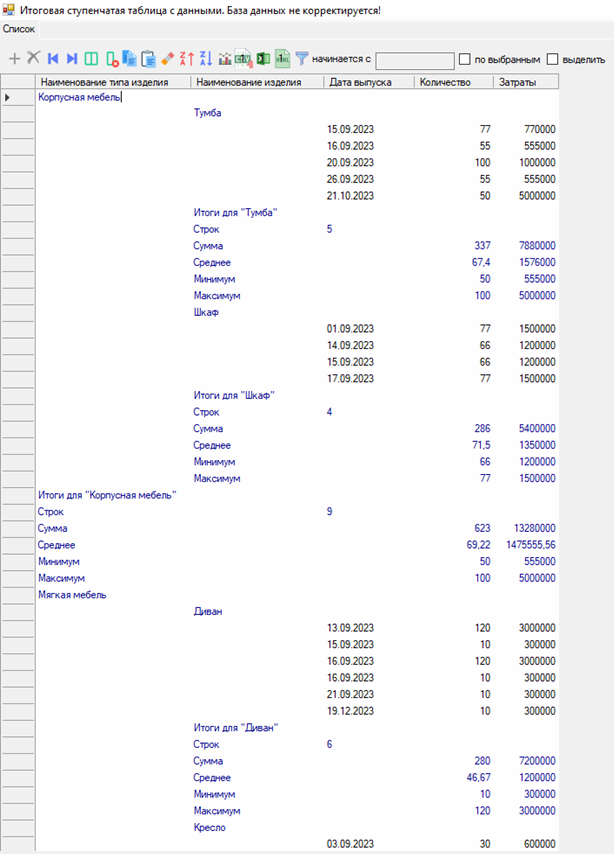
The summary table designer allows you to create various tables for data analysis (Fig. 7-10).


The user has a visual opportunity to create a new layout or change an old layout using the layout designer, for example: change the height and width (the minimum width of the table is equal to the sum of the widths of all visible columns) and the order of the columns in the table, hide columns unnecessary for work, specify the row numbering mode, set the name , font type and size for the displayed text in table rows and in the list for substituting codes (property List), change the colors of table and form elements, set formats for output data in cells, etc.
The ribbon form designer is designed for generating forms from source tables with a large number of columns (Fig. 11-12).
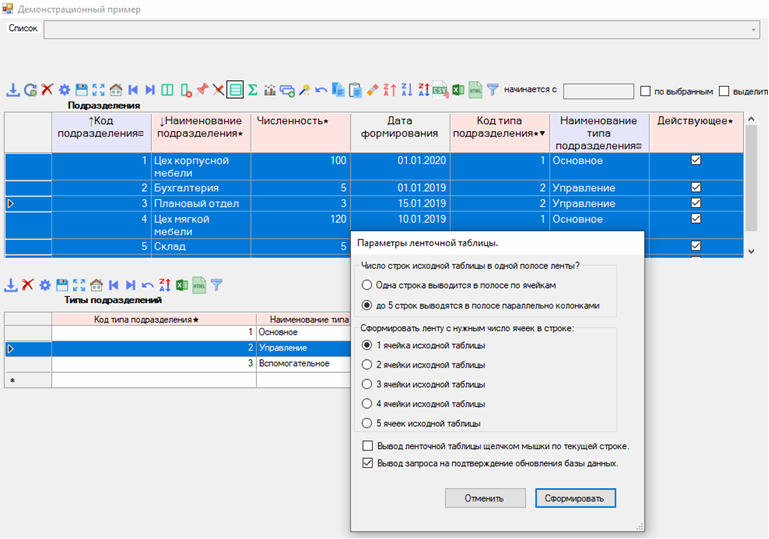
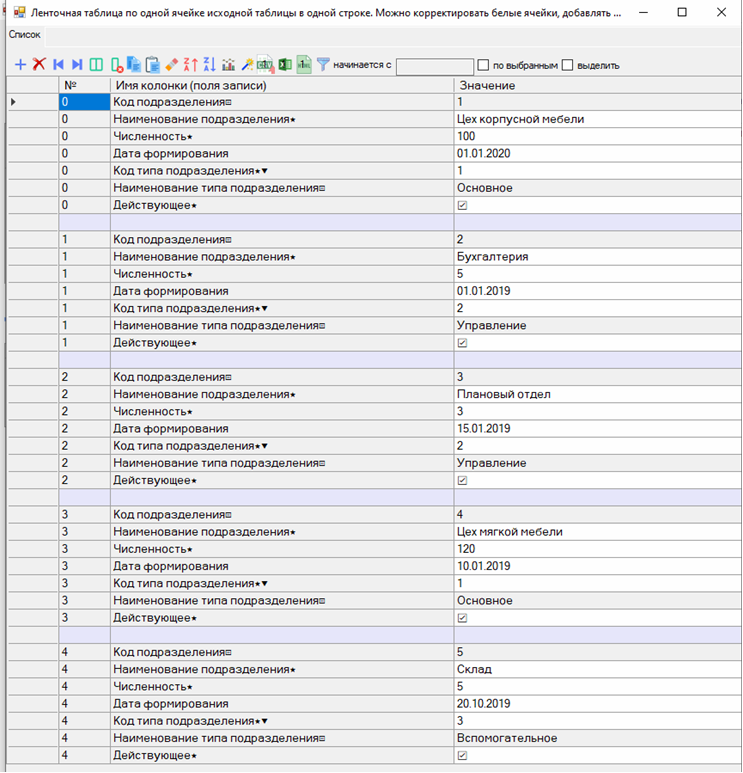
Ribbon forms allow you to display all the cells from one row of the original table, making them easy to view and adjust without having to move the viewport horizontally.
The chart designer is designed to generate various types (up to 30) of analytical charts. Before displaying the diagram, the user creates and sorts a table with data for the diagrams (Fig. 13).

Next, the type is selected and the diagram is displayed.
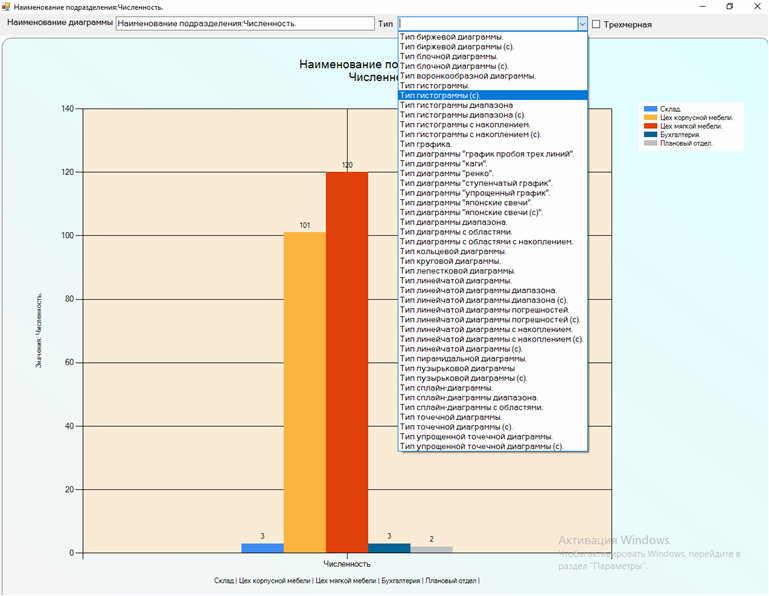
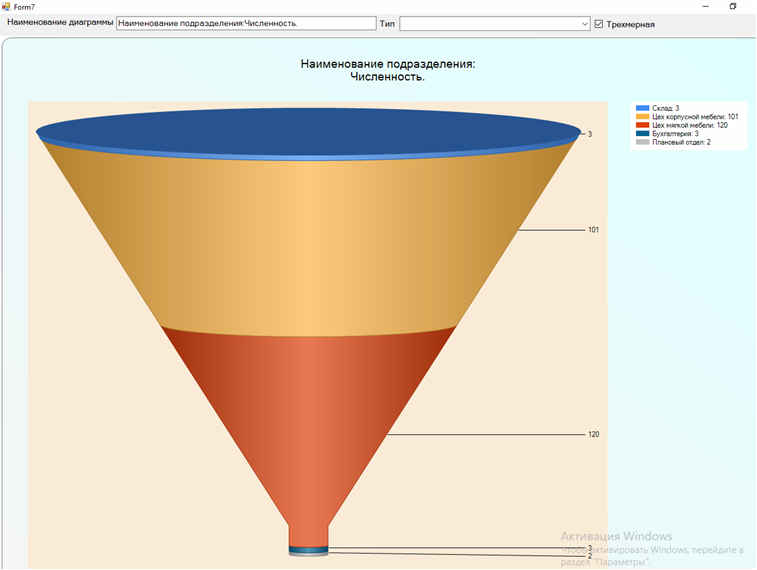
As a drawback in the current version of the “DBGridChart” Framework, we can note that it only works with data of the following types: number, text, date and logical type.
In general, it can be noted that during the implementation of the interface, various techniques and methods of working with databases and analyzing data in tabular and graphical forms of various software systems were identified, analyzed, unified and implemented, Configuration tools are proposed at the programmer-developer and end-user levels.
Running demo examples shows the capabilities and performance of the “DBGridChart” and OLAP Framework-applications “Express_processing.exe”.
Availability of a complete description, DLL, source texts of the “Hablon” class and OLAP-applications “Express_processing.exe”. on the developer's website they provide the opportunity to use these tools in practical activities.
