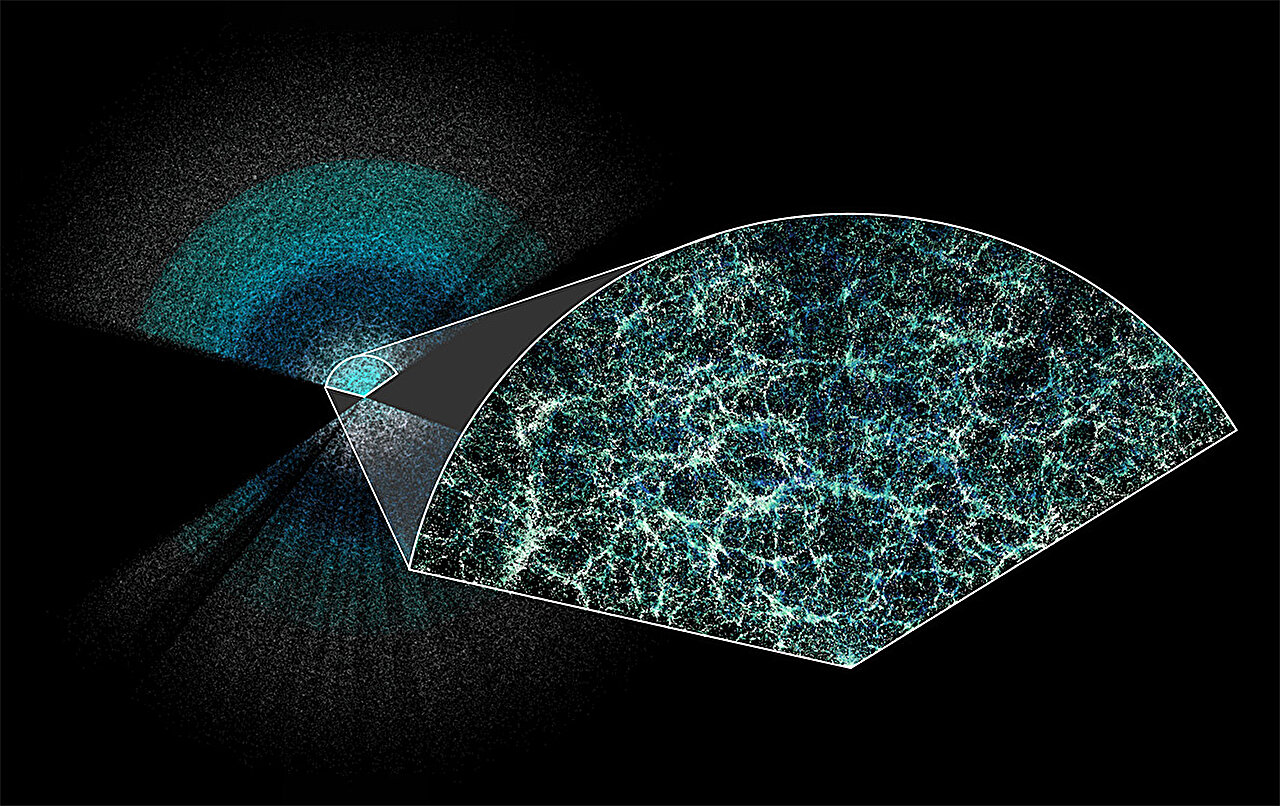
DESI researchers have compiled the largest three-dimensional map of our Universe
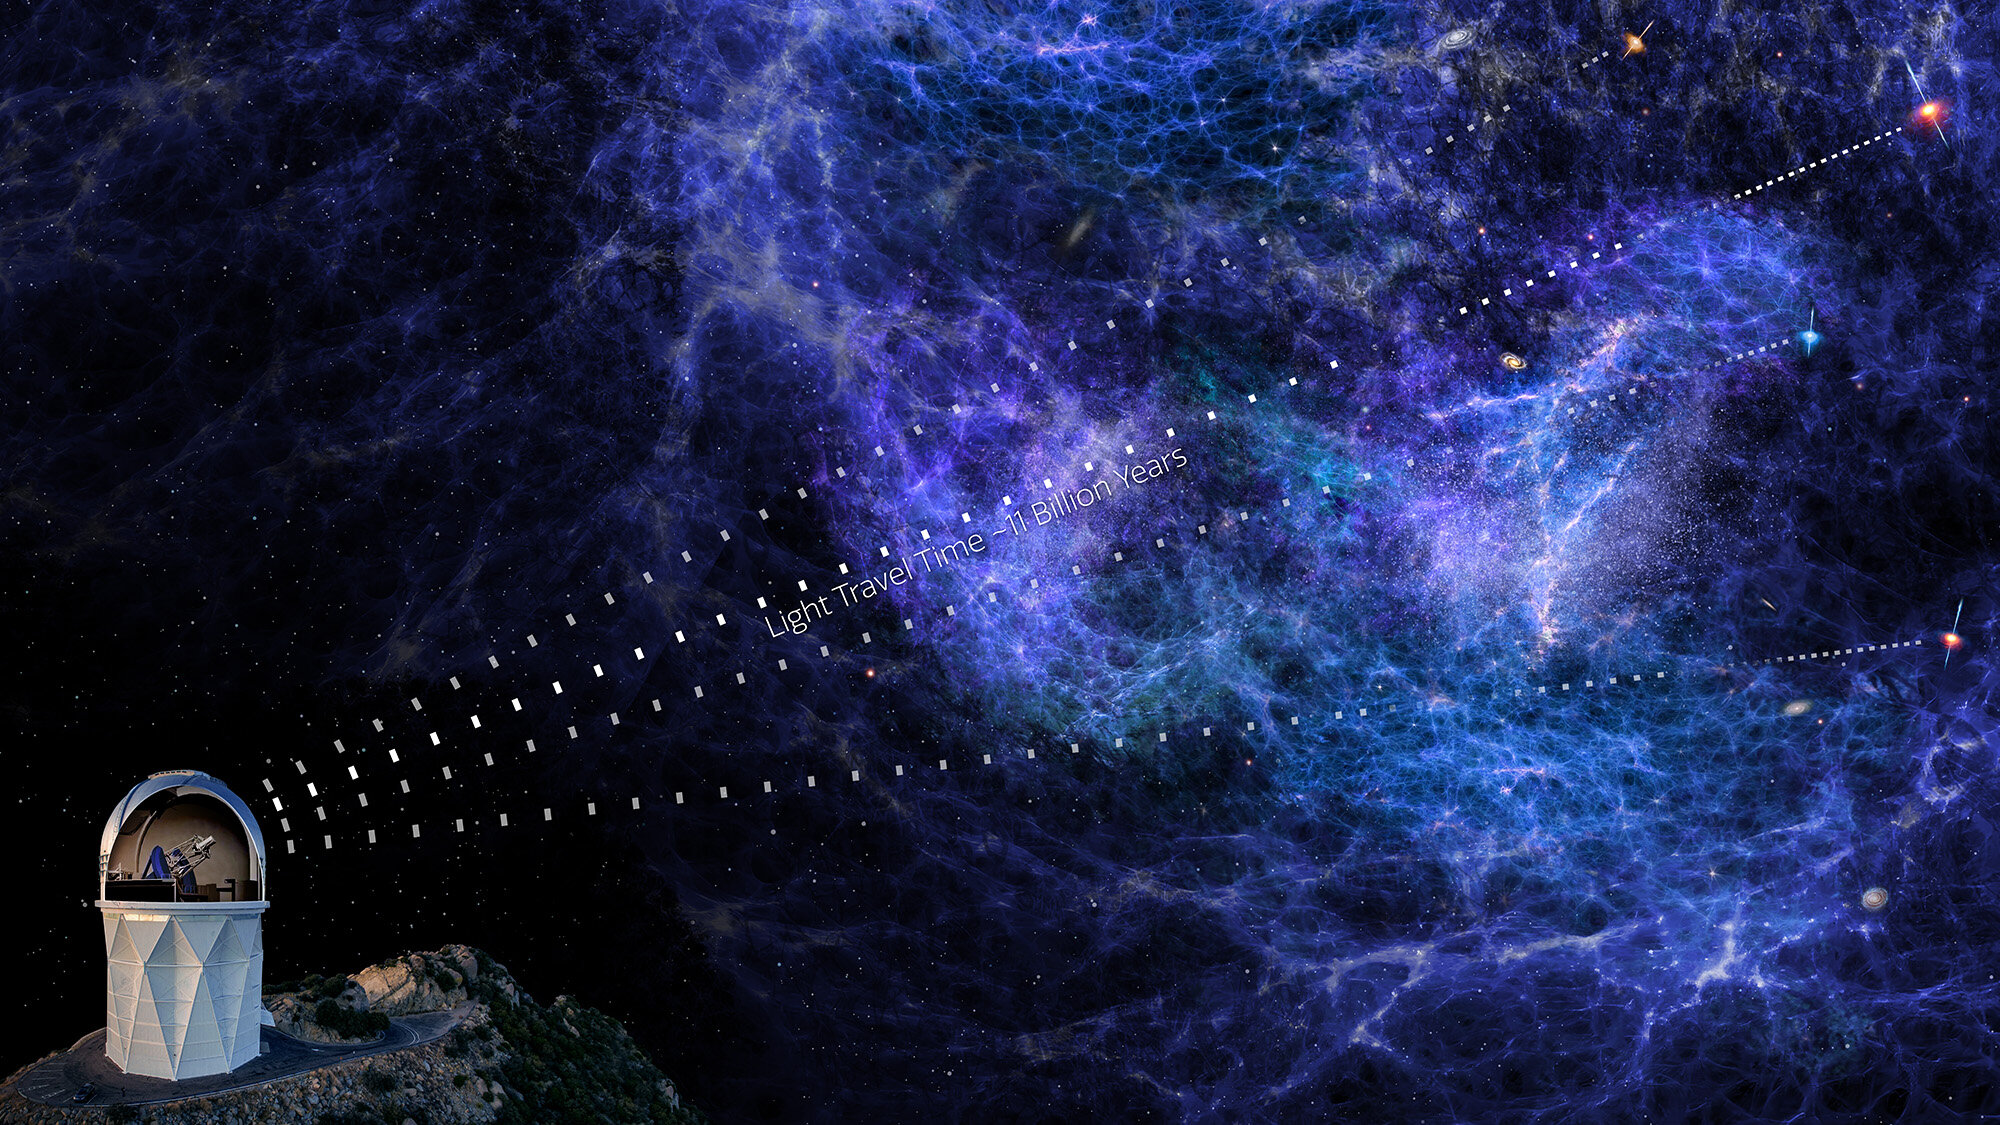
Using 5,000 tiny robots in a telescope perched atop a mountain, researchers can peer 11 billion years into the past. Light from distant cosmic objects is only now reaching the Dark Energy Spectroscopic Instrument (DESI), allowing us to map the cosmos as it was in its youth and trace its development to what we see today.
Understanding how our Universe evolved involves how it will end and one of the biggest mysteries in physics: dark energyan unknown ingredient that causes our Universe to expand faster and faster.
To study the influence of dark energy over the past 11 billion years, DESI created the largest 3D map of our cosmos ever created, with the most precise measurements to date. For the first time, scientists have measured the expansion history of the young Universe with an accuracy of better than 1%, giving us a better understanding of how the Universe evolved.
The researchers shared the results of their analysis of data collected over the first year in several articleswhich will be published today on the arXiv preprint server, as well as in reports on meeting of the American Physical Society in the USA and at the Rencontres de Moriond conference in Italy.
“We are incredibly proud of these data, which provide world-leading results in cosmology and are the first results of a new generation of dark energy experiments,” said Michael Levy, director of DESI and a scientist at the Department of Energy's Lawrence Berkeley National Laboratory, which is leading the project.
“So far we're seeing overall consistency with our best model of the Universe, but we're also seeing some potentially interesting differences that could indicate dark energy is evolving over time. These may or may not disappear as more data is collected.” So we're looking forward to analyzing our three-year data set.”
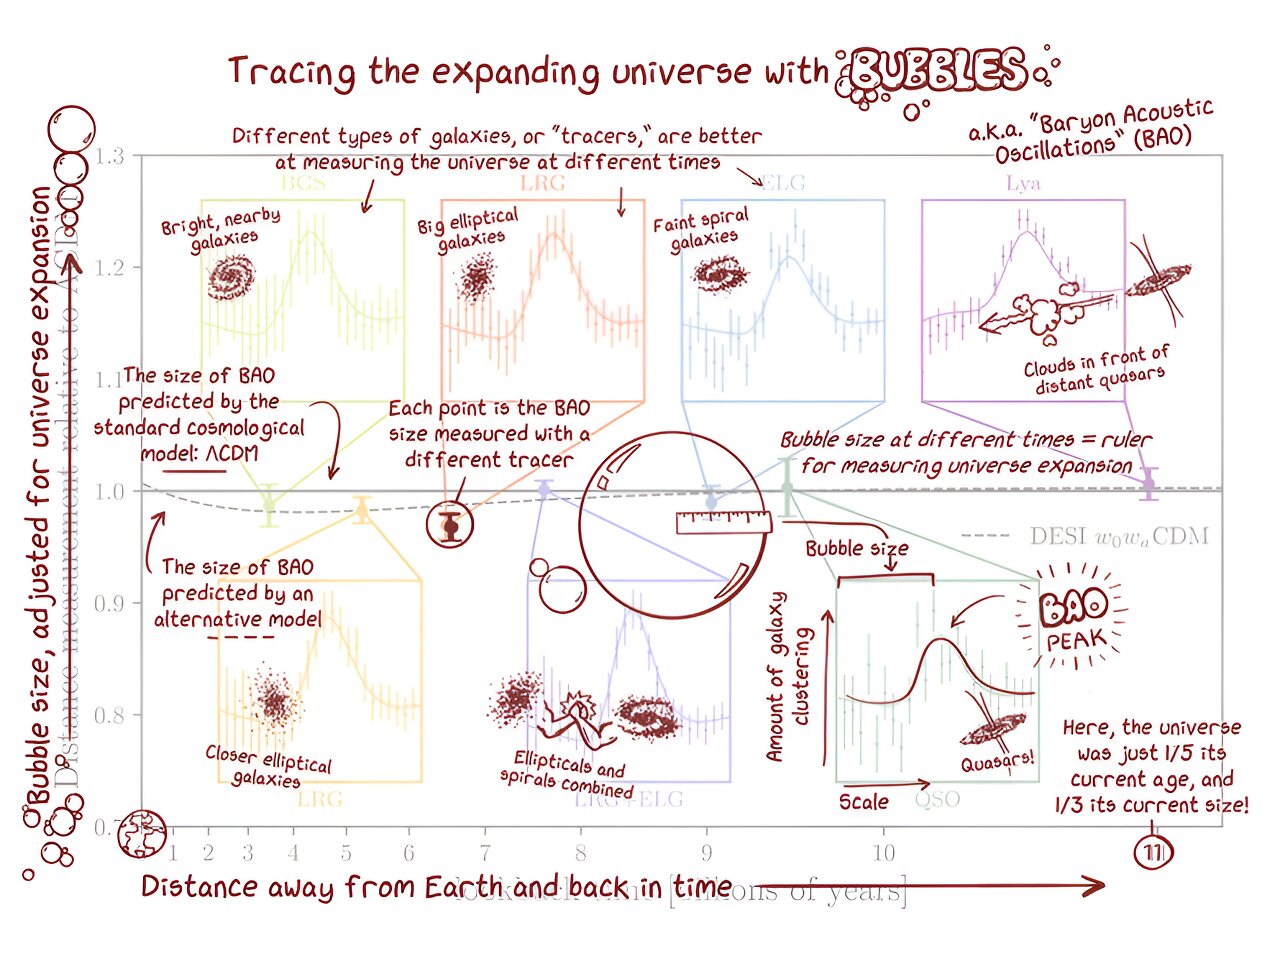
This animation shows how the acoustic oscillations of baryons act like a cosmic ruler to measure the expansion of the Universe.
Our leading model of the Universe is known as Lambda CDM. It includes both weakly interacting matter (cold dark matter, or CDM) and dark energy (Lambda). Both matter and dark energy determine how the universe expands, but in opposite ways. Matter and dark matter slow down expansion, while dark energy speeds it up. The amount of each of these components influences the evolution of our Universe. This model describes well the results of previous experiments and what the Universe looks like over time.
However, when results from the first year of DESI are combined with data from other studies, some subtle differences emerge from what the Lambda CDM predicts. As DESI collects more information over the course of the five-year study, these early results will become more precise, shedding light on whether the data point to other explanations for the results we observed or to the need to update our model.
The additional data will also improve other early DESI results, which concern the Hubble constant (a measure of how fast the universe is expanding today) and the mass of particles called neutrinos.
“No other spectroscopic experiment has collected this amount of data, and we continue to collect data on more than a million galaxies every month,” says Nathalie Palanque-Delabrouy, a Berkeley Lab scientist and one of the experiment's authors.
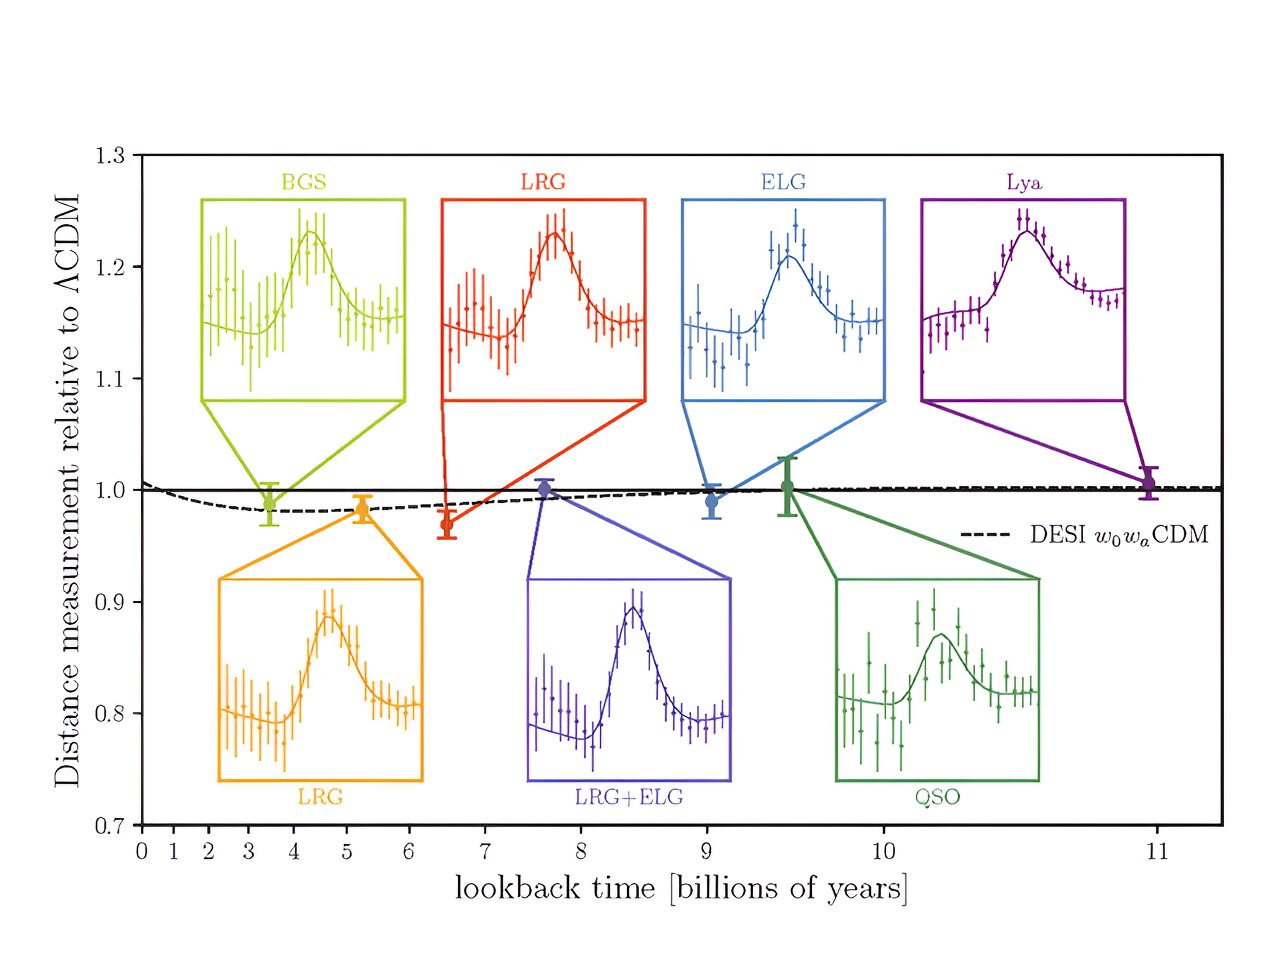
“It's amazing that with just the first year of data, we can already measure the expansion history of our Universe over seven different periods of cosmic time, each with an accuracy of 1 to 3 percent.” The team did a great job of taking into account the instrumental and theoretical intricacies of the modeling, which gives us confidence in the reliability of our first results.”
The overall accuracy of DESI's measurement of expansion history over the entire 11 billion years is 0.5%, and for the most distant epoch, spanning 8-11 billion years in the past, the accuracy is a record 0.82%. This kind of measurement of the development of our young Universe is incredibly difficult to do.
However, in one year, DESI became twice as powerful in measuring expansion history during these early times as its predecessor (BOSS/eBOSS Sloan Digital Sky Survey), which took more than a decade.
“We are excited to see the cosmological research results obtained in DESI's first year,” said Gina Rameika, deputy director for high energy physics at the Department of Energy. “DESI continues to amaze us with its stellar performance and is already shaping our understanding of the universe.”
Journey into the past
DESI is an international collaboration of more than 900 researchers from more than 70 institutions around the world. The instrument is installed on the US National Science Foundation's Nicholas W. Mayall 4-meter telescope at Kitt Peak National Observatory as part of the US National Science Foundation's NOIRLab program.

Looking at the DESI map, it's easy to see the basic structure of the Universe: threads of galaxies clustered together, separated by voids with fewer objects. Our early Universe, far beyond DESI's visibility, was very different: a hot, dense soup of subatomic particles moving too fast to form stable matter like the atoms we know today.
Among these particles were nuclei of hydrogen and helium, that is, baryonic matter. Tiny fluctuations in this early ionized plasma caused pressure waves, moving baryons in ripples similar to what you might see when you throw a handful of pebbles into a pond. As the Universe expanded and cooled, neutral atoms formed and the pressure waves ceased, freezing the ripples in three dimensions and increasing the clustering of future galaxies in dense regions.
Billions of years later, we can still see a faint pattern of three-dimensional ripples, or bubbles, in the characteristic separation of galaxies – a feature called baryon acoustic oscillations (BAOs).
Researchers use BAO measurements as a cosmic ruler. By measuring the apparent size of these bubbles, they can determine the distance to the matter responsible for this extremely faint pattern in the sky. Mapping the BAO bubbles up close and at a distance allows researchers to slice the data, measure the expansion rate of the Universe at every moment in its past, and model how dark energy influences that expansion.
“We measured the expansion history over this huge range of cosmic time with a precision that exceeds all previous BAO studies combined,” says Hee-Jong Seo, a professor at Ohio University and co-leader of the BAO analysis at DESI. “We are very excited to discover how these new dimensions will improve and change our understanding of space. People have always been fascinated by the development of our Universe, wanting to know what it consists of and what will happen to it next.”
Using galaxies to measure expansion history and better understand dark energy is one method, but it can only go so far. At a certain point, the light from regular galaxies becomes too weak, so researchers turn to quasars—extremely distant, bright galactic nuclei with black holes at their centers. The light from quasars is absorbed as it passes through intergalactic clouds of gas, allowing researchers to map clumps of dense matter and use them in the same way as galaxies, a technique known as using a “Lyman-alpha forest.”
“We use quasars as backlights to see the shadow of the intervening gas between the quasars and us,” says Andreu Font-Ribera, a scientist at the Institute of High Energy Physics (IFAE) in Spain, who co-led the analysis of the Lyman-alpha forest at DESI. . “This allows us to look further back, to a time when the Universe was still very young. This is a very complex measurement, and it's great that it was done.”
The researchers used 450,000 quasars—the largest set ever assembled for these Lyman-alpha forest measurements—to extend the BAO measurements to 11 billion years in the past. By the end of the study, DESI expects to have mapped 3 million quasars and 37 million galaxies.
Modern science
DESI is the first spectroscopic experiment to use a completely “blind” analysis, hiding the true result from scientists to avoid subconscious confirmation bias. Researchers work in the dark with altered data, writing code to analyze their findings. Once everything is ready, they apply their analysis to the original data to find out the real answer.
“The way we conducted our analysis gives us confidence in our results, and especially that the Lyman-alpha forest is a powerful tool for measuring the expansion of the universe,” says Julien Guy, a Berkeley Lab scientist and co-leader of spectrograph processing. DESI.
“The data set we're collecting is exceptional, as is the speed at which we're collecting it. It's the most accurate measurement I've ever taken in my life.”
This 360-degree video takes you on an interactive tour of millions of galaxies mapped using DESI coordinate data. Credit: Fiske Planetarium, CU Boulder and DESI Collaboration
DESI data will be used to complement future sky surveys such as the Vera C. Rubin Observatory and the Nancy Grace Roman Space Telescope, as well as to prepare for a potential DESI upgrade (DESI-II) that was recommended in the recent report US particle physics project prioritization groups.
“We are in a golden era of cosmology: large-scale research is already underway and about to begin, and new methods are being developed to make the best use of these data sets,” says Arnaud de Mattia, a researcher at the French Commission for Alternative Energy and Atomic Energy ( CEA) and co-leader of the DESI group dedicated to the interpretation of cosmological data.
“We are all very interested in seeing whether new data confirms the features we saw in our first year sample and better understand the dynamics of our Universe“.