Block storage performance based on soft raids (mdadm, LVM and ZFS) using iSER and NVMe-oF
The first article was devoted to performance from the local system (https://habr.com/ru/articles/753322/).
The point of this article remains the same, to show maximum performance when the issue of data safety is resolved by replicas or backups.
The purpose of this article is to test the performance of three systems for combining physical devices into one logical system using iSER and NVMe-oF.
Within the framework of this article, three systems will be compared that demonstrate the highest performance according to the test results from the first part.
mdadm raid0
LVM stripe
ZFS stripe (default lz4)
And also the most functional solution of the available free backends:
ZFS stripe with compression and deduplication
When connected via iSER and NVMe-oF.
Test stand:
Virtualization server 1:
Motherboard: Supermicro H11SSL-i
CPU: EPYC 7302
RAM: 4x64GB Micron 2933MHz
Network: 40GbE ConnectX-3 Pro, 10GbE/25GbE ConnectX-4 LN EN
OS: ESXi 7U3 build 20036586
Virtualization server 2:
Motherboard: Tyan S8030 (ver 1GbE)
CPU: EPYC 7302
RAM: 4x64GB Micron 2933MHz
Network: 40GbE ConnectX-3 Pro x2 (One adapter inserted into the VM)
OS: ESXi 7U3 build 21930508
Storage VM on virtualization server #2which will provide block access for host 1 and host 2:
OS: Ubuntu 22.04, kernel 6.2.0-26 (mitigatios=off)
vCPU: 8
RAM: 64GB (expanded to 128GB for ZFS)
Drives: 6xPM9A3 1.92TB (upgraded to GDC5902Q version)
Connection diagram:
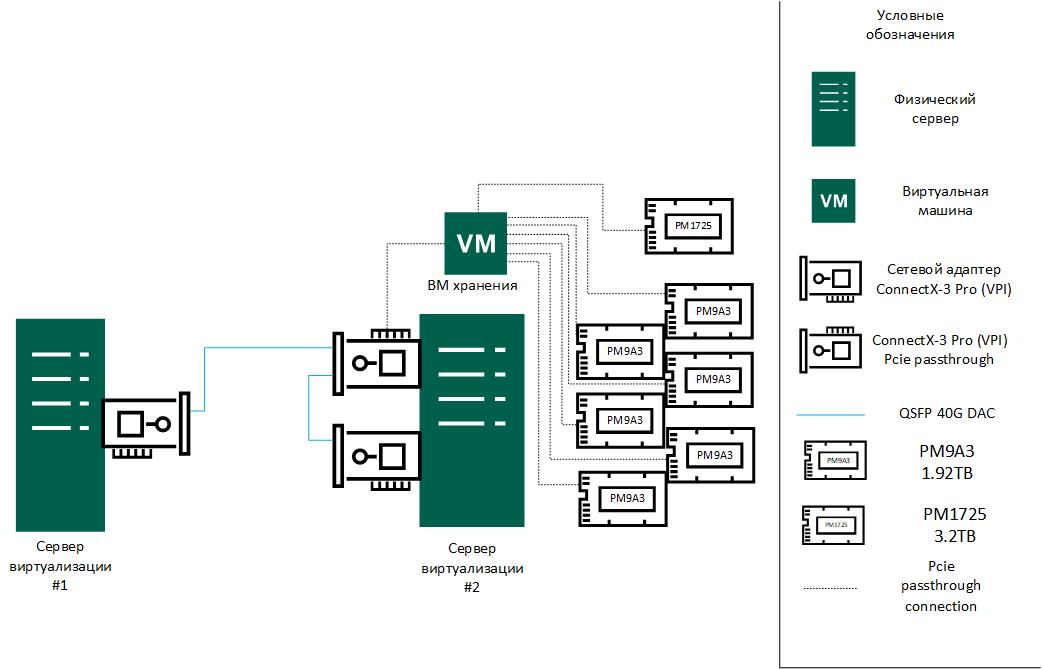
Note: There is no documentation for HCIbench on how to change the testing code to use /dev/nvme0nX instead of /dev/sdX, so tests are run using pvscsi.
According to tests, the difference between the pvscsi and nvme controller lies within the measurement error of 5% (more details in the test table) for version 7U3, since full NVMe back-to-back was implemented only in 8U2, which is no longer supported by ConnectX-3 🙁
The Prepare Virtual Disk Before Testing parameter is set to Random. Tests are carried out using – 4 VMs with two 100GB disks, 8 vCPUs, 16GB RAM.
To select tests, the reference values for the parameters were taken from next source.
Test 1:
VDbench – 4k – 80% rng – 50/50 r/w – 8 thread per disk
Test 2:
VDbench – 8k – 80% rng – 75/25 r/w – 8 thread per disk
Test 3:
VDbench – 64k – 80% seq – 75/25 r/w – 8 thread per disk
Test 4:
VDbench – max_iops_read – 4k – 100% rng – 100/0 r/w – 8 thread per disk
Test 5:
VDbench – max_iops_write – 4k – 100% rng – 0/100 r/w – 8 thread per disk
To test the drop in speed as a result of adding a layer in the form of a VM, tests from the first part were used, the results are below in the table and graph (error + -5%):
SCSI controller (pvscsi) | NVMe controller | %pvscsi=100% | |
Sequential recording 4M qd=32 | 4603.11 MB/s | 4594.44 MB/s | 99.81% |
Sequential reading 4M qd=32 | 4618.22 MB/s | 4618.33 MB/s | 100.00% |
Random recording 4k qd=128 jobs=16 | 558.56 MB/s | 541.06 MB/s | 96.87% |
Random reading 4k qd=128 jobs=16 | 589.72 MB/s | 581.89 MB/s | 98.67% |
Random recording 4k qd=1 fsync=1 | 54.61 MB/s | 60.02 MB/s | 109.90% |
Random reading 4k qd=1 fsync=1 | 28.28 MB/s | 29.76 MB/s | 105.21% |
The results of iperf3 tests between ConnectX-3 Pro were performed by forwarding ConnectX-3 Pro to a VM on each of the hosts, i.e. the diagram looks like this:

The result was:
Sender | 34.93 Gbits/sec |
Receiver | 34.21 Gbits/sec |
Rounding down, we get:
34 Gbits/sec (or 4.25 Gbytes/s)
Regarding OFED. Ubuntu 20.04 with kernel 5.5 and OFED installed for it was also used for tests, but Ubuntu 22.04.03 with kernel 6.2 showed higher performance and repeatability in iperf3.
iperf3
Tests were performed in accordance with these recommendations (https://fasterdata.es.net/performance-testing/network-troubleshooting-tools/iperf/multi-stream-iperf3/)
s1:  [ ID] Interval           Transfer     Bitrate         Retr
s1:  [  5]   0.00-10.00  sec  15.2 GBytes  13.0 Gbits/sec  1062    sender
s1:
s1:  iperf Done.
s2:  - - - - - - - - - - - - - - - - - - - - - - - - -
s2:  [ ID] Interval           Transfer     Bitrate         Retr
s2:  [  5]   0.00-10.00  sec  14.8 GBytes  12.7 Gbits/sec  1856    sender
s2:
s2:  iperf Done.
s3:  - - - - - - - - - - - - - - - - - - - - - - - - -
s3:  [ ID] Interval           Transfer     Bitrate         Retr
s3:  [  5]   0.00-10.00  sec  10.0 GBytes  8.59 Gbits/sec  1027    sender
Total 34.29 Gbits/sec
And with the -bidir flag
s1:  [ ID] Interval           Transfer     Bitrate         Retr
s1:  [  5]   0.00-10.00  sec  13.4 GBytes  11.5 Gbits/sec  1705    sender
s1:  [  5]   0.00-10.04  sec  13.2 GBytes  11.3 Gbits/sec          receiver
s1:
s1:  iperf Done.
s2:  - - - - - - - - - - - - - - - - - - - - - - - - -
s2:  [ ID] Interval           Transfer     Bitrate         Retr
s2:  [  5]   0.00-10.00  sec  10.4 GBytes  8.93 Gbits/sec  2171    sender
s2:  [  5]   0.00-10.05  sec  10.1 GBytes  8.61 Gbits/sec          receiver
s3:  - - - - - - - - - - - - - - - - - - - - - - - - -
s3:  [ ID] Interval           Transfer     Bitrate         Retr
s3:  [  5]   0.00-10.00  sec  16.8 GBytes  14.5 Gbits/sec  1513    sender
s3:  [  5]   0.00-10.04  sec  16.7 GBytes  14.3 Gbits/sec          receiver
s3:
s3:  iperf Done.
Comparing the performance of NVMe drives when they are connected directly to the OS or through VMware with PCIe passthrough, we can say that the performance does not change, since the results are within 2% of error.
Tests
PM1725 | Physical | Via PCIe passthrough |
Sequential recording 4M qd=32 | 1820.50 MB/s | 1826.50 MB/s |
Sequential reading 4M qd=32 | 4518.00 MB/s | 4553.50 MB/s |
Random recording 4k qd=128 jobs=16 | 1504.00 MB/s | 1502.50 MB/s |
Random reading 4k qd=128 jobs=16 | 3488.00 MB/s | 3514.50 MB/s |
Random recording 4k qd=1 fsync=1 | 148.50 MB/s | 172.50 MB/s |
Random reading 4k qd=1 fsync=1 | 42.90 MB/s | 45.45 MB/s |
PM9A3 (0369) | Physical | Via PCIe passthrough |
Sequential recording 4M qd=32 | 2811.00 MB/s | 2811.00 MB/s |
Sequential reading 4M qd=32 | 5822.50 MB/s | 5845.00 MB/s |
Random recording 4k qd=128 jobs=16 | 2807.00 MB/s | 2806.00 MB/s |
Random reading 4k qd=128 jobs=16 | 4601.00 MB/s | 4746.50 MB/s |
Random recording 4k qd=1 fsync=1 | 211.50 MB/s | 175.50 MB/s |
Random reading 4k qd=1 fsync=1 | 98.25 MB/s | 87.80 MB/s |
PM9A3 (6310) | Physical | Via PCIe passthrough |
Sequential recording 4M qd=32 | 2811.00 MB/s | 2811.00 MB/s |
Sequential reading 4M qd=32 | 5846.50 MB/s | 5835.50 MB/s |
Random recording 4k qd=128 jobs=16 | 2806.50 MB/s | 2807.00 MB/s |
Random reading 4k qd=128 jobs=16 | 4610.00 MB/s | 4743.00 MB/s |
Random recording 4k qd=1 fsync=1 | 211.50 MB/s | 178.00 MB/s |
Random reading 4k qd=1 fsync=1 | 98.30 MB/s | 87.85 MB/s |
PM9A3 (6314) | Physical | Via PCIe passthrough |
Sequential recording 4M qd=32 | 2811.00 MB/s | 2811.00 MB/s |
Sequential reading 4M qd=32 | 5839.00 MB/s | 5844.00 MB/s |
Random recording 4k qd=128 jobs=16 | 2806.00 MB/s | 2807.00 MB/s |
Random reading 4k qd=128 jobs=16 | 4602.50 MB/s | 4746.00 MB/s |
Random recording 4k qd=1 fsync=1 | 209.00 MB/s | 174.50 MB/s |
Random reading 4k qd=1 fsync=1 | 98.65 MB/s | 87.20 MB/s |
PM9A3 (3349) | Physical | Via PCIe passthrough |
Sequential recording 4M qd=32 | 2811.00 MB/s | 2811.00 MB/s |
Sequential reading 4M qd=32 | 5844.00 MB/s | 5835.50 MB/s |
Random recording 4k qd=128 jobs=16 | 2807.00 MB/s | 2806.50 MB/s |
Random reading 4k qd=128 jobs=16 | 4598.50 MB/s | 2328.00 MB/s |
Random recording 4k qd=1 fsync=1 | 208.00 MB/s | 201.50 MB/s |
Random reading 4k qd=1 fsync=1 | 98.10 MB/s | 94.90 MB/s |
PM9A3 (1091) | Physical | Via PCIe passthrough |
Sequential recording 4M qd=32 | 2811.00 MB/s | 2811.00 MB/s |
Sequential reading 4M qd=32 | 5827.00 MB/s | 5842.50 MB/s |
Random recording 4k qd=128 jobs=16 | 2806.50 MB/s | 2807.50 MB/s |
Random reading 4k qd=128 jobs=16 | 4514.00 MB/s | 4651.00 MB/s |
Random recording 4k qd=1 fsync=1 | 205.50 MB/s | 172.50 MB/s |
Random reading 4k qd=1 fsync=1 | 98.00 MB/s | 87.40 MB/s |
PM9A3 (0990) | Physical | Via PCIe passthrough |
Sequential recording 4M qd=32 | 2810.50 MB/s | 2811.00 MB/s |
Sequential reading 4M qd=32 | 5849.50 MB/s | 5857.00 MB/s |
Random recording 4k qd=128 jobs=16 | 2797.50 MB/s | 2807.00 MB/s |
Random reading 4k qd=128 jobs=16 | 4489.00 MB/s | 4646.00 MB/s |
Random recording 4k qd=1 fsync=1 | 206.00 MB/s | 183.50 MB/s |
Random reading 4k qd=1 fsync=1 | 97.20 MB/s | 88.05 MB/s |
2 scenarios will be considered:
Issuing a block device via iSER using LIO (configuration is done using targetcli-fb from the master branch of the repository)
Block device issuance over NVMe-oF using SPDK.
A small digression – at first it was planned to use the native kernel implementation – nvmet (https://enterprise-support.nvidia.com/s/article/howto-configure-nvme-over-fabrics–nvme-of–target-offload), but it is not supported by VMware (https://koutoupis.com/2022/04/22/vmware-lightbits-labs-and-nvme-over-tcp/ https://communities.vmware.com/t5/ESXi-Discussions/NVMEof-Datastore-Issues/td-p/2301440), so SPDK was used (https://spdk.io/doc/nvmf.html, https://spdk.io/doc/bdev.html)
iSER
From the Linux side:
In the LIO settings enable_iser boolean=true is specified at the portal level:
set attribute authentication=0 demo_mode_write_protect=0 generate_node_acls=1 cache_dynamic_acls=1Additionally, the following options are specified for the device (https://documentation.suse.com/ses/7/html/ses-all/deploy-additional.html):
set attribute emulate_3pc=1 emulate_tpu=1 emulate_caw=1 max_write_same_len=65535 emulate_tpws=1 is_nonrot=1From the VMware side:
esxcli rdma iser addThen the settings are similar to the settings for the iSCSI array.
The performance of mdadm with the FIO tests from the first part on 1 VM is as follows:
mdadm raid0 1VM | MB/s | IOPS |
Sequential recording 4M qd=32 | 3632.00 MB/s | 866.20 |
Sequential reading 4M qd=32 | 3796.50 MB/s | 902.14 |
Random recording 4k qd=128 jobs=16 | 352.00 MB/s | 85736.44 |
Random reading 4k qd=128 jobs=16 | 559.50 MB/s | 136797.19 |
Random recording 4k qd=1 fsync=1 | 39.80 MB/s | 9712.06 |
Random reading 4k qd=1 fsync=1 | 26.10 MB/s | 6382.21 |
The final graph looks like this:

MDADM
mdadm --create --verbose /dev/md0 --level=0 --raid-devices=6 /dev/nvme0n1 /dev/nvme1n1 /dev/nvme2n1 /dev/nvme3n1 /dev/nvme4n1 /dev/nvme5n1mdadm-iSER | MB/s | IOPS |
4k-50rdpct-80randompct | 486.78 MB/s | 124615.40 |
8k-75rdpct-80randompct | 941.52 MB/s | 120514.50 |
64k-75rdpct-80randompct | 3445.29 MB/s | 55124.70 |
4k-0rdpct-100randompct | 495.13 MB/s | 126752.90 |
4k-100rdpct-100randompct | 483.9 MB/s | 123877.10 |
LVM
lvcreate -i6 -I64 --type striped -l 100%VG -n nvme_stripe nvmeLVM-iSER | MB/s | IOPS |
4k-50rdpct-80randompct | 514.27 MB/s | 131652.90 |
8k-75rdpct-80randompct | 957.10 MB/s | 122509.10 |
64k-75rdpct-80randompct | 3710.36 MB/s | 59365.80 |
4k-0rdpct-100randompct | 535.9 MB/s | 137192.80 |
4k-100rdpct-100randompct | 505.42 MB/s | 129386.40 |
ZFS
v1 (without dedup)
zpool create -o ashift=12 -O compression=lz4 -O atime=off -O recordsize=128k nvme /dev/nvme0n1 /dev/nvme1n1 /dev/nvme2n1 /dev/nvme3n1 /dev/nvme4n1 /dev/nvme5n1 zfs create -s -V 10T -o volblocksize=16k -o compression=lz4 nvme/iserZFS – iSER | MB/s | IOPS |
4k-50rdpct-80randompct | 131.77 MB/s | 33734.00 |
8k-75rdpct-80randompct | 343.34 MB/s | 43947.40 |
64k-75rdpct-80randompct | 1418.62 MB/s | 22698.20 |
4k-0rdpct-100randompct | 80.81 MB/s | 20690.60 |
4k-100rdpct-100randompct | 251.38 MB/s | 64354.60 |
v2 (with dedup)
zpool create -o ashift=12 -O compression=lz4 -O atime=off -O dedup=on -O recordsize=128k nvme /dev/nvme0n1 /dev/nvme1n1 /dev/nvme2n1 /dev/nvme3n1 /dev/nvme4n1 /dev/nvme5n1 zfs create -s -V 10T -o volblocksize=16k -o compression=lz4 nvme/iserZFS – iSER | MB/s | IOPS |
4k-50rdpct-80randompct | 56.75 MB/s | 14525.60 |
8k-75rdpct-80randompct | 174.89 MB/s | 22385.60 |
64k-75rdpct-80randompct | 384.76 MB/s | 6156.20 |
4k-0rdpct-100randompct | 28.73 MB/s | 7355.00 |
4k-100rdpct-100randompct | 200.54 MB/s | 51337.80 |
NVMe-oF:
From the Linux side:
In addition to the banal installation of SPDK (https://spdk.io/doc/getting_started.html), there is 1 caveat. At the time of writing, SPDK from the wizard does not work with VMware due to the implementation of a check for the responder_resources == 0 parameter. On the VMware side, this parameter is equal to 1 (https://github.com/spdk/spdk/issues/3115). Therefore it is necessary to build version 23.05.x, so the spdk installation process will not start from – fixed in c8b9bba
git clone https://github.com/spdk/spdk --recursive
modprobe nvme-rdma
modprobe rdma_ucm
modprobe rdma_cm
scripts/setup.sh
screen - либо другая сессия, либо можно написать демона, который будет запускать его сам
build/bin/nvmf_tgt
ctrl+a d - отключение от сессии screen и возврат в консоль
scripts/rpc.py nvmf_create_transport -t RDMA -u 8192 -i 131072 -c 8192
scripts/rpc.py nvmf_create_subsystem nqn.2016-06.io.spdk:cnode1 -a -s SPDK00000000000001 -d SPDK_Controller
scripts/rpc.py bdev_aio_create /dev/md0 md0
scripts/rpc.py nvmf_subsystem_add_ns nqn.2016-06.io.spdk:cnode1 md0
scripts/rpc.py nvmf_subsystem_add_listener nqn.2016-06.io.spdk:cnode1 -t rdma -a 10.20.0.1 -s 4420
scripts/rpc.py nvmf_subsystem_add_listener nqn.2016-06.io.spdk:cnode1 -t rdma -a 10.20.0.5 -s 4420
From the VMware side:
esxcli system module parameters set -m nmlx4_core -p “enable_rocev2=1” (otherwise there will be an error “Underlying device does not support requested gid/RoCE type.”)
Then the VMware NVME over RDMA Storage Adapter is created on the web, in the controller the IP address of the VM specified earlier is set in the port field – port 4420
The performance of mdadm with the FIO tests from the first part on 1 VM is as follows:
mdadm raid0 1VM | MB/s | IOPS |
Sequential recording 4M qd=32 | 4593.00 MB/s | 1095.55 |
Sequential reading 4M qd=32 | 4618.00 MB/s | 1101.67 |
Random recording 4k qd=128 jobs=16 | 542.00 MB/s | 132417.04 |
Random reading 4k qd=128 jobs=16 | 575.50 MB/s | 140674.20 |
Random recording 4k qd=1 fsync=1 | 61.50 MB/s | 15013.28 |
Random reading 4k qd=1 fsync=1 | 30.35 MB/s | 7418.52 |
The final graph looks like this:

MDADM
mdadm --create --verbose /dev/md0 --level=0 --raid-devices=6 /dev/nvme0n1 /dev/nvme1n1 /dev/nvme2n1 /dev/nvme3n1 /dev/nvme4n1 /dev/nvme5n1mdadm – NVMe-oF | MB/s | IOPS |
4k-50rdpct-80randompct | 570.59 MB/s | 146070.90 |
8k-75rdpct-80randompct | 1113.46 MB/s | 142522.10 |
64k-75rdpct-80randompct | 5775.06 MB/s | 92401.00 |
4k-0rdpct-100randompct | 593.87 MB/s | 152033.00 |
4k-100rdpct-100randompct | 540.54 MB/s | 138378.60 |
LVM
lvcreate -i6 -I64 --type stripe -l 100%VG -n lvm_stripe stripeLVM – NVMe-oF | MB/s | IOPS |
4k-50rdpct-80randompct | 596.39 MB/s | 152675.70 |
8k-75rdpct-80randompct | 1160.72 MB/s | 148572.30 |
64k-75rdpct-80randompct | 5826.39 MB/s | 93222.20 |
4k-0rdpct-100randompct | 618.22 MB/s | 158267.10 |
4k-100rdpct-100randompct | 559.45 MB/s | 143219.80 |
ZFS
v1 (without dedup)
zpool create -o ashift=12 -O compression=lz4 -O atime=off -O recordsize=128k nvme /dev/nvme0n1 /dev/nvme1n1 /dev/nvme2n1 /dev/nvme3n1 /dev/nvme4n1 /dev/nvme5n1 zfs create -s -V 10T -o volblocksize=16k -o compression=lz4 nvme/iserNVMe-oF ZFS | MB/s | IOPS |
4k-50rdpct-80randompct | 131.18 MB/s | 33585.30 |
8k-75rdpct-80randompct | 344.21 MB/s | 44057.10 |
64k-75rdpct-80randompct | 1409.13 MB/s | 22546.10 |
4k-0rdpct-100randompct | 78.63 MB/s | 20129.20 |
4k-100rdpct-100randompct | 267.21 MB/s | 68406.10 |
v2 (with dedup)
zpool create -o ashift=12 -O compression=lz4 -O atime=off -O dedup=on -O recordsize=128k nvme /dev/nvme0n1 /dev/nvme1n1 /dev/nvme2n1 /dev/nvme3n1 /dev/nvme4n1 /dev/nvme5n1 zfs create -s -V 10T -o volblocksize=16k -o compression=lz4 nvme/iserNVMe-oF ZFS (dedup) | MB/s | IOPS |
4k-50rdpct-80randompct | 56.1 MB/s | 14362.50 |
8k-75rdpct-80randompct | 183.32 MB/s | 23464.70 |
64k-75rdpct-80randompct | 355.83 MB/s | 5693.00 |
4k-0rdpct-100randompct | 28.07 MB/s | 7185.10 |
4k-100rdpct-100randompct | 211.7 MB/s | 54195.40 |
Conclusion
LVM shows the highest results, so if we take it as 100%, the test results will look like this:
iSER | LVM | mdadm | ZFS | ZFS dedup |
4k-50rdpct-80randompct | 100.00% | 94.65% | 25.62% | 11.04% |
8k-75rdpct-80randompct | 100.00% | 98.37% | 35.87% | 18.27% |
64k-75rdpct-80randompct | 100.00% | 92.86% | 38.23% | 10.37% |
4k-0rdpct-100randompct | 100.00% | 92.39% | 15.08% | 5.36% |
4k-100rdpct-100randompct | 100.00% | 95.74% | 49.74% | 39.68% |
NVMe-oF | LVM | mdadm | ZFS | ZFS dedup |
4k-50rdpct-80randompct | 100.00% | 95.67% | 22.00% | 9.41% |
8k-75rdpct-80randompct | 100.00% | 95.93% | 29.65% | 15.79% |
64k-75rdpct-80randompct | 100.00% | 99.12% | 24.19% | 6.11% |
4k-0rdpct-100randompct | 100.00% | 96.06% | 12.72% | 4.54% |
4k-100rdpct-100randompct | 100.00% | 96.62% | 47.76% | 37.84% |
ZFS, as expected, does not show the best results, but this is also due to the CPU load, but in general this is influenced by the fact that ZFS is not suitable for fast work with NVMe.
All test results are available here And excel spreadsheet here (yes, all the tables are in the archive, since Google sheets break the formulas).
The graph of all tests grouped by the connection protocol used is as follows:


Graph of all tests grouped by software raid used


PS If you think that these tests are incomplete, something is missing in them or they are incorrect, I am open to any suggestions to supplement them.