Sentiment Analysis to Improve User Experience
In this article, I'll discuss how you can use the power of Natural Language Processing (NLP) to analyze reviews collected from an AppStore application. I'm exploring how each review, containing date, title, text, and user rating, can be converted into valuable data to train a sentiment analysis model. This model will be able to classify reviews as positive, negative or neutral, giving us deep insight into the emotional tone of user opinions.
Understanding the sentiment of reviews is of great importance for business, marketing and strategic planning, as it allows companies to better respond to customer needs and expectations. Join me on this journey through the world of NLP as I unlock the power of machine learning to improve customer experience and optimize business processes.

Let's take a step-by-step look at how different models can be used to deeply analyze reviews of the ChatGPT app in the AppStore and accurately determine their sentiment.
As part of the research, I used a number of advanced machine learning and natural language processing libraries, including: Naive Bayes, Linear Regression, Logistic Regression, SVM (Support Vector Machine), Decision Tree, XGBoost and CatBoost.
In addition to traditional methods, my work has included the use of neural networks and transformers, which are fundamental tools for a wide range of machine learning problems. These models, especially transformers such as BERT and RoBERTa, have proven to be extremely powerful in NLP tasks due to their unique architecture that can efficiently process large volumes of data. Information processing was carried out using high-performance GPUs and CPUs, which significantly accelerated calculations and increased the efficiency of model training.
To analyze and visualize the data, I used Jupyter Notebook, a user-friendly environment that allows you to run code, visualize results, and share findings in an interactive format.
In this part I want to tell you how I prepared the data for machine learning.
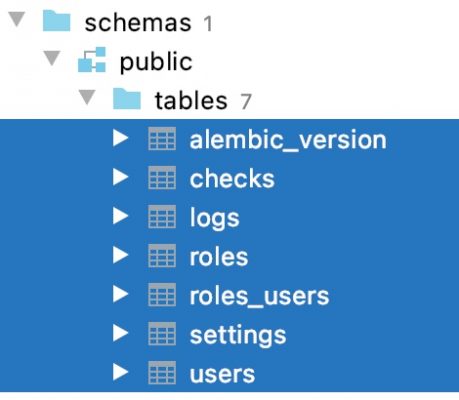
Loading a dataset
Let's look at the data:
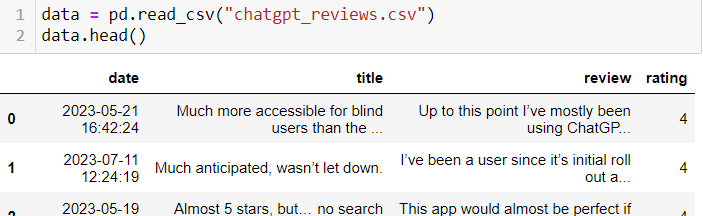
Our analysis will be based on a review table structured into four key columns: publication date, review title, review content, and user rating. This data provides us with a rich source of information for in-depth sentiment analysis, allowing us to classify reviews into positive, negative and neutral, providing valuable insight into public perception and user experience.
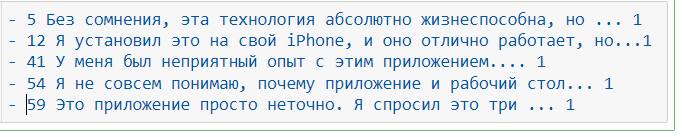
Let's look at the rating:

Data analysis shows that review ratings span a wide range from 6.06 to 49.48, reflecting the wide range of user experiences and ratings of our product.
Let's look at the classes:
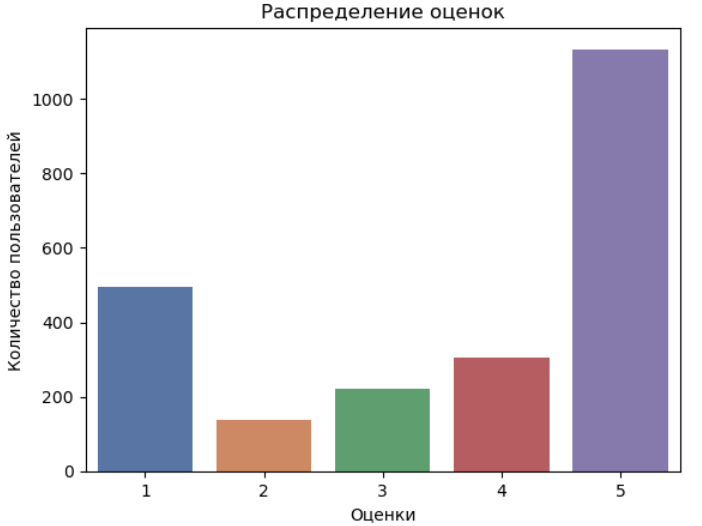
We also see that we have five classes of reviews.
Let's do the coding:
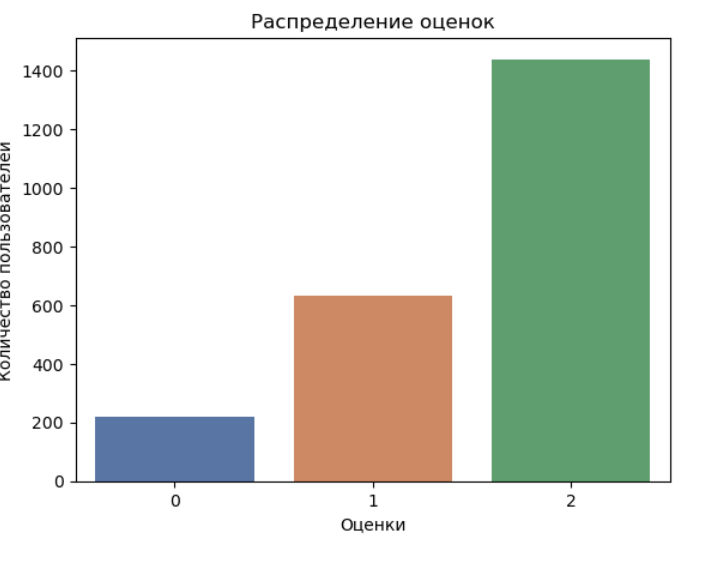
We encode the classes into positive, negative and neutral. Note: we see that the classes are not balanced.
Let's see what we've got – let's select classes:

Let's select all examples with a positive class.
Let's select all examples with a negative class.
Before moving to ML, the text must be preprocessed.
Tokenization
Let's create and apply a tokenizer to each review in the dataset:
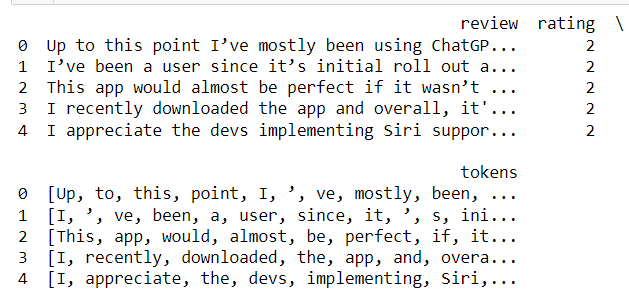
Let's see how the tokenizer works and how it divides the text into its component parts.
Theoretical information. A tokenizer is needed to break text into individual words and punctuation marks. It uses a regular expression to find boundaries between words and characters.
Let's find and expand the list of stops – with words:

Let's look at the top 10 most frequently occurring words.
Theoretical background: Stop words are words that are often found in the text and do not carry significant information.
Conclusion. The purpose of these actions is to prepare texts for further analysis.
Let's normalize words using a stemmer for the English language.

Theoretical background: Word normalization is the process of reducing words to their base form. This is an important step in preprocessing text data, especially when working with natural language.

Let's split the collected data into train/test, setting aside 20% of observations for testing.

This will allow us to evaluate how well our model will perform on new data that it has not seen before.
Let's apply tf-idf transformation for the text description.

Let's look at the first 10 lines.
We see that the text data has been converted to numeric values.
Theoretical background: TF-IDF is a statistical measure that is used to evaluate the importance of a word in the context of a document that is part of a document collection or corpus. TF-IDF is high if a word occurs frequently in a document but rarely in other documents, meaning that it characterizes the document. TF-IDF is low if a word appears frequently in many documents, meaning it is not document specific.
Evaluating Linear Models
1. Evaluation of the accuracy of the logistic regression classifier
2. Assessing the accuracy of linear regression using the RMSE metric

1. Values: Precision, Recall, F1-measure indicate moderate accuracy of the logistic regression model.
2. RMSE (Root Mean Squared Error) – the “root mean squared error” of linear regression – shows how well the model predicts the target variable compared to the actual values. The RMSE value of 0.6657626243604827 indicates the average prediction error within this scale.
We evaluate various models
We compare and evaluate the quality of six models: Naive Bayes, Logistic Regression
SVM (Support Vector Machines), Decision Tree, XGBoost, CatBoost.
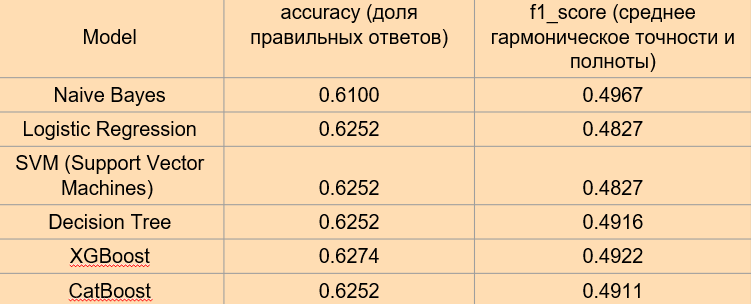
Conclusions:
Naive Bayes: With the lowest accuracy of 0.6100 and F1-score of 0.4967, Naive Bayes shows limited performance compared to the other models reviewed.
Linear Regression: With an RMSE of 0.6658, this model is applicable in the context of regression, but its performance is not comparable to classification metrics such as accuracy and F1-score.
Logistic Regression, Support Vector Machine (SVM) and Decision Tree: All three models show a similar accuracy of 0.6253, but differ in the F1 score, where Decision Tree stands out with a higher score.
XGBoost: Outperforms other models with an accuracy of 0.6275 and an F1-score of 0.4922, indicating its effectiveness in classification.
CatBoost: Shows results comparable to Logistic Regression, SVM and Decision Tree in both accuracy and F1-score.
General conclusion:
From the analysis it follows that XGBoost stands out as the most preferred model in terms of accuracy and F1-score. However, given the small differences in performance between models, the choice may depend on the specifics of the task and the importance of certain metrics. In scenarios where it is critical to minimize false positives and false negatives, special attention should be paid to the F1 score, where XGBoost also shows strong results. This highlights the importance of a holistic approach to model selection based on the goals and requirements of a particular study or application.
As part of our research, I use modern models for sentiment analysis
BERT (Bidirectional Encoder Representations from Transformers): a model that uses transformer mechanisms to analyze the context of words in the text of reviews. It takes into account bidirectional context, which allows you to better understand the meaning and emotional connotation of each word in a sentence.

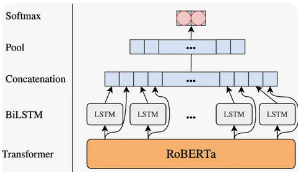
RoBERTa: This is an improved version of BERT, optimized for better context understanding and text classification.

Consider BERT (Bidirectional Encoder Representations from Transformers):
Tokenization & Formatting

In this section, we convert the data to the format that BERT works with.
Model training
I'm using the `BertForSequenceClassification` class, which is a pre-trained BERT model with a classification layer added. This layer allows the model to classify reviews into positive, negative and neutral.
Let's look at training and performance metrics to evaluate the effectiveness of the model.

Conclusions:
Accuracy measures the proportion of correctly classified examples out of the total number of examples. This is a metric that evaluates how well a model is able to correctly predict classes of data.
A decrease in accuracy on validation data (Valid. Accur.) with each epoch indicates model overfitting.
Overfitting occurs when a model becomes too specialized in the training data and begins to “memorize” it, causing its ability to generalize information to new, unknown data to deteriorate. This can lead to the fact that the accuracy on the validation data begins to fall or even stops at a certain level, which is a sign of overfitting.
The lowest value of loss on validation data (Valid. Loss) at the third epoch, equal to 0.54, indicates that the model has achieved the best balance between training and validation at this stage. This means that the model begins to generalize information well to new data that was not used in the training process, which is a key indicator of good model performance.
Let's look at the graph “Training error” and “Validation error”.

Based on the graph, it can be seen that the third epoch is the most optimal for the model, since it has the lowest validation loss (0.541262) and the highest accuracy on the validation dataset (0.783854). This indicates that the model generalizes well and does not overfit – unlike the fourth epoch, where, despite the decrease in losses on the training set, the validation loss increases, which may be a sign of the beginning of overfitting.
Conclusion:
By analyzing the model's training results across epochs, we can conclude that the model achieved the best balance between learning and generalization ability in the third epoch.
Let's estimate the MCC metric
Let's take as a metric Correlation coefficient Matthews correlation coefficient, abbreviated as MCC.

Conclusion:
After carefully preparing the test data, we used the retrained model to generate predictions. To assess the quality of the model, the Matthews Correlation Coefficient (MCC) was chosen, which is a reliable metric in conditions of unbalanced classes. The resulting MCC value of 0.721 indicates the high quality of the model’s predictions. This value indicates a strong correlation between the predicted and actual classes, which confirms the effectiveness of the model and its potential in solving the given classification problem. Thus, the retrained model demonstrates excellent results and can be used for further data analysis or in real applications.
The RoBERTa (Robustly Optimized BERT Pretraining Approach) model is a modification of the BERT model developed by Facebook AI:
Tokenization & Formatting
To feed text into Roberta, you need to split it into tokens, and then encode the tokens with their ordinal indices in the dictionary.
Model training
Once the data was successfully formatted to match the model input requirements, I moved on to the training phase. For this purpose, the RoBERTaForSequenceClassification model was chosen, which is the RoBERTa architecture supplemented with a linear classification layer. This layer extends the base model, allowing it to perform sequence classification tasks such as determining the sentiment of text.
Let's look at training and performance metrics to evaluate the effectiveness of the model.

Conclusions:
Training Loss: Gradually decreases with each epoch, which is a good sign. This means that the model continues to learn and improve its parameters to better predict classes from the training data.
Loss on validation data (Valid. Loss): first decreases, but then begins to increase, which may indicate the beginning of model retraining. This occurs when the model begins to “memorize” the training data, causing its ability to generalize to new, previously unseen data to deteriorate.
Accuracy on validation data (Valid. Accur.): increases with each epoch, which is a good sign. This means that the model continues to improve its ability to predict classes on the validation data.
Based on these data, it can be assumed that the model reached its optimal learning state around the second epoch, when the loss on the validation data began to increase while the accuracy on the validation data continued to improve. This indicates that the model may begin to overfit
Let's look at the graph “Training error” and “Validation error”.

Analyzing the metrics by epoch, we see that the second epoch shows the best results in terms of the balance between losses on the training and validation datasets and validation accuracy. Although the third epoch demonstrates the highest validation accuracy (0.760417), an increase in validation losses compared to the second epoch may indicate the onset of overfitting. At the same time, the fourth epoch, despite the lowest training losses, shows an increase in validation losses and a decrease in validation accuracy compared to the third epoch, which may also be a sign of overfitting.
Therefore, the second epoch is the optimal training stopping point because it provides the best trade-off between training and validation, minimizing the risk of overfitting and maximizing the generalization ability of the model.
Let's estimate the MCC metric
Let's take as a metric Correlation coefficient Matthews correlation coefficient, abbreviated as MCC.

Conclusion:
After the test data was carefully prepared, we used the pretrained RoBERTa model to generate predictions. The key metric for assessing model quality was the Matthews Correlation Coefficient (MCC), which is particularly suitable for scenarios with unbalanced classes. The MCC value of 0.736 indicates a high degree of correlation between the predicted and actual values, which indicates significant accuracy and reliability of the model in classification tasks. This result highlights the effectiveness of retraining the RoBERTa model and its applicability for data analysis in conditions where class balance is a critical factor.
Conclusions from the study:
Dear readers, our research work presented an in-depth comparative analysis between classical machine learning methods and innovative language models. Traditional approaches such as logistic regression and decision trees continue to prove themselves to be reliable and accessible tools. However, they often cannot compete with more modern methods in terms of accuracy and complexity of data processing.
On the other hand, advanced language models based on transformer architectures, in particular RoBERTa, have demonstrated significant success in solving natural language processing problems. With the ability to efficiently process large data sets and deeply understand linguistic context, these models not only improve text classification accuracy, but also open new horizons for natural language analysis and generation.
The results of our research clearly confirm that modern language models are powerful tools for data analysis, and they have the potential to become the foundation for future innovations in the field of machine learning and artificial intelligence.
Thank you for your attention and interest in my work!