Remote Console for tracing web applications
I have a lot of respect for the debugger – it makes it possible to better understand the code you are working with. Even if you yourself wrote this code. But the debugger is a very low-level tool, often tracing the progress of the web application (logging) is enough. The easiest way to log is console.log(). It allows you to print a message to the browser console (DevTools by F12 in Chrome). But what if the application is running in an environment where the developer console is not available? For example, in the client’s mobile device?
The answer is obvious – redirect the output from the browser console to where the developer can see the logs. Fortunately, JavaScript allows you to do this very simply, just insert the following fragment into the HEAD of the HTML file:
<script>
const orig = console.log;
console.log = function () {
    orig.apply(console, arguments);
    navigator.sendBeacon(URL, arguments[0]);
};
</script>
I use Beacon APIbecause it is just designed for this kind of action – sending messages to the server by the client without waiting for a response from the server (unlike Fetch APIwaiting for a response).
Now all web application console messages will also be sent to some server that can save them to a file, to a database, output them to the console, redirect them somewhere else, etc. The rest of the web application code remained unchanged.
Since I am a web application developer myself, it is convenient for me to have the logs displayed in my browser. This is how something comes from the client to the server, so that the server immediately redirects it to me, the developer (or better, several developers at once). This requires something like WebSockets or Server Sent Events.
As a result, the following scheme of interaction of everything emerges:
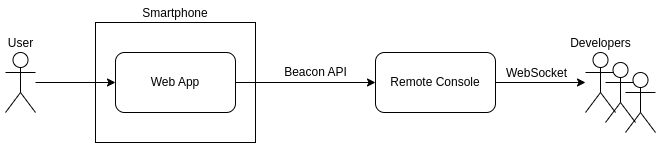
As a result, all messages that the client browser sends to the Remote Console (server) are redirected in real time to all developers who are currently connected to it:

I made a nodejs application (flancer64/spa-remote-console) and deployed it to console.wiredgeese.com. This is a public server without any restrictions, for testing purposes. All logs that are uploaded to this address will be available to everyone who is currently connected as a developer:
navigator.sendBeacon('https://console.wiredgeese.com/log/', 'any log message');To ensure privacy, I raise my own remote console on my local:
$ git clone https://github.com/flancer64/spa-remote-console.git
$ cd spa-remote-console/
$ npm install
$ npm start
By default, the server uses port 8080, but it can be overridden in the configuration file or through a startup parameter. In this case, the remote console will only be available locally (or on a local network).
In general, the server is designed in such a way that it receives and retransmits any text information sent via POST to the address ./log/. Therefore, you can use not only the Beacon API, but also the Fetch API and any other method, up to telnet.
PS
Yes, I am aware that there are advanced methods monitoring And debugginglike the advanced logging systems. But it’s convenient for me like this – without registration, without wires, without a bunch of settings. Connected as a developer to a remote console, redirected logging from the client – and read-analyze the logs.
Thanks to everyone who read and happy coding, as they say!