Quick collection of test metrics and display in Grafana
Yes, again an article about Grafana and visualization of test metrics.
Your autotests are integrated into CI and there is a TMS (Test Management System) nearby, such as Allure, qase, and so on, where you / your team store test cases, checklists and run results. Based on the test results, graphs are built, numbers are drawn, and so on. But how often do you look at these results? Show to developers, managers? Are these numbers enough or do you want more?
I don’t. I have worked with different TMS and local dashboards have been or are a pain for me. Yes, everything is beautiful, but they didn’t let me do something of their own (or they did, but very poorly). We had to make our own reports, calculate our own metrics, but there was no single entry point to see all this (and I still don’t understand why). Our company had:
test reports in TMS
custom API coverage report
custom load report (your own solution)
report in GitLab pages
state of tests in telegram
Yes, part of the metric can display TMS, but it will not work to do it all in one place. Therefore, we paid attention to Grafana (the idea came a long time ago, but Igor’s article was prompted by the link).
Task
Collect test results (total number, number of passed/failed tests, etc.) and display them in Grafana.
What will we use?
supabase: online database with rest api. Although what to use in this paragraph is not particularly important, you can use your database or Prometeus and so on
grafana: to display results
any popular programming language in which tests are written
supabase
supabase is a relational database using SQL syntax.
Register a new user, choose a free plan.
Create a new database (project)
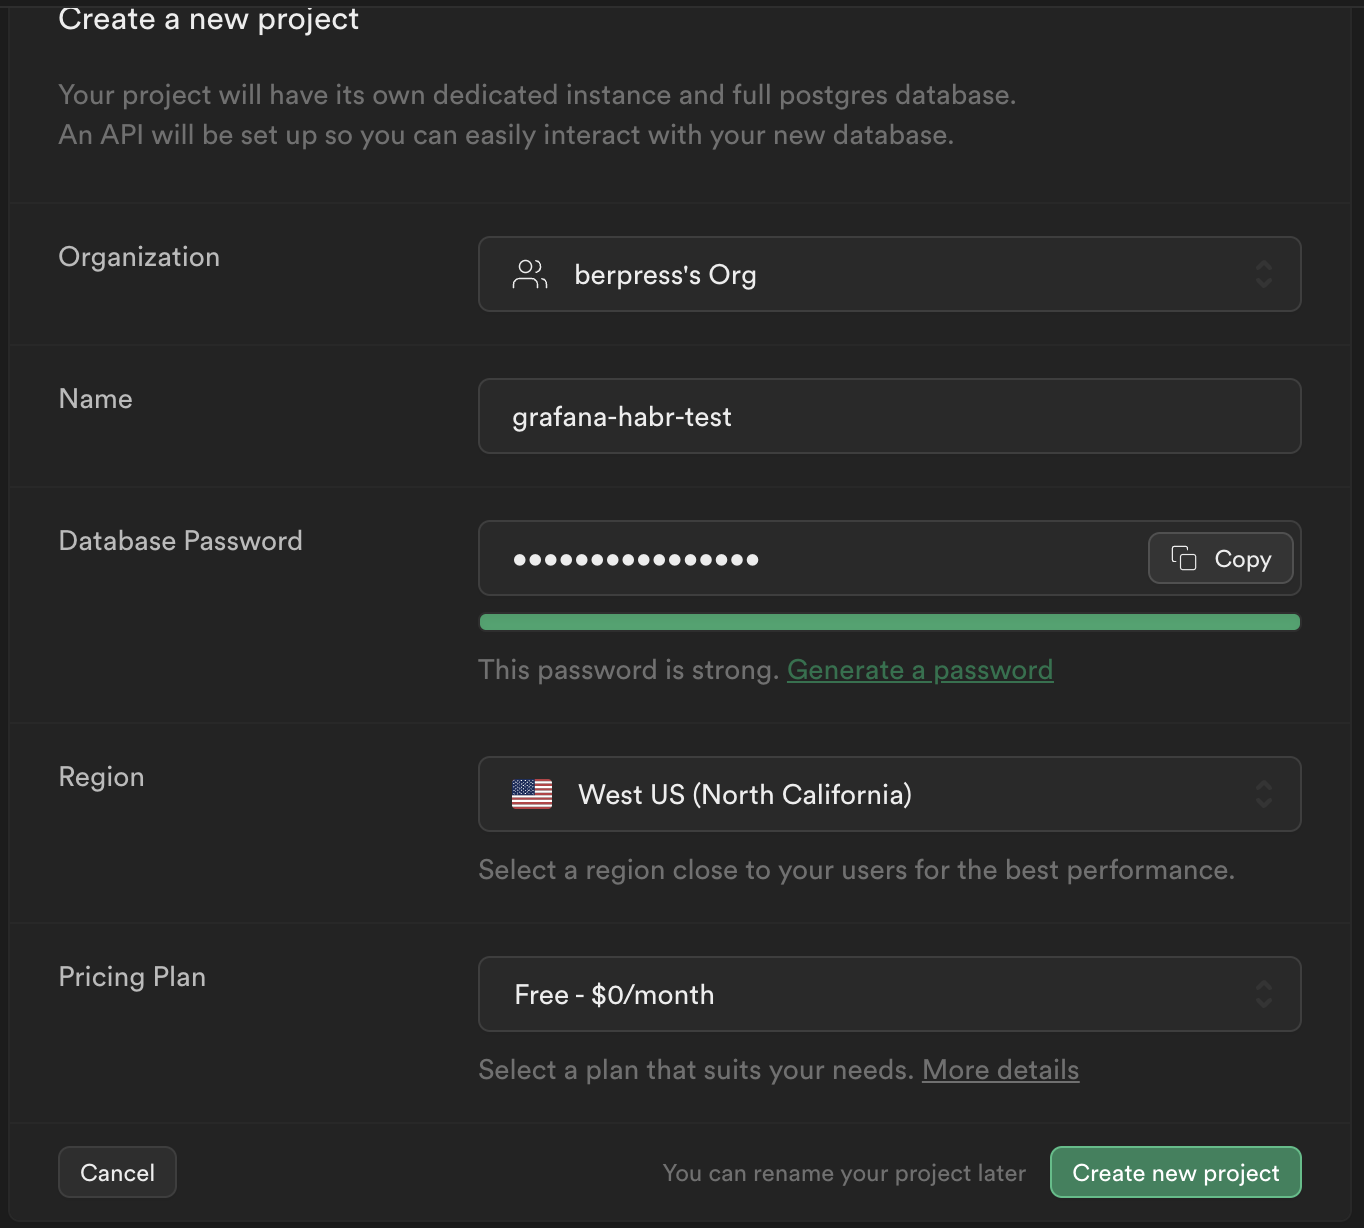
Don’t forget to copy your password!
Since this article is about metrics, we will not deal with normalization, we will create one large table with the following fields:

Where will we store results of our runs.
After we have created the tables, we go to the settings. We are interested in url and secret.

Tests
First, let’s collect our metrics, which we will send.
To collect test results, see the documentation for your test frameworks, for example, for js/ts playwright it would be reporterfor python test it would be hooks pytest.
At the very end, I will provide a link to the Python test and statistics collection repository.
And the last thing: we need to send data to our database. There are two ways to do this:
Find an official client for your language, e.g. python or js.
Send requests without wrappers, since our database is available through the rest api. The only thing you need to add a value to the header (except SUPABASE_KEY),
"Prefer": "return=representation"so that we receive a non-empty body response to the request.
See examples in supabase tables

SUPABASE_KEY is in the settings.
The body for the request must be filled according to the names of the columns in the table, for example:
body = {'total': 100, 'passed': 99 ...}Grafana
Download docker image
Run locally (admin/admin access)
docker run -d --name=grafana -p 3000:3000 grafana/grafanaIn the settings we find Data sources

Add host + port, database, user and password. Basic settings need to be taken in supabase

password is the password you specified when creating the database. We check that the connection to the database is working.
We return to the tests and start the run.
Checking our database. It will look something like this:

Now we return to grafana and create a simple dashboard, specify our previously created data source, select a table test and specify the fields to be displayed.

That’s all! Now it remains to add tables and fill them with the data that you are going to display. In our projects, we follow
test time
data from TMS (pull through api)
API test coverage. For coverage measurement use
query time (looking for slow queries)
other test metrics
Python test case https://github.com/berpress/python-api-tests-grafana