“Polarization” of machine vision instead of convolutional neural networks and how my map generator differs from Bresenham’s algorithm

This publication serves as explanatory material to the previous one, as well as independent for those who read my publications on this topic for the first time.
First, about what algorithm I plan to replace convolutional neural networks in my work. For this to work quickly, trace maps are needed. Tracing lines on the map are parallel at a certain angle on each map – this is how conditional polarization occurs. The map generator is fast and generates trace maps directed by straight lines, it marks the break of each line in the data. That is, first the map generator is launched and generates a picture, this animation differs significantly from the operation of the generator and shows only its TK – in each pixel of the map, write down the coordinates of the next pixel and indicate the end of each line in the data. The images I took are small, but nevertheless the animation files are quite weighty. Let’s say that the processed images will be 7 * 7 pixels, and there are only four trace maps, then the TK of the generator will approximately look like this, but in fact its algorithm is much more complicated and works much faster – it practically does not count anything and produces large amounts of data automatically, but more on that later, but for now it’s purely visual

There are four layers – four maps, the trace lines of different maps are located at 45 degree intervals. The generator code itself can still be from 0-90 for any size of processed images, but with a limit on the height of the image – at least three pixels, since I inserted my own formula from mathematical logic instead of the block for checking if conditions – it’s easier and faster. It was possible with the Bresenham algorithm, but for the task at hand it is absolutely autistic – slow. Below I will analyze the algorithm of my generator, but for now, about the replacement algorithm for convolutional neural networks.
The image processing algorithm follows the pixels according to the map traces, where it indicates the end of each line, as soon as the corresponding pixel is colored in the desired light on the image, the algorithm on its “polarized” layer increases the weight of this pixel and increases the pixel weight of the line until it encounters an empty pixel on the image, or the line does not end, after which the weight is reset to zero. The implementation may be a little different, but the technical specification of the algorithm that reads the image is just that. Layers 1-4 are the polarized layers of the algorithm, 5 is the image.
Here are three animations of how this is rendered. Here the movement is in the opposite direction, as opposed to the algorithm generating maps.


What is a convolutional neural network in my understanding – something that defines and separates data on line sizes, intersections and formed angles.
On the example of image processing with the number 8, it can be noted that there are vertex-forming pixels that belong to lines with a large weight on different layers. The angle data in this visualization is related to the distance between the polarized layers. It’s like this, the vertex-forming pixels are crossed out –

Both are easy to calculate, for example, the vertex formation coefficient by adding the weights of a pixel on different layers, it is also not difficult to calculate the distance between the polar layers. You can add methods for calculating arcs and other meta-information, but the publication is not about perspectives and a complete list of features, but is explanatory.
Further along the map generator, tractor-like, but fast, the image is old – therefore, in dirt and dust;).

The algorithm-generator of maps records from the input pixel to which next pixel to follow the algorithm-reader. He does it this way, as if he goes from the end of the map to the beginning and writes to each pixel information about the coordinates where he just was, BUT, in fact, everything is wrong, because this method is expensive, and everything is implemented differently – line by line : no corners, but instead of a bevel, the algorithm assumes the coordinates from where it could get into the current pixel with such and such a slope of the line. Then for the whole map nothing needs to be considered absolutely, since the bevel is always the same – a step up (in machine Y coordinates, where top is bottom) and a step to the right. What then to count? There is only one right column left to count, for which the formula is very trivial, I give it not for decomposition, but for visual assessment
TracerX := RazmerX – (stepFrequent * y + znak *trunc(y / (stepsBig+1)));
and the very bottom line, here it’s much more difficult, because I whipped up what mathematical logic I could, which is much easier than being tricky with a set of operators if … else … and engage in self-removal of brains to oneself, let mathematics take out itself better
TracerX := x – ( znaksign(trunc((1+sign(y-trunc(y/(stepsBig+1))(stepsBig+1)-steps)/2))) + stepFrequent * y + znak * trunc(y / (stepBig+1)))+1;
.The complexity of calculating the last line is related to calculating the position of the changed bevel pitch and it is possible that the formula can be made more elegant and with a slightly different meaning, but I didn’t bother much, because this is a map generator, the stage so far is only operating time and debugging, and the maps themselves can be saved and use repeatedly.
Project posted here
https://github.com/Andrei-Y/A-trace-map-generator
Download folder
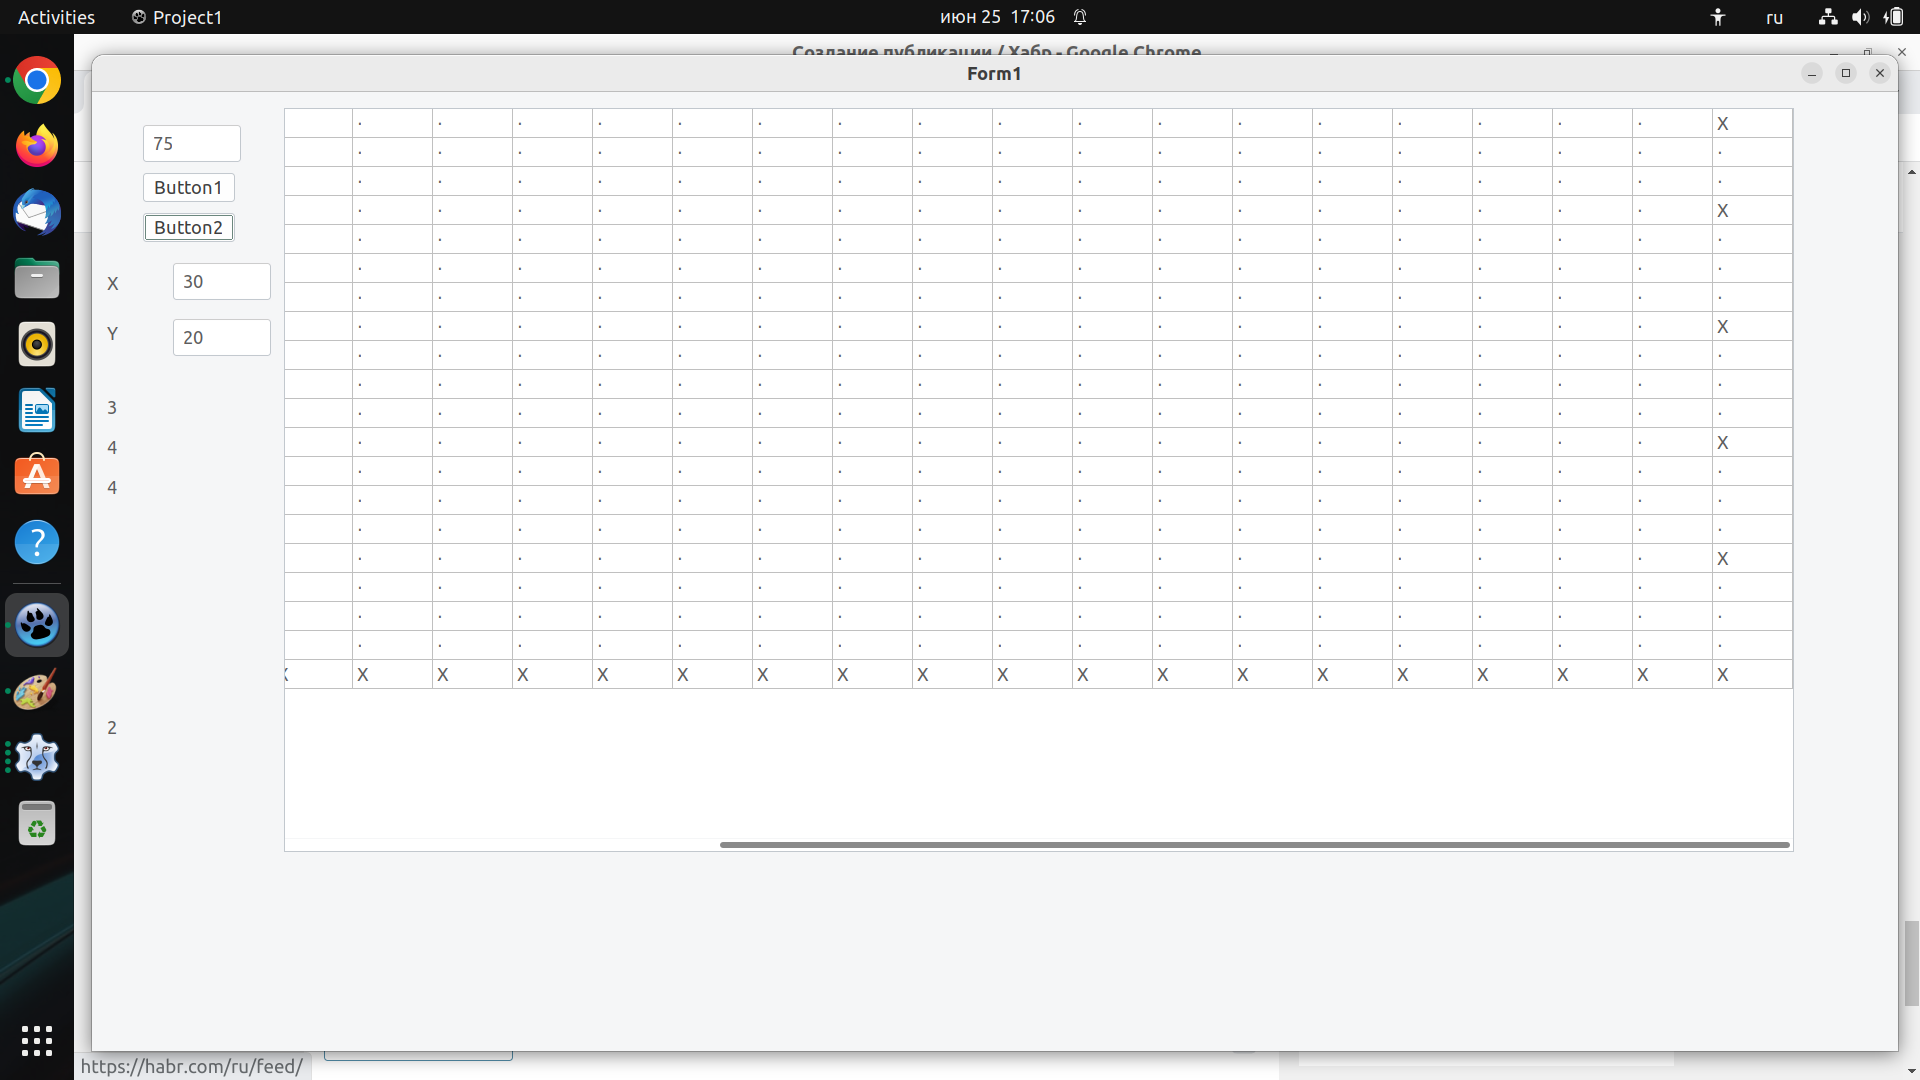
Program interface, screen with the background of the debugging table

Clicking on Button2 launches a checking algorithm that follows the coordinates recorded in the fields of the table cells (fields are separated by commas), zero in the third field means nothing, one means the end of the trace line.
The result of the work of the checking algorithm – writes points and puts a symbol X in the cell where the line breaks.
While everything. the generator did not complete the full sweep from 0 to 180 degrees, as it was distracted by explanatory material. The generator is fast, almost lightning fast, but it can also break the brain. I will give the core of the generator engine, the programming language FPC Lazarus.
          repeat
            //////////////////////////////////////////////////////////////////////////////////////////////////
            {%REGION 'Engine'}
            asm
                     JMP     p
            end;
            p1:
              StringGrid1.Cells[px^, py^] :=
                IntToStr(pTracerX^) + ',' + IntToStr(pTracerY^) + ',' + '1';
            //запись правого столбца
            p := @p3;
            goto p4;
            p2:
            x1:=x+1;
            y1:=y+1;
              StringGrid1.Cells[px^, py^] := IntToStr(px1^) + ',' + IntToStr(py1^) + ',' + '0';
            //автоматическое забивание координат в местах скоса трассы
            p := @p3;
            goto p4;
            p3:
              x1:=x+1;
              y1:=y;
              StringGrid1.Cells[px^, py^] := IntToStr(px1^) + ',' + IntToStr(py1^) + ',' + '0';
            //автоматическое забивание координат трассы на прямых участках
            p4:
              Dec(x);
            {%ENDREGION}
          until x < Biger;
I will say right away that on this code, all guardians of code etiquette will completely dislocate their brains, since this code is conceptual, it contains an idea, and it needs to be understood before understanding how it works. In C or C ++, when parallelized, this code will be even faster, it does nothing but one column and one row from the entire map anyway. Bresenham’s algorithm is not intended for the current TK. Well, actually with image processing, I expect the same effect in comparison with convolutional neural networks. The core of the engine had to change a little when moving to the interval 0-90 degrees. There will be a little more to come. The code of the engine itself is here under the spoiler, the rest of the code is in the folder at the link earlier, if someone has a desire to read and check
hidden text
    repeat
      repeat
        asm
                 JMP     logic
        end;
        logic1:
          logic := @logic2;
        goto logic4;
        logic2:
          Edge := @Edge3;
        logic := @logic3;
        logic3:
          TracerY := y - steps1;
        TracerX := 0;
        if TracerY < 0 then
        begin
          TracerX := RazmerX - (stepFrequent * y + znak *trunc(y / (stepsBig+1)));
          if TracerX < 0 then TracerX := 0;
          TracerY := 0;
        end;
        logic4:
          steps := stepsBig;
        repeat
          if steps = 0 then
          begin
            Biger := x - stepRare+1;
            steps := stepsBig+1;
          end
          else
          begin
            Biger := x - stepFrequent + 1;
          end;
          if Biger < 0 then Biger := 0;
          repeat
            //////////////////////////////////////////////////////////////////////////////////////////////////
            {%REGION 'Engine'}
            asm
                     JMP     p
            end;
            p1:
              StringGrid1.Cells[px^, py^] :=
                IntToStr(pTracerX^) + ',' + IntToStr(pTracerY^) + ',' + '1';
            //запись правого столбца
            p := @p3;
            goto p4;
            p2:
            x1:=x+1;
            y1:=y+1;
              StringGrid1.Cells[px^, py^] := IntToStr(px1^) + ',' + IntToStr(py1^) + ',' + '0';
            //автоматическое забивание координат в местах скоса трассы
            p := @p3;
            goto p4;
            p3:
              x1:=x+1;
              y1:=y;
              StringGrid1.Cells[px^, py^] := IntToStr(px1^) + ',' + IntToStr(py1^) + ',' + '0';
            //автоматическое забивание координат трассы на прямых участках
            p4:
              Dec(x);
            {%ENDREGION}
          until x < Biger;
          asm
                   JMP     Edge
          end;
          Edge1:
            //подсчёт шагов в первой строке - других расчётов для первой строки не требуется и знание этого значения нужно для последней строки
            Inc(steps1);
          goto Edge3;
          Edge2:
            //трассировку начальной ячейки каждого шага последней обрабатываемой строки кроме правого столбца
          if RazmerX > RazmerY then begin
                  Dec(steps1);
          TracerX := x - ( znak*sign(trunc((1+sign(y-trunc(y/(stepsBig+1))*(stepsBig+1)-steps)/2))) +  stepFrequent * y + znak * trunc(y / (stepsBig+1)))+1;
                                       if TracerX<1 then begin
                                       TracerY := y - steps1;
                                       TracerX := 0;
                                       if TracerY < 0 then TracerY := 0;
                                       end;
         end else begin
           Dec(steps1);
            TracerY := y - steps1;
            TracerX := 0;
          end;
          p := @p1;
          goto Edge4;
          Edge3:
            p := @p2;
          Edge4:
            Dec(steps);
        until x < 0;
        Inc(y);
        yf := y + 1;
        p := @p1;
        x := xRazmerX;
      until y > yRazmerY - 1;
      Edge := @Edge2;
    until y > yRazmerY;
I think that this explanatory material brings some clarity about how my algorithm copes with its TK without doing anything. Well, at least some replacement of bundles according to the planks. Thank you all for your attention, I think it’s clear that you shouldn’t expect quick results from me, since I do everything after work, which is very small for such things.
All the best and success.