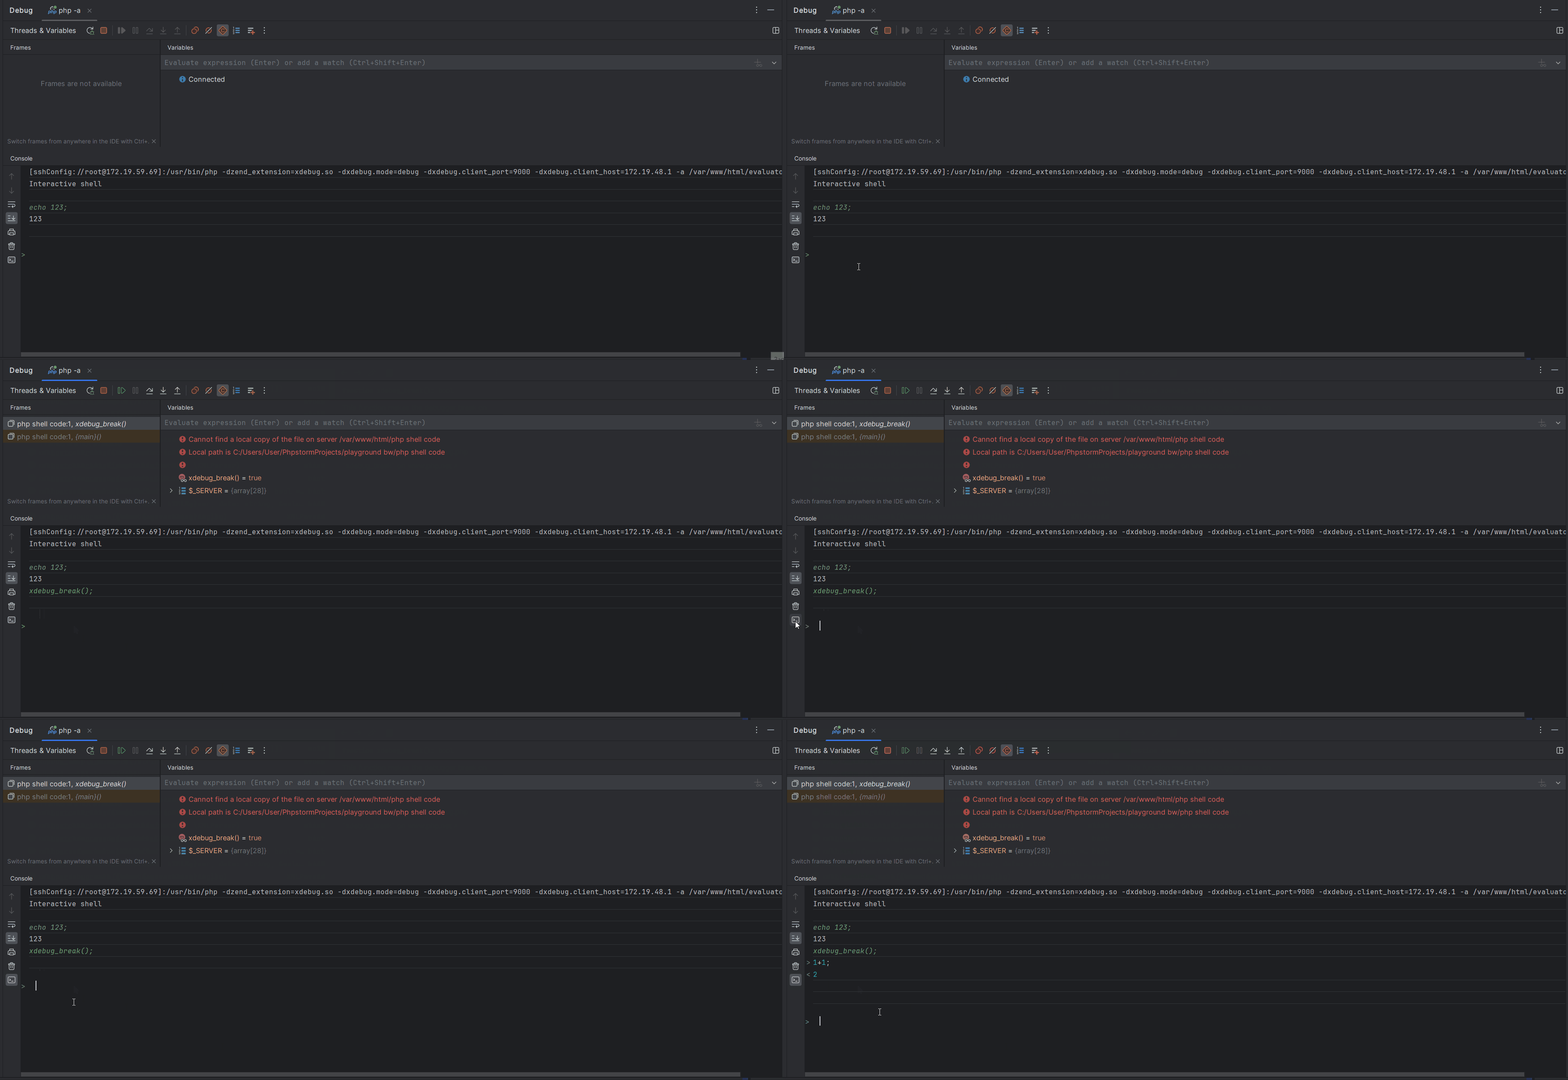
native php -a console with autocompletion from the IDE
In the previous article, I already talked about how you can use the Xdebug console as an analogue of the Python Console in Phpstorm. In the comments they asked me what is not suitable for this native php consolewhich can be called with the command php -a (Php Interactive Shell, further in the text it will just be the Php console). I then replied that it is not integrated with the IDE, and it does not have the corresponding features, such as autocompletion. However, it recently turned out that it can actually be “integrated” with Phpstorm in one clever way. The fact is that it can also be launched in debugging mode, and then it itself will act as a debugging console. And in the debugging console, autocompletion from the IDE is already available.

To start, you need to create a debugging configuration for any php file, even if it’s empty, and in the interpreter options specify the same parameter that launches the interactive console – -a. Then, in debugging mode, a non-specified file for which the configuration was created, namely the console, will be launched. It will not work if you do not specify the file; this is a required field. Also, if you do not have an interpreter connection created, then you need to create one, similar to how this is done for the Xdebug REPL, with the only difference being that it is not necessary to connect the Xdebug extension to the interpreter.

I forgot to say that the Use console input option must be disabled in the console, otherwise the commands you write will not be processed.

Comparison with Xdebug REPL
Of course, you need to take into account that this method of using Php Interactive Shell is an undocumented feature and even a crutch, and the stability of its operation is not guaranteed (for example, in some previous versions of Phpstorm, autocompletion in this console did not work). Moreover, if you compare it with the same Xdebug REPL, then the latter will have more advantages:
1) In the Php console, to display the result you need to write echo and var_dump in full, while in the Xdebug console you can simply write an expression and immediately get the result (that is, enter 1+1 and immediately get 2)
2) Every time you start the php console, you will need to reconnect your project with its libraries by manually entering the appropriate commands. In the Xdebug REPL, this can be written in the file that is used to start debugging, and as a result they will be automatically connected at startup.
3) The history of commands is not remembered (when scrolling through, only those that were entered when Use console input was enabled, that is, in the Xdebug console, will be available)
4) And of course, the Quick Evaluate Expression and Evaluate expression features will not be available.
And one more opportunity
While I was writing the article, I discovered that it is still possible to run Xdebug debugging from Php Interactive Shell, although it was believed that this does not work (for this to work, php must be at least version 8). This means that the debug console will already be the Xdebug console, that is, the advantages described above will become available (except for point 2, since debugging is not launched from a file). For debugging to run, the Xdebug extension must be connected to the interpreter. And in the console you need to enter xdebug_break();. A bug was also noticed that debugging starts if you enter a buffer management command, for example, ob_start();, ob_flush(); etc. In Xdebug 3.3, any command entered first starts Xdebug debugging. Please also note that for now you can start debugging only once per Php Interactive Shell session.

I remind you that when going to the Xdebug console, you need to enable the Use console input option again – this console, unlike the Php console, processes commands when this option is enabled.
PS The stability of the ability to launch Xdebug from Php Interactive Shell is also not guaranteed, and may stop working again in the next versions of Php or Xdebug – the Xdebug developer has not yet officially announced that the problem has been resolved. Most likely, this launch became possible thanks to changes on the Php side, especially since the Xdebug developer stated that it was precisely because of problems on the PHP side that it was not possible to launch Xdebug from the PHP console before.


