Let's dissect Wazuh. Part 2: Connecting sources
In the first article, we started looking at the open source solution Wazuh. We deployed the system in an All In One configuration, that is, all components are located on one node. In this article we will continue setting up our SIEM. Of course, after installation it is no longer completely useless, since it collects events from the operating system on which it is deployed, so if you went to the console and saw some alerts, then in general this is normal, since the events are already collected, correlations are correct are processed and alerts are created. But in industrial use, we naturally need to connect other nodes as event sources. This is what we will do today.
Sources out of the box
One of the parameters that commercial SIEM developers like to measure is the number of sources supported out of the box. Out-of-the-box support means that the SIEM “knows” this type of source. That is, the instructions for connecting the source already contain a description of a certain set of actions on the event source, as well as on the event collector from the SIEM side, after completing which you will begin to receive events from this source in a normalized form, that is, these events will already be parsed in the SIEM console across the fields.
Naturally, developers believe that the more sources their SIEM supports out of the box, the better. Although in practice it is much more important for the customer that exactly those sources that are in his infrastructure are supported.
If the source is not supported out of the box, then we will need to independently train the SIEM to parse the raw logs of our application.
But we’ll start by looking at connecting standard sources to Wazuh.
Syslog protocol
Wazuh Server can collect logs using the Syslog protocol from endpoints such as firewalls, switches, routers, and other devices that do not support installation of Wazuh agents. To configure reception using this protocol, you need to add it to the /var/ossec/etc/ossec.conf file, which is located on the main Wazuh server.
You need to add the following section to this file.
<remote>

  <connection>syslog</connection>

  <port>514</port>

  <protocol>tcp</protocol>

  <allowed-ips>192.168.2.15/24</allowed-ips>

  <local_ip>192.168.2.10</local_ip>

</remote>
Where:
<connection> – indicates the type of connection being received. In this case it is the Syslog protocol.
<port> is the port used to listen for incoming Syslog messages. In the example above, we use port 514. Although, if necessary, we can use any other port for Syslog.
<protocol> is a protocol used to listen to incoming Syslog messages. Valid values are either tcp or udp.
<allowed-ips> is the IP address or network range of sources transmitting events to the Wazuh server. In the example above we are using 192.168.2.15/24.
<local_ip> is the IP address of the Wazuh server that listens for incoming Syslog messages. In the example above we are using 192.168.2.10.
After making changes, you need to restart wazuh-manager using the command:
systemctl restart wazuh-manager
If you have a central logging server such as Syslog or Logstash, you can install the Wazuh agent on it to make log collection easier. This setup allows logs from multiple sources to be seamlessly forwarded to the Wazuh server, facilitating comprehensive analysis.
Redirecting the socket
By default, log data is sent to the Wazuh agent socket, but other sockets can also be specified as output. The log collection module uses UNIX-type sockets for communication, which allows the use of TCP or UDP protocols. One scenario where this can be useful is in inter-process communication, where you might need to redirect logs to a socket for another process to read.
You need to create a new socket on your endpoint before adding it to the Wazuh configuration file. You can create a socket using your custom application or netcat. For example, the command nc -lkU /var/run/custom.sock creates a new socket /var/run/custom.sock to which you can forward logs.
You can use the
<socket>

  <name>custom_socket</name>

  <location>/var/run/custom.sock</location>

  <mode>tcp</mode>

  <prefix>custom_syslog: </prefix>

</socket>
After making changes, also remember to restart wazuh-manager.
Agent installation
To collect events from Windows machines, we need to first install the Wazuh agent on the corresponding node. To do this we need to download the MSI package from the following link https://packages.wazuh.com/4.x/windows/wazuh-agent-4.7.3-1.msi. You can also download the installation package from the Wazuh console itself.
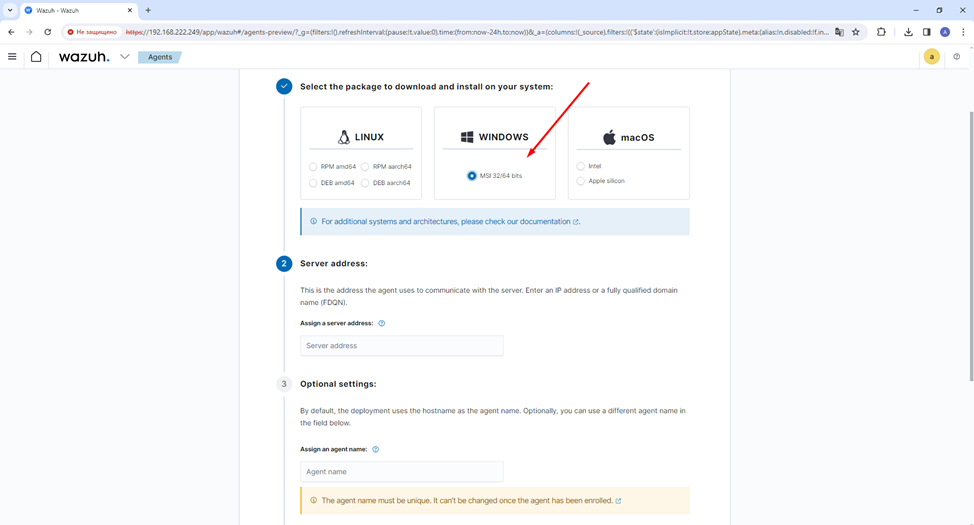
You can install the agent via the command line or through the window interface.
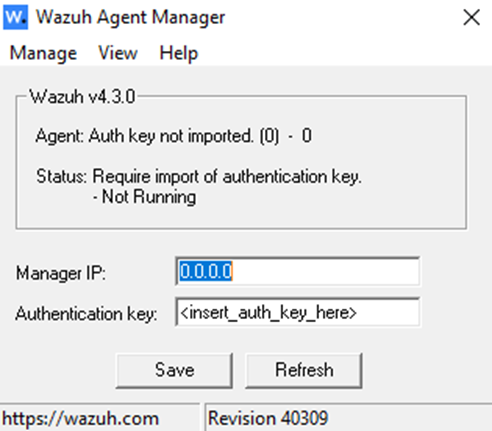
When installing on a window, the most important step is to specify the manager's server address with the appropriate authentication key.
In case of installation from the command line, we can use a simple console launch:
wazuh-agent-4.7.3-1.msi /q WAZUH_MANAGER="10.0.0.2"
Or Powershell:
.\wazuh-agent-4.7.3-1.msi /q WAZUH_MANAGER="10.0.0.2"
In fact, there are many more variables that can be passed when registering an agent. For example, there is a variable WAZUH_REGISTRATION_SERVER, the value of which can be different if necessary, but if this variable is not specified, then it is assigned the value WAZUH_MANAGER.
Next, we will consider direct collection of events from nodes running Windows OS.
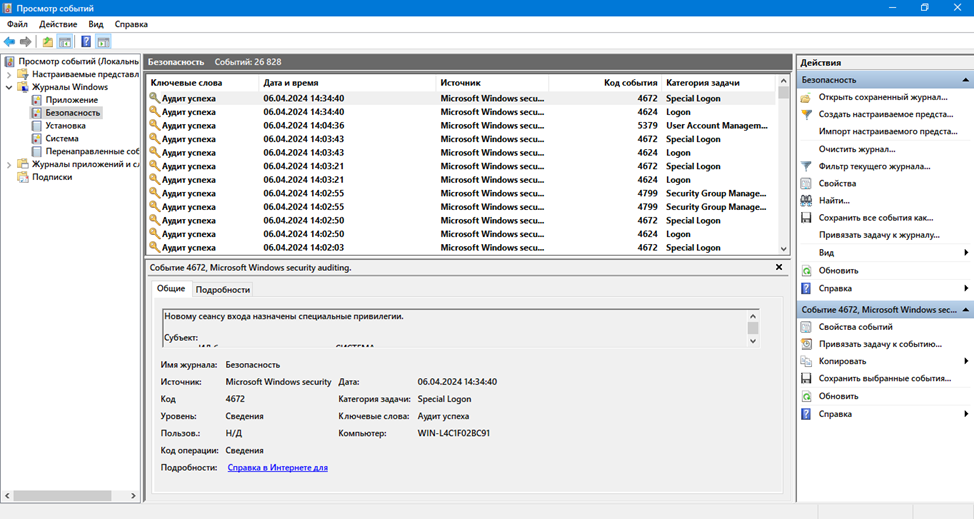
Windows Event Logs
Windows logs are descriptive messages containing information about events occurring on Windows systems. Windows Event Viewer displays events and the software, applications, or components that generate them. The Wazuh agent collects important event information such as event descriptions, standard system fields, and event-specific data. The Wazuh server parses and converts collected events into JSON format. This format makes it easy for users to query and filter different event fields.
Event channel is a log format that supports the latest versions of Windows OS. It contains application and service logs, as well as basic Windows logs, including application, security, and system logs. This log format also supports the use of queries to monitor specific Windows events. By default, Wazuh agent monitors system, application, and Windows security event channels.
You can configure Wazuh agent to monitor other Windows event channels that interest you.
To configure the collection of events from individual Windows channels using the Wazuh agent, simply specify the channel name in the location field and log_format in the localfile block of the C:\Program Files (x86)\ossec-agent\ossec.conf file. For example, follow these steps to monitor the Microsoft-Windows-PrintService/Operational channel:
<localfile>

  <location>Microsoft-Windows-PrintService/Operational</location>

  <log_format>eventchannel</log_format>

</localfile>
Next, on a Windows machine with the Wazuh agent, you need to restart the agent service.

Conclusion
In this article, we looked at connecting standard sources running Windows and Linux, but we can also events from other sources that use the Syslog protocol as transport.
Next, we will look at the general principles of connecting non-standard sources.
And now I want to recommend you a free webinar on the topic:
I also remind you that in OTUS course catalog There are a number of expert courses on information security. View the catalog.