How the reporting system for market participants works on the Moscow Exchange
“Any programmer, after a couple of minutes of reading the code, will definitely jump up and say, referring to himself: rewrite all this for nothing. Then doubt will stir in him about how long it will take, and the programmer will spend the rest of the day proving to himself that it only seems that rewriting is a lot of work. And if you take it and sit a little, then everything will work out. But the code will be beautiful and correct” (With) RSDN
Probably, many people know the feeling when it comes time to remake a well-established product. It works, it is stable, predictable and familiar, but something has changed in the air, the complexity of the tasks to be solved has grown, the infrastructure has grown, new challenges have appeared, and now we have to resolutely sit down and redo everything. In this article, we will talk about the evolution of our reporting system aka Reporter, which has come a long way over the past 15 years. I would like to boast that, despite the temptation to take and redo everything from scratch, contrary to the epigraph and thanks to a number of successful decisions, the development of the system remained evolutionary. The sections of the system responsible for the business logic of our industrial system were preserved, and this saved man-months and years of testing for other useful work.
Let’s figure out what the reports for market participants are. Tens of millions of trading orders are sent to the Moscow Exchange every day, and several million transactions are made. As a result of trading and clearing sessions, our participants receive more than two hundred reports on the results of trading, collateral evaluation, fulfillment of market maker obligations, etc. Reports are mainly trading and clearing, and, accordingly, carry information about trading or clearing. In each of our markets, they are different, although structurally they can store information of the same type. Reports are sent separately to each trading/clearing participant (including the most important of them – the Bank of Russia). At the dawn of time, reports were text files with tables drawn in pseudographics. Now these are XML files with schemas and styles in several languages. By the way, a fun fact – for historical reasons, one of our reports is still sent in pseudographics. For the sake of the habit of our clients, for whom this format is most convenient, the table rendering functionality had to be carefully carried through all the metamorphoses of the reporting system. However, let’s not get ahead of ourselves.
In the beginning (around 2008), a few reports were generated using database stored procedures (then only Firebird) and the Corel Paradox desktop DBMS. This did not last long. The fiddling with formatting pseudographics took more and more time as the number of reports grew, so we moved from pseudographics to XML. The ability to provide data separately from the presentation, although it cost additional resources to store the structure of the document in memory, greatly simplified the preparation of reports.

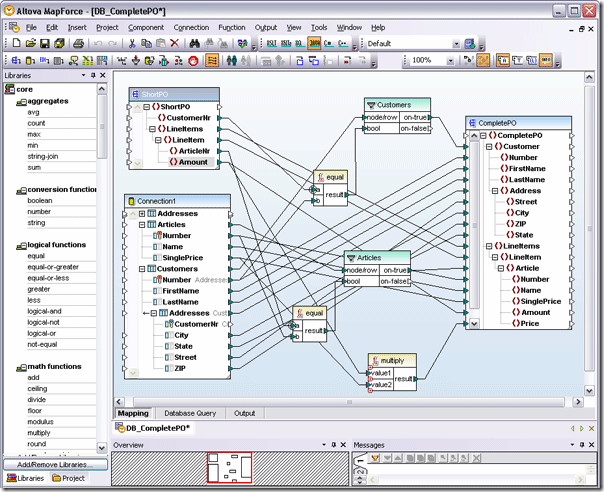
In addition to changing the format, Altova MapForce was added to Paradox to introduce a layer of abstraction when working with data. The process of preparing reports began to look something like in the picture (the diagram is not ours, but the concept is the same). Mapping data from the source to the finished report was now elegantly configured in a few mouse clicks, at least at that time. Alas, time passed, the family of reports continued to grow, the database data structure became more complex, and the entropy did not decrease. Finally, the day came when it became clear that the graphical approach to the formation of mapping has exhausted itself. It became difficult for the naked human eye to cope with the chaos on the screen, after which we made another evolutionary transition.
Stylish graphical mapping had to be shelved in favor of ease of editing and code reuse. Mapping itself, business logic and related calculations were transferred to *.scx script files. Looking back, the decision turned out to be extremely successful. The ease of editing the script and the simple but flexible formulaic language implemented a little later made it possible to save the business logic of generating reports in the future with significant modifications to other parts of the system. The scripts were supplemented with an interface for working with the database (still only Firebird), written in Delphi, which was wrapped in a separate dll. It also packed the functionality for generating output data in XML. Simple bash wrappers were written around .scx files so that call parameters could be set. Wrappers are used for debugging and testing, as well as a fallback reporting option in case of failure of any auxiliary systems.
In this form, the system turned out to be very convenient. Both the flexibility of Paradox and the architectural improvements made have an effect here. Relatively cloudless Reporter spent the next few years. During them, interfaces for working with Oracle and MS SQL were added to the DLL API, to solve a number of local tasks, it became possible to generate reports not only in XML, but also in CSV. Multiple local optimizations of *.scx scripts were carried out. As part of the experiments to improve and develop the system, the already mentioned formulaic language was formed, but, in general, the concept of the system did not undergo changes.

For several years of stability, the number of reports has doubled, and trading volumes have also grown. Our trading and clearing system (then called ASTS), responding to the challenges of the times, constantly improved its performance (you can read more about this in our previous articles). The Reporter also tried to keep up with her. Problems began to appear, caused by the fact that the system, in fact, was a client application on the working machine of the employee (broker) responsible for the preparation of reports. The fact is that as the number of applications and transactions grew, at some point the size of xml files began to reach several gigabytes and the time for preparing reports ceased to fit within the framework established by the regulations. One machine is good, but three is better – we thought and parallelized the procedure for preparing reports. Looking ahead, it turned out to be a road to nowhere. For distributed groups of bidders, reports were generated on 3, then 4, then 6 cars. This speeded up the preparation process, but greatly complicated the broker’s life. Without going into details, now he was required to thoughtfully, with awareness of all the risks, with his eyes and hands to control the parallel process of preparing reports in 6 terminal tabs.
It was impossible to live like this. Brokers needed to be rescued, especially as the number of reports and orders/deals continued to grow. The back office team undertook to write a multi-threaded reporting server, with intelligent automation in the form of task graphs with calling scripts by nodes (practically Application Manager), scalability, clustering and an analog of BPN. And what is characteristic, the system was written, but did not go into commercial operation. The potentially overwhelming volume of acceptance testing has affected. Unfortunately, the already finished system had to be postponed and returned to the search for solutions and box analogues.
New architecture
In search of suitable technologies, we came to the microservice architecture and the Camunda platform. The technologies looked promising, but, in the process of implementation, we ran into problems with the performance of the database interaction library (API dll). To resolve them, the library had to be rewritten from Delphi to .Net. The root of all the problems was the library’s single-threading, so in the new version it turned into a multi-process and multi-threaded tool. This immediately reduced the report generation time by about three times. Recall that on days rich in market activity, the size of xml file reports on applications reached tens of gigabytes. Thus, after extensive testing, the report generation time was reduced from more than 60 to 20-25 minutes.
After the problems with the .dll were resolved, there were no barriers to updating the Reporter.
Now it is a set of microservices deployed in a Kubernetes cluster. Each set of interconnected services includes the backend and frontend of the reporting service, the backend and frontend of the reporting service, Camunda for business process management. To implement the back and front, we chose .Net and React, respectively. Each of the sets is deployed in six copies depending on the target group (stock / currency market, trading / clearing operations + 2 copies for internal needs). Instances differ from each other only in settings.
.SCX scripts remained as a unified format for request description and data formatting. Declarative configuration makes it easy to add new reports and customize old ones. Each report is still described by one xml document. There is a timid hope that the functionality can be easily extended without changes in the service code.

The new architecture has significantly expanded our capabilities in automating the report preparation process. Thus, various modes of launching report generation appeared: in fully automatic mode (according to the scheduler’s schedule without the participation of a broker-operator), in semi-automatic mode (an operator starts generating a group of reports at the right time) and for problem cases – a completely manual version. It became possible to generate a report on a condition, for example, on the fact that another report is ready, or create reports that require confirmation from two independent operators. Significantly expanded the possibility of auditing the work of the service. The interface has become nicer. All this significantly reduced the labor costs of operators, technical support and, of course, the developers themselves. The risks of making mistakes during manual maintenance of the process have been significantly reduced.


An interesting side effect of the new architecture is the ability to use the Reporter as a process operations server, which allows you to connect any operations that run during the day, automatically start groups of these operations, etc. That is, technically it can be used as a tool to automate the launch of all actions performed operating divisions (in three markets of the Moscow Exchange).
Summing up
In the fifteen years since its inception, our Reporter has come a long way. Constraints give birth to form and our product, faced with the constant growth of data volumes, increasing complexity of the database structure, expanding business requirements, crystallized into a scalable stable structure with a modern technology stack and a high level of ergonomics. We consider the evolutionary approach to the application to be an important merit on this path: despite the fact that the system was improved many times, we managed to keep parts of the system with business logic unchanged, which allowed us to avoid large-scale regression testing, both in the development process and in acceptance testing. . I can’t say enough thanks to the back office team who have been lovingly and carefully perfecting and polishing the system over the course of these fifteen years in an endless pursuit of performance and ease of use. However, the reporter’s story does not end there. There are plans to further develop the automation of report preparation. Import substitution of some components and other works are planned.


