How neural networks deceive doctors

A wave of neural network innovations has also reached computed tomography (CT), which is generally not surprising, given the number of image analysis tasks in CT and the rapid growth in the field of application of machine learning methods. Here are the tasks of segmentation (for example, isolation of tumors, visualization), and image analysis (detection of COVID-19), and even improving the accuracy of reconstruction. Moreover, if the first two cases of using neural networks are a consulting tool for a doctor and do not change the image in any way, then the use of neural networks to obtain reconstruction from the original data can be a real danger. So the neural network can erase or draw details important for diagnosing the patient’s health on the reconstructed image and mislead the doctor. In this article, we will tell you where and why neural networks are used in tomography, about hardware attacks on them, and we will try to quantify the security of using machine learning tools in computed tomography.
Since the dangers of X-ray radiation have been known for a long time, the task of reducing the dose while maintaining image quality arose approximately simultaneously with the advent of CT and the commissioning of the first medical tomographs in 1979. Since then, both the configurations of tomographs and its individual units have been continuously improved, new scanning protocols, new algorithms for reconstruction and post-image processing have been developed. To achieve the goal, the most modern means are used, and, of course, the arrival of artificial intelligence (AI) was not long in coming.
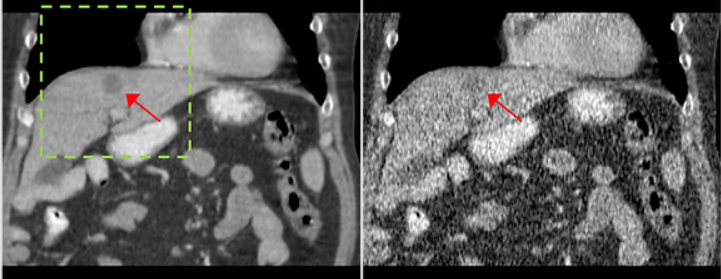
The main way to reduce the dose load, without changing the design of the tomograph and the study protocol, is to reduce the time of registration or exposure of one X-ray image (the so-called projection). From a set of projections taken from different angles, an image of the internal structure of the object under study is restored using a reconstruction algorithm (for example, the convolution and back projection algorithm or Filtered Back Projection (FBP)) . If the projections were taken with a reduced exposure time, then when using classical reconstruction algorithms, salt / pepper distortions or fine-grained noise appear on the reconstructed image. An example of a section of a reconstructed image based on data with normal and reduced exposure is shown in Fig. 1. The arrow shows a tumor that must be detected by a doctor for a correct diagnosis. On the right image, due to the noise, the tumor becomes poorly distinguishable; therefore, it will be difficult to make a correct diagnosis based on this image.
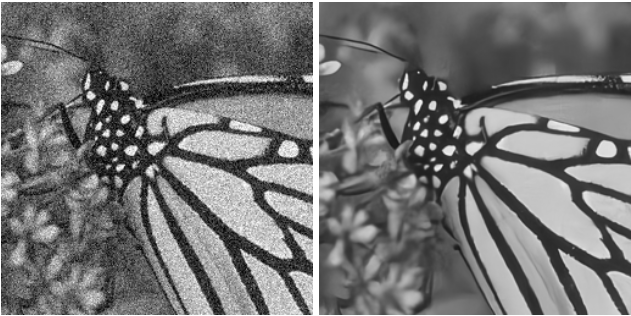
However, modern technologies do not stand still, the use of neural networks in various tasks is an example of this. Neural networks do a good job of denoising and show state-of-the-art results in this area. On fig. 2 shows an example of the operation of a neural network (https://github.com/cszn/DnCNN), which reduces noise in photos. According to fig.1 (B) and fig. 2 (A) there is a visual similarity of noise in photographs and CT results with reduced exposure, which means that the same architectures of neural networks can be used for noise reduction in tomography, so the natural development of the CT method is the development of AI systems for tomographic reconstruction.
AI systems for noise reduction in tomography come in three types. The first type is pre-processing AI. Such AI systems suppress noise in the space of X-ray images, after which a reconstruction algorithm is applied. Their advantage lies in the possibility of taking into account the physical model of noise. The second type is an AI system with simultaneous reconstruction and noise reduction. The main advantage of such AI systems is the optimal combination of quality and speed. Another option for using neural networks in tomography is the processing of an already reconstructed image – AI post-processing systems, for which absolutely any tomographic reconstruction algorithm can be applied. However, despite all the advantages of neural network algorithms, they have a significant drawback. Namely, they can be unstable to attacks or small distortions of input data that greatly change the result of the neural network. In some cases, this can lead to irreversible consequences in the process of using already trained neural network algorithms. What are attacks on artificial intelligence, how they work and what consequences they can lead to, we wrote here.
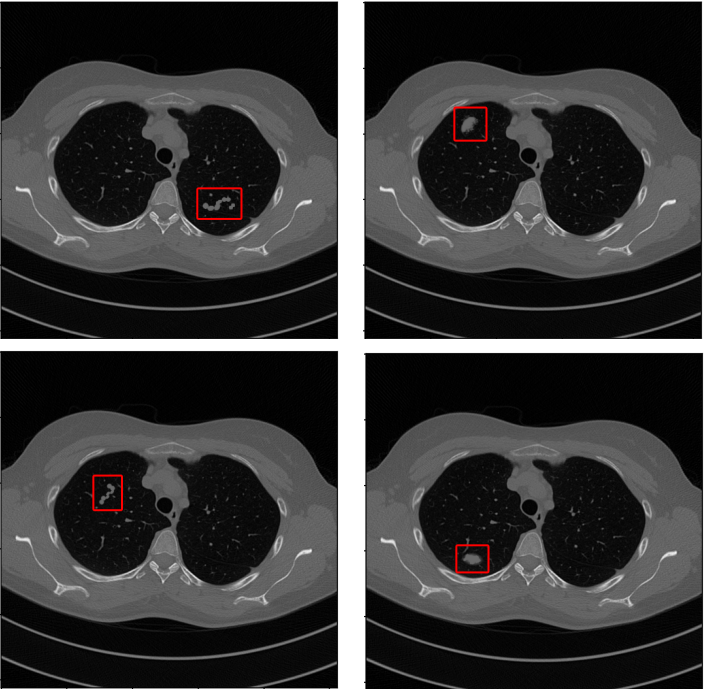
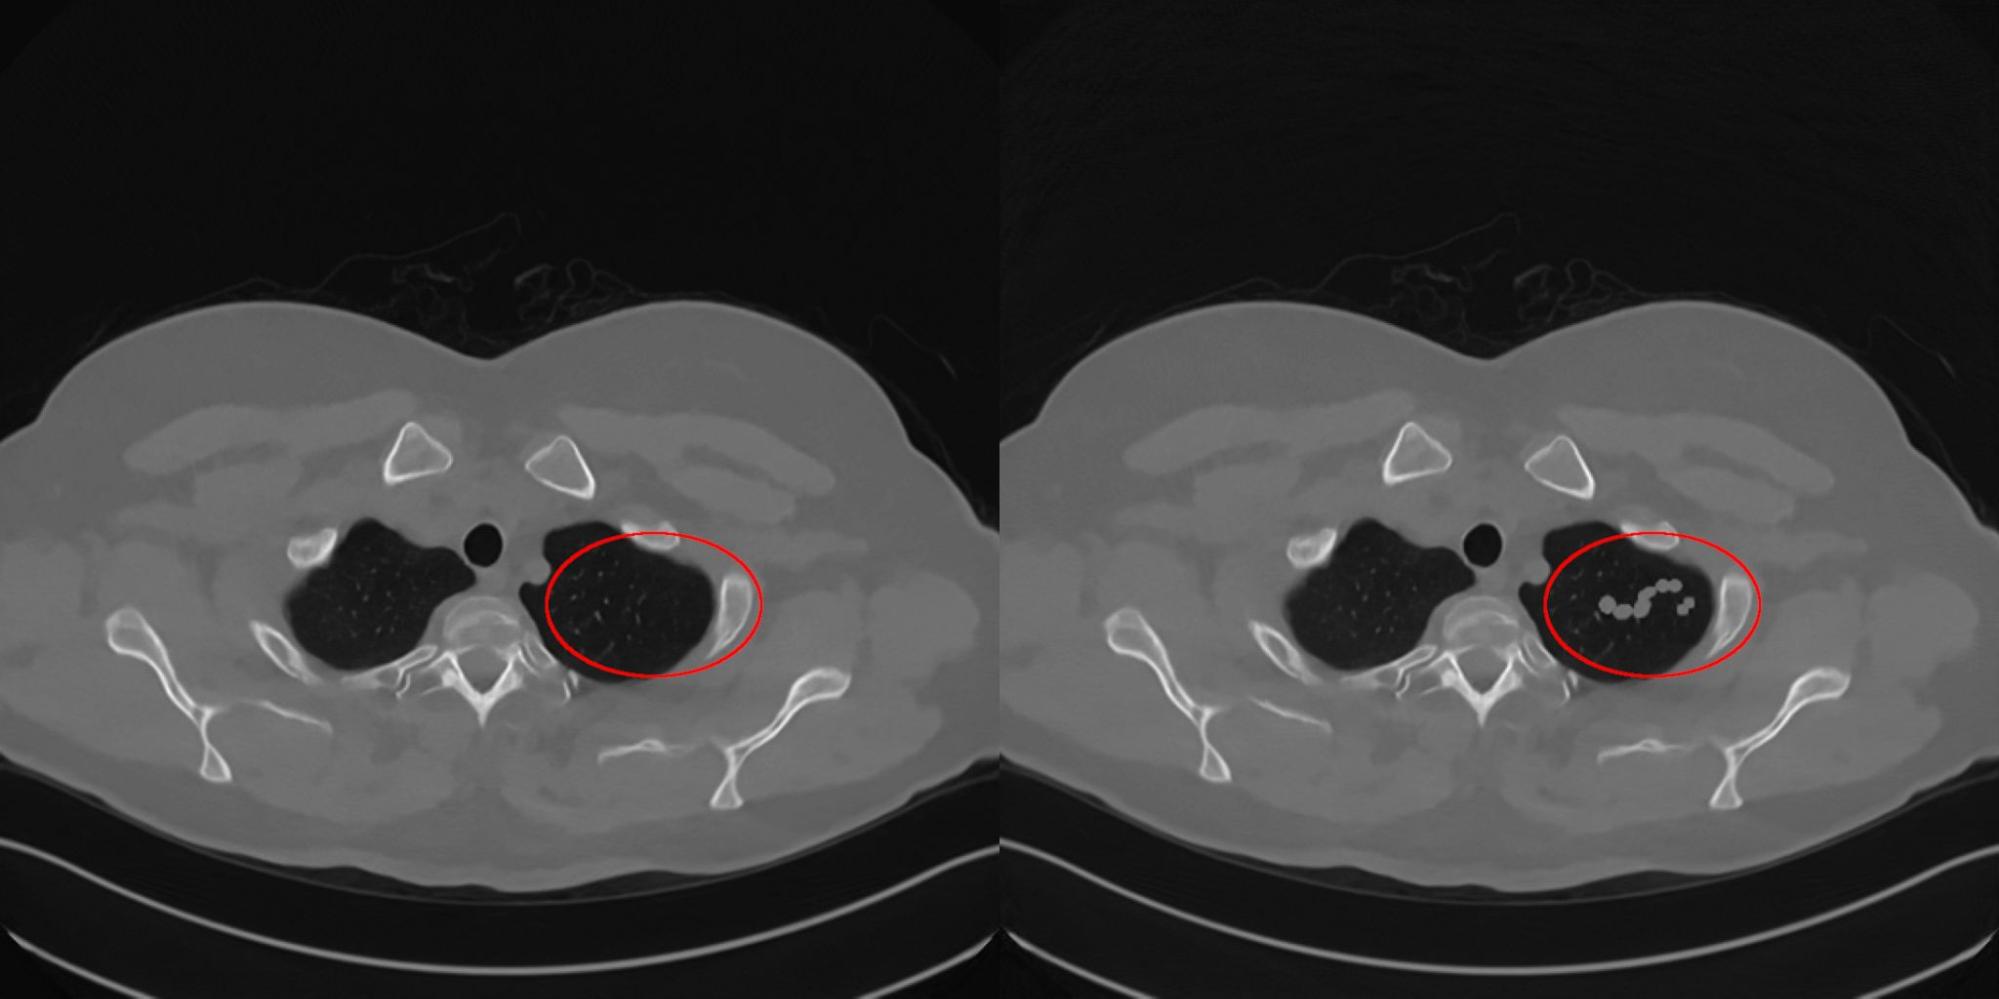
Attacks on reconstruction algorithms in tomography are dangerous because they can lead to a diagnosis error, which can be made, for example, if the algorithm draws a tumor that does not exist in reality on the reconstructed image. To prevent this from happening, we need to learn how to determine how stable AI tomographic systems are to small distortions of input data. This is what we did as part of our scientific work, and the result was issued in the form of an article in the journal MPDI Mathematics [1]. In this work, we investigated the stability of two classical tomographic reconstruction algorithms (FBP, SIRT – we wrote about them here) and the most popular AI tomographic systems for noise reduction. Among them, the Unet1D neural network [2] – pre-processing AI; neural network reconstruction algorithms Learned Primal-Dual Reconstruction (LPDR) [3] and TiraFL [4]; two AI post-processing systems – ResUNet [5] and FBPConvNet [6]. The stability test of the algorithms consisted in assessing the possibility of reconstructing an image based on the data of a healthy patient, which would lead to a medical error, i.e. with a disease-like defect. We have selected 4 images with infectious lung diseases from the CT medical atlas [7]. They are shown in Fig. 4, the red rectangles indicate the places by which the doctor determines the presence of a particular infectious disease in a patient. If nothing has recovered in the reconstruction indicated by the red rectangle, then the patient does not have the disease. These are reference images, by which we will judge how much the reconstructing algorithm has learned to hallucinate.
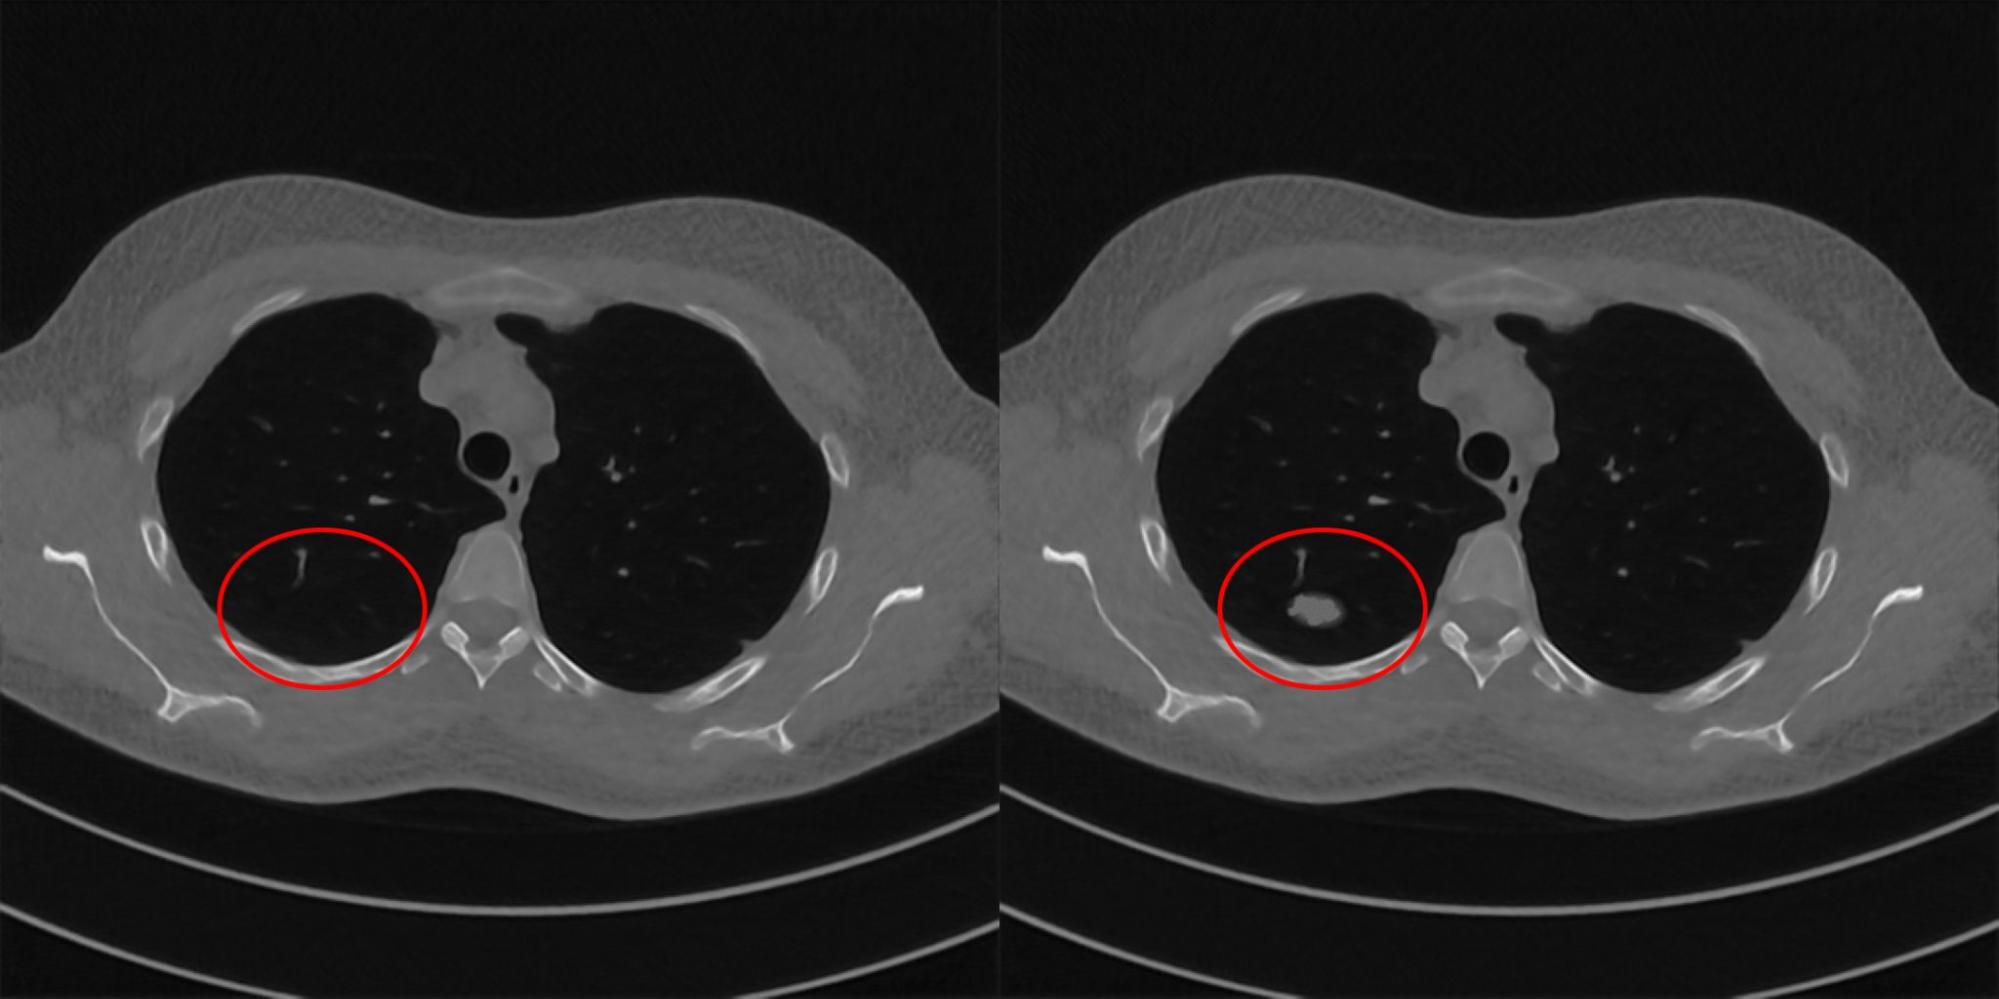
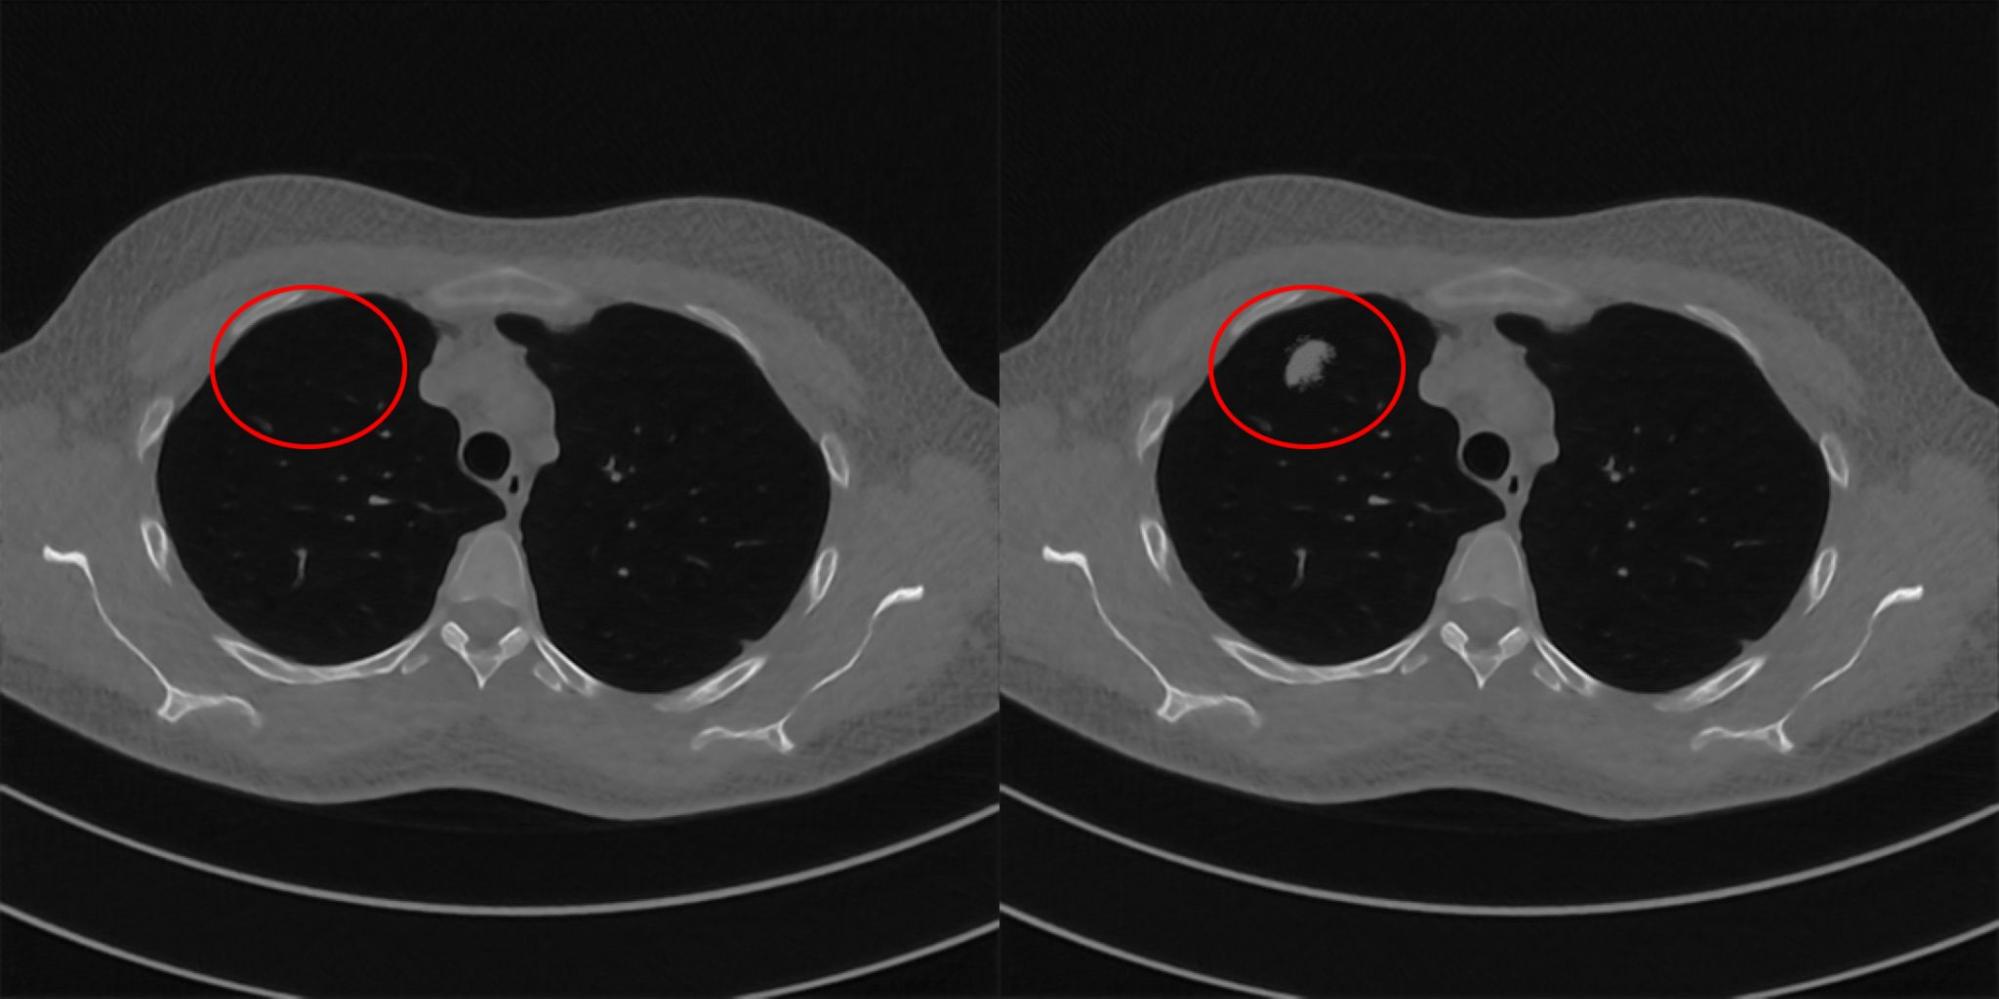
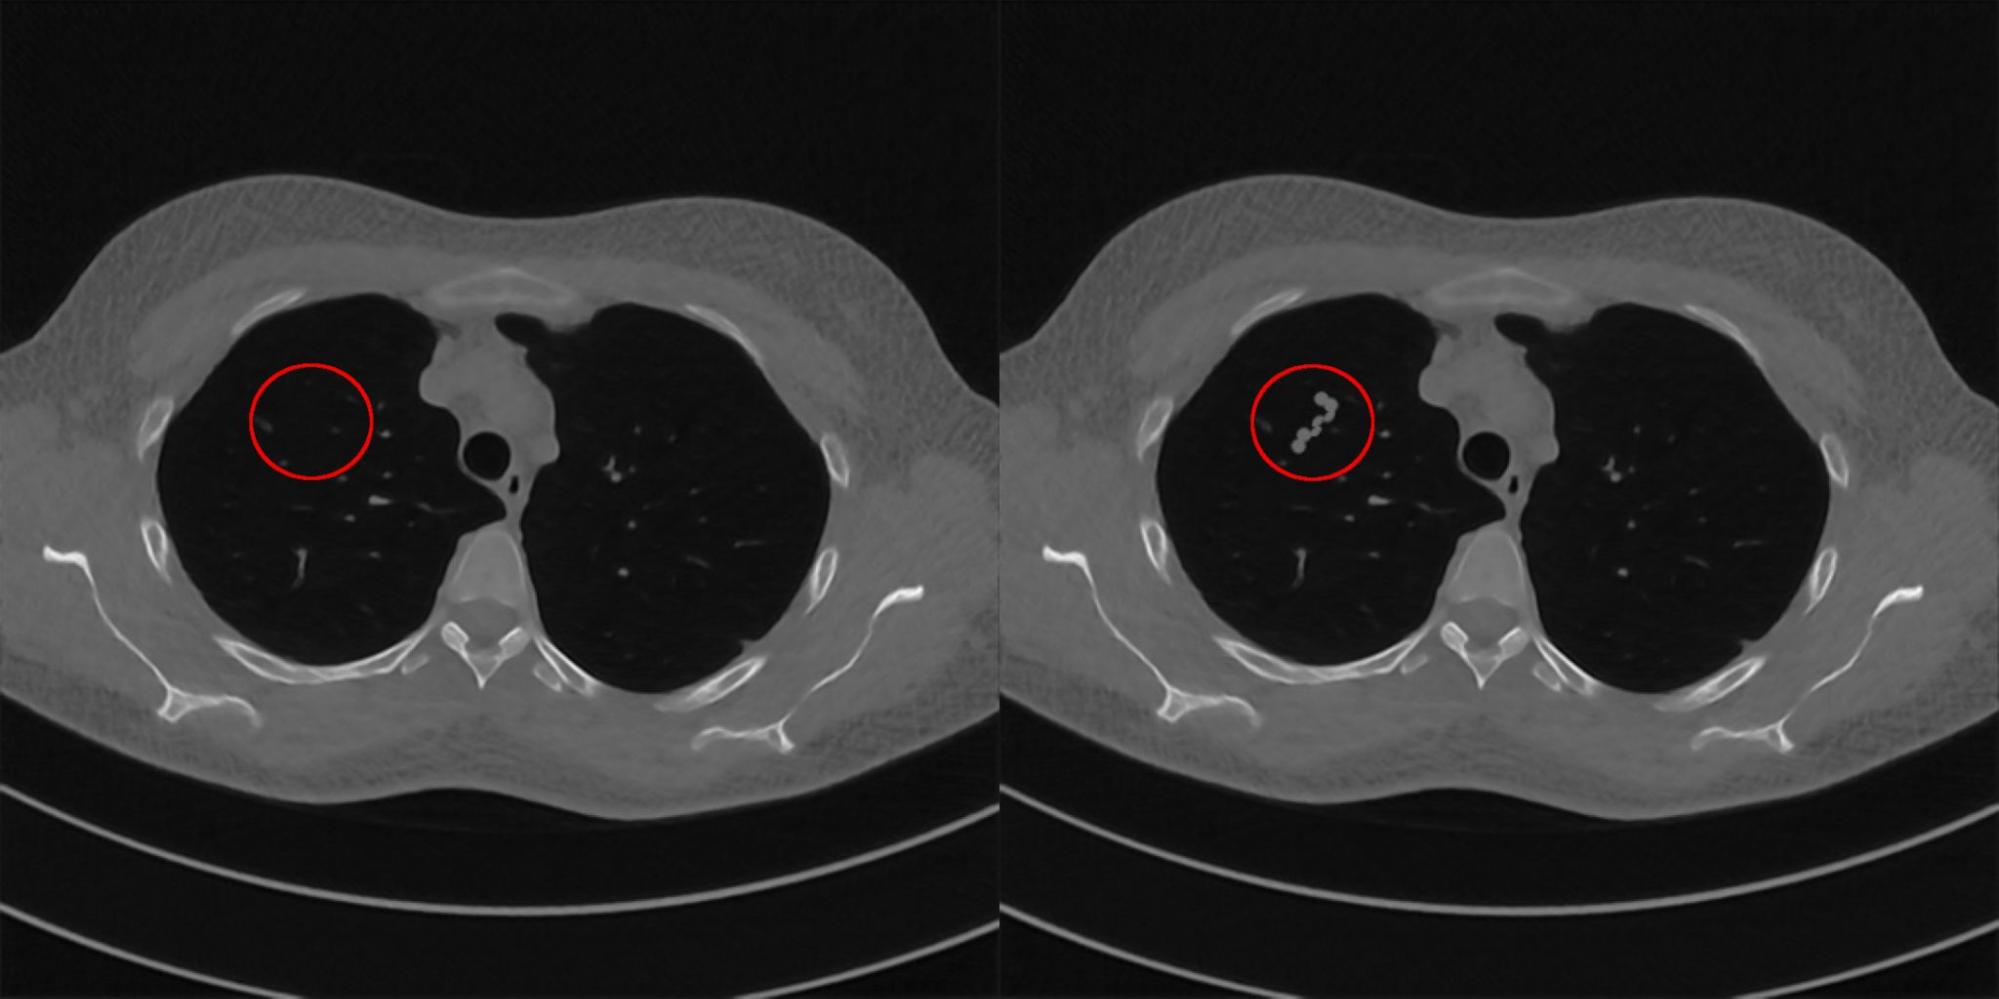
Further, for each reconstruction algorithm, we will look for the minimum addition to the initial projections of a healthy patient, which is sufficient to obtain reconstructions with an image of the disease. To do this, we construct an optimization problem in which we will minimize the Cartesian norm between the reference image with the disease and the reconstruction obtained by the algorithm under study. Below in fig. Figures 9-12 show examples of pairs of images that were selected for the studied AI tomography systems. How plausible the reconstruction turned out, i.e. how similar the image is to the reconstruction of a sick patient, the radiologist of the Clinical Center of Sechenov University helped us to determine. She selected for us examples by which we calculated the stability score of the algorithms.
To estimate the stability of the reconstruction algorithm, we introduced the function SMwhich is calculated by the following formula:
where ∆P is an analytically calculated addition to the original projection data, which is necessary to obtain a reconstruction with a given distortion. The additive is calculated using the forward projection operator on the distorted image. ∆PM is the minimum addition to the original data, which is necessary for the studied reconstruction algorithm to obtain a distorted image. Function SM takes values in the range from 0 to 1. The value 1 corresponds to an ideally stable reconstruction algorithm, 0 corresponds to an unstable one.
The table below shows the average values of the function SMcalculated for all 4 types of lung injury.
Algorithm name | Algorithm type | Meaning SM |
SIRT | Classical | 0.96 |
FBP | Classical | 0.87 |
ResUNet | Post-processing AI | 0.64 |
TiraFL | Reconstructive AI | 0.60 |
UNet1D | Preprocessing AI | 0.52 |
LPDR | Reconstructive AI | 0.45 |
FBPConvNet | Post-processing AI | 0.38 |
The table shows that no algorithm, even the classical one, reaches the value 1. Thus, not only the AI system, but also the classical reconstruction algorithm can potentially deceive doctors. Among all the AI tomography systems that we have studied, the methods of neural network post-processing of reconstruction results are the most resistant to attacks.
Conclusion
The approach described in today’s article fully fits into the paradigm of Responsible Artificial Intelligence. And we sincerely urge all systems developers (especially those related to life and health) using AI as a tool to strictly adhere to this paradigm.
