How is the space in which language models think organized?
Our scientific work, which was just presented at the EACL 2024 conference, which was held in Malta, is dedicated to such a study of transformers “under a microscope”. “The Shape of Learning: Anisotropy and Intrinsic Dimensions in Transformer-Based Models”. In this work, we focused on observing the embedding space in intermediate layers as large and small language models (LMs) were trained and obtained some very interesting results.
So let's get started!
Data
Let's start by talking about the data – this is necessary to make it easier to understand what we did and what we discovered. Because we were interested in the space of contextualized embeddings (including intermediate ones); we had to get them somewhere.
We took enwik8 — neatly cleaned up Wikipedia articles in English. We ran these texts through the studied models, saving all intermediate activations (for each token and from each layer). This is how we got the “embedding space” or, in other words, a multidimensional point cloud, with which we began to work further.
To exclude the dependence of observations on the selected dataset, we repeated the experiments on random sequences of tokens, and all conclusions were repeated. Therefore, in the future I will not focus on this, but rather I will immediately move on to the results.
Anisotropy
One of the most important questions we asked ourselves during the research process was what shape do these point clouds actually have? Visualizing them is difficult – the embedding space is very multidimensional – and dimensionality reduction methods do not help much. So we decided to use anisotropy as our “microscope”. Anisotropy is a measure that shows how elongated a cloud of points is, how heterogeneous it is. The higher this value, the more the space is stretched.

For example, it has long been known (see article Representation Degeneration Problem in Training Natural Language Generation Models), that the embeddings of transformer encoders lie in a “narrow cone” – because of this, the cosines between text representations are always very high. But nevertheless, if you subtract the average value and center this cloud of points, it becomes completely isotropic, that is, similar to a multidimensional ball. Therefore, they say that the embeddings of transformer encoders (Bert, RoBERTa, Albert, …) are locally isotropic.
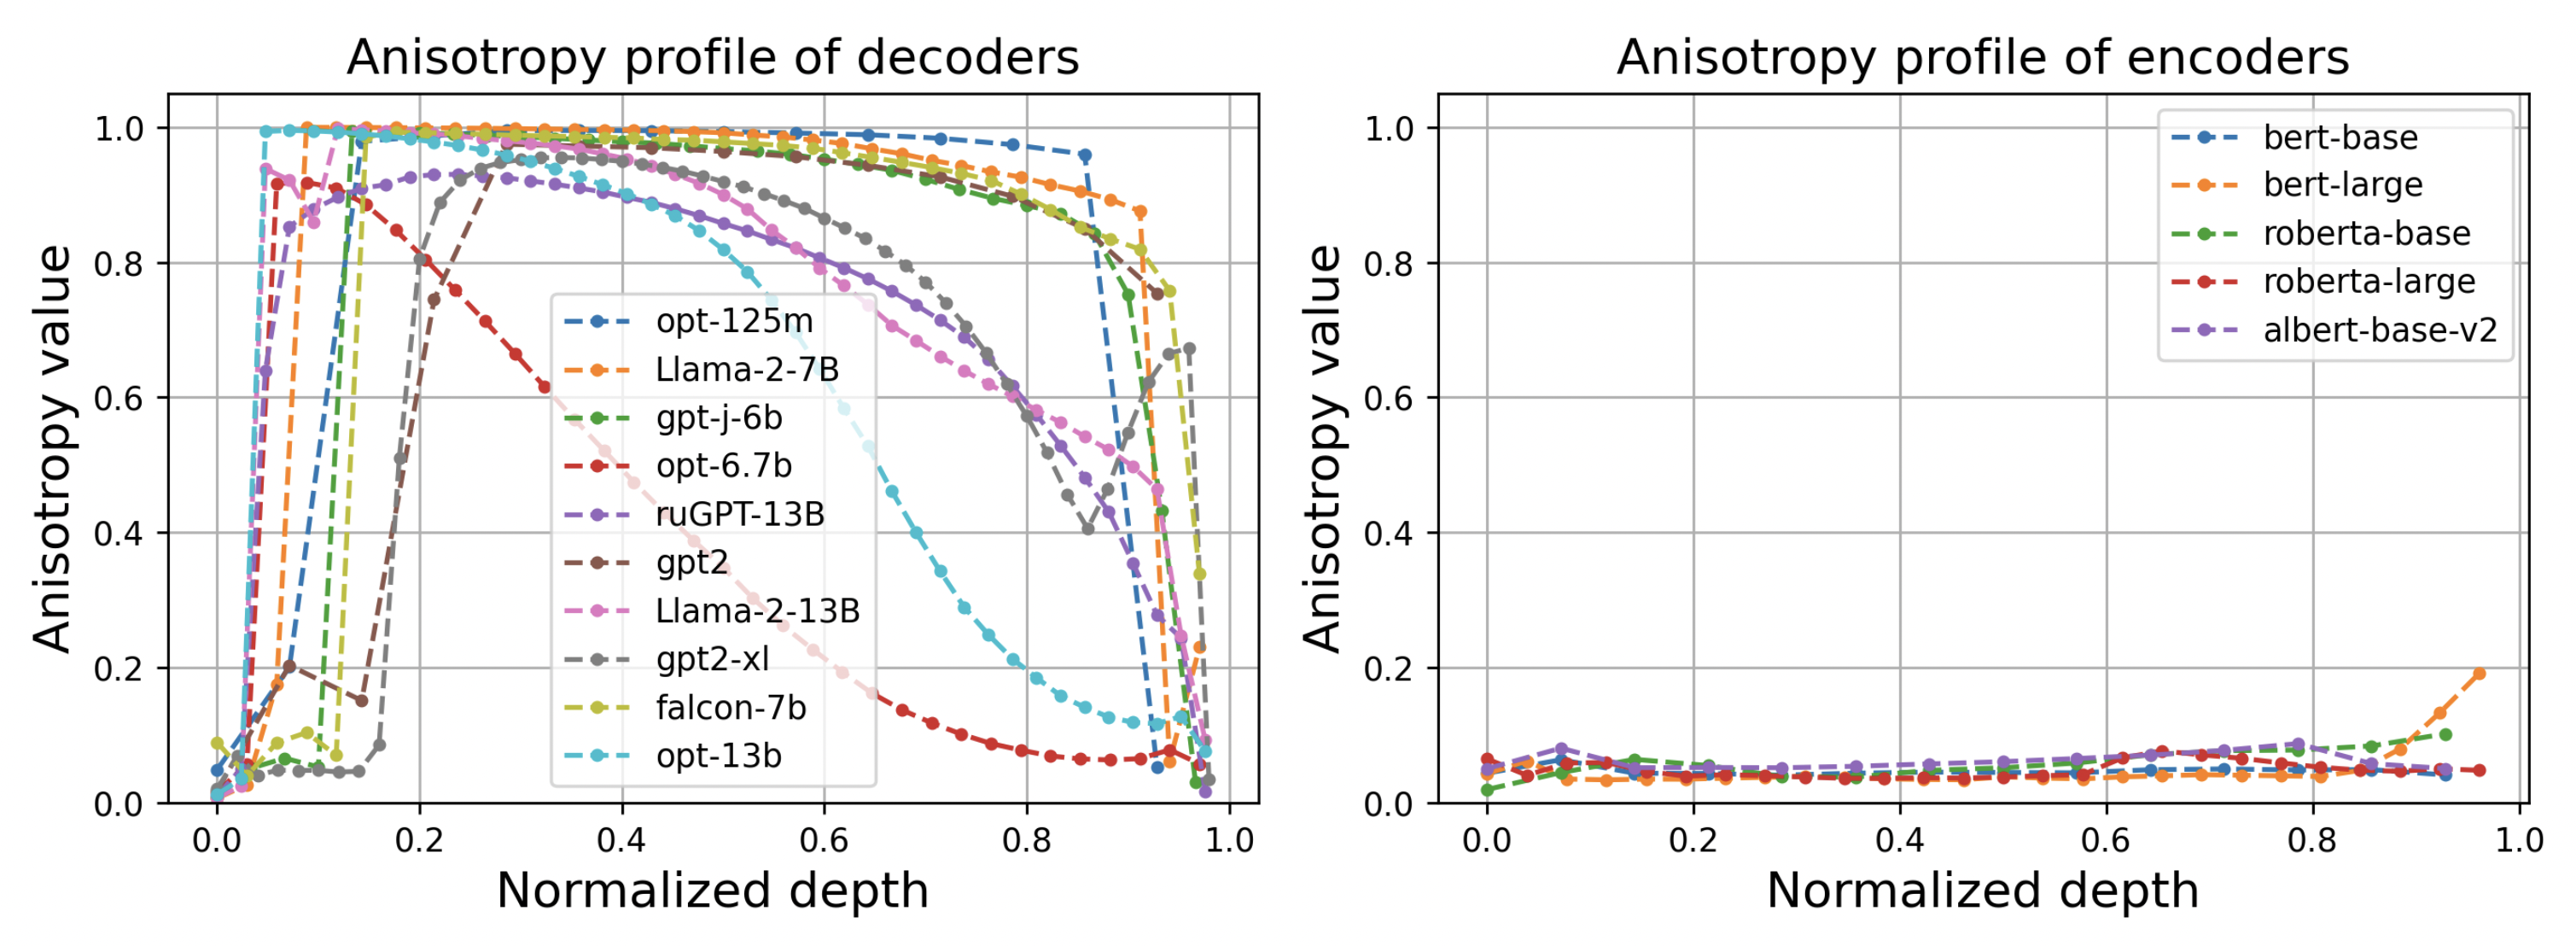
And in the case of decoders (GPT, Llama, Mistral, …) we found that this is completely wrong! Even after centering and using more bias-tolerant singular value-based methods, we see that in the middle layers of language models the anisotropy is almost equal to 1. This means that the point cloud there is elongated along a straight line. But why? This greatly reduces the capacity of the model; because of this, it practically does not use THOUSANDS of other dimensions.

We don’t yet know where this heterogeneity in the representation space in decoders comes from, but we assume that it is related to their learning process, the task of predicting the next token, and the triangular attention mask. This is one of the research tasks that now faces us.
If you look at the anisotropy profile by layer, it becomes clear that at the beginning and end of the decoders, the embeddings are much more isotropic, and extremely high anisotropy is observed only in the middle, where the entire thought process should take place.
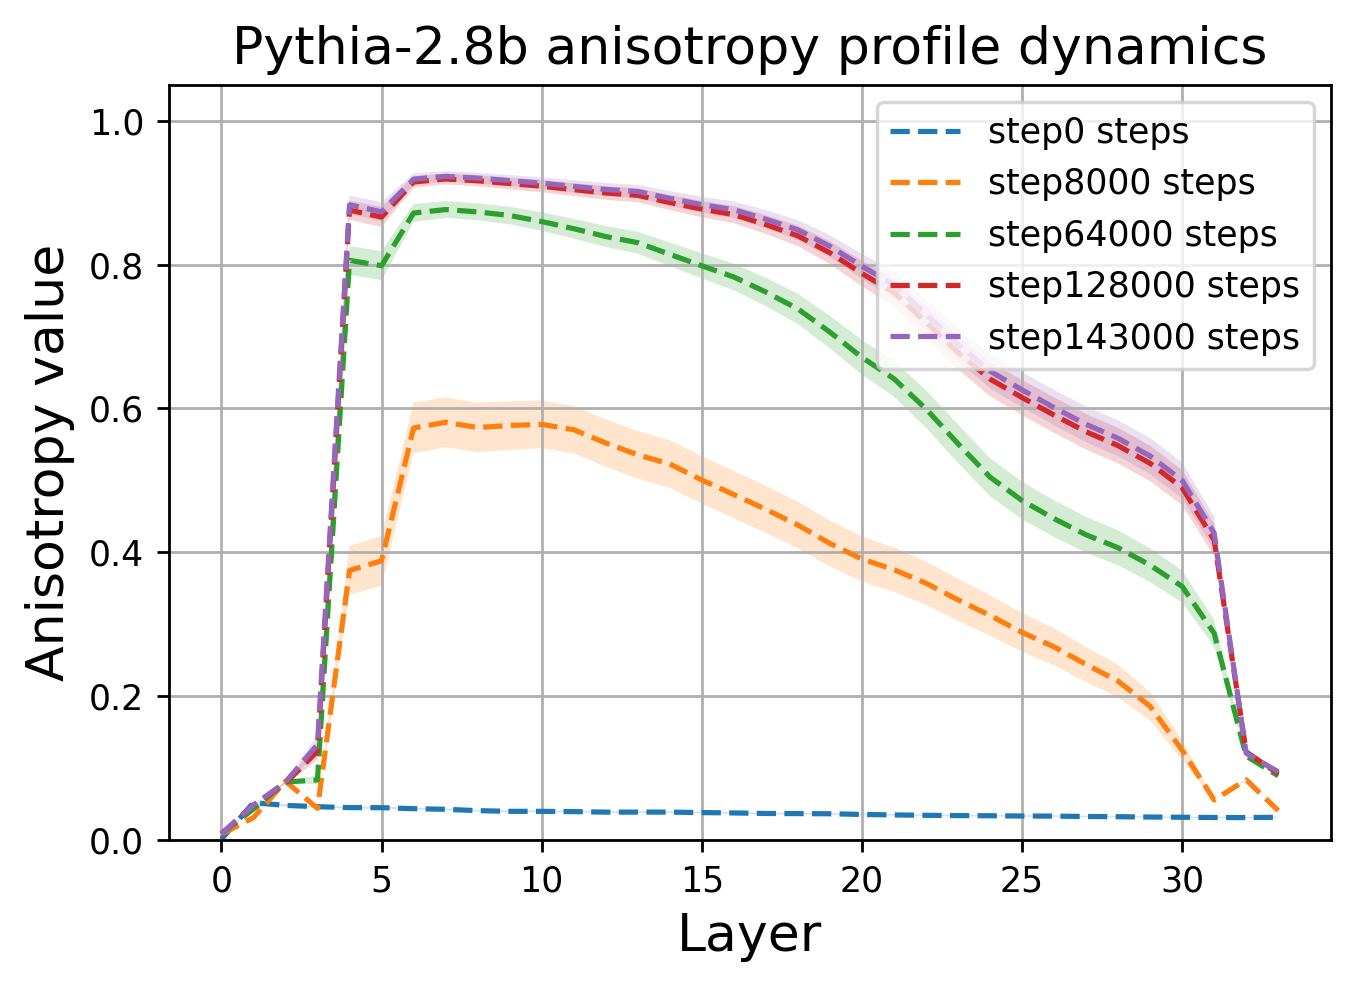
We looked at how anisotropy changes from checkpoint to checkpoint as the models are trained (we took all the models with intermediate weights from what was published at that time). It turned out that all models of the transformer-decoder class gradually converge to the same shape of space and the same dome-shaped anisotropy profile.
Internal dimension
Our next “microscope” for observing activations is internal dimension. This is a rather beautiful mathematical concept that describes the “complexity” of the figure (manifold or manifold) on which points are located in multidimensional space.
To make it clearer, consider a three-dimensional figure in the form of a ribbon rolled into a spiral (see picture below). If we approach any part of it, we will find that in a small neighborhood the points seem to lie on a plane. Therefore, the local internal dimension here is equal to two.
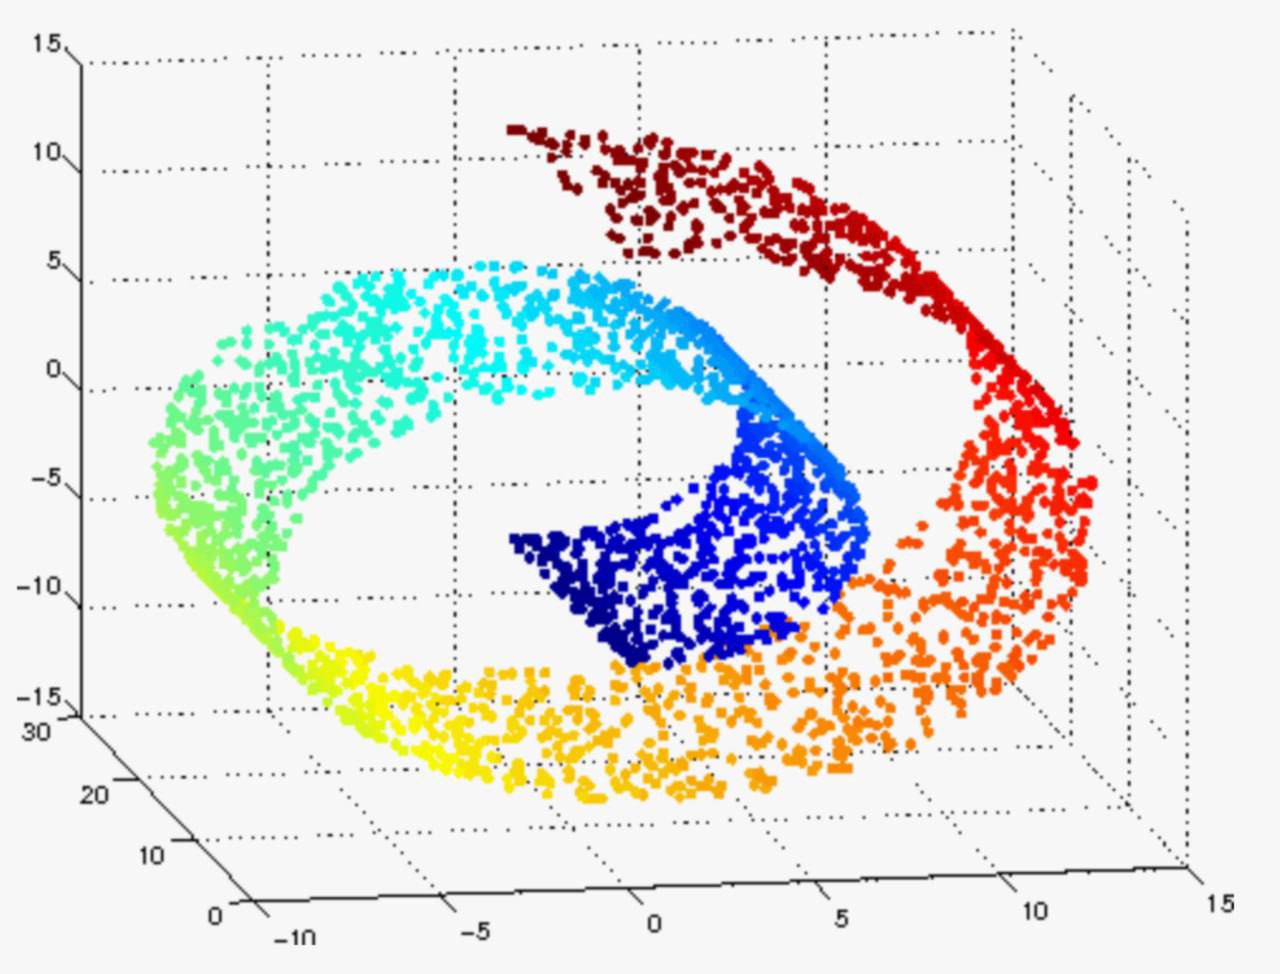
Most importantly, the intrinsic dimension is fairly easy to estimate, since it is strongly related to the rate at which the “volume” of a multidimensional ball grows (the number of data points that fall inside the ball) as the radius increases. Measuring the dependence of the number of points on the radius allows one to determine the internal dimension in the local area of the data cloud.
So what did we find? Firstly, the dimension is quite low, but this is not news, because… this was discovered before us. Secondly, and this is much more interesting, this dimension changes equally for all models as they learn! This process consists of two phases – first growth and then decline (see graph).
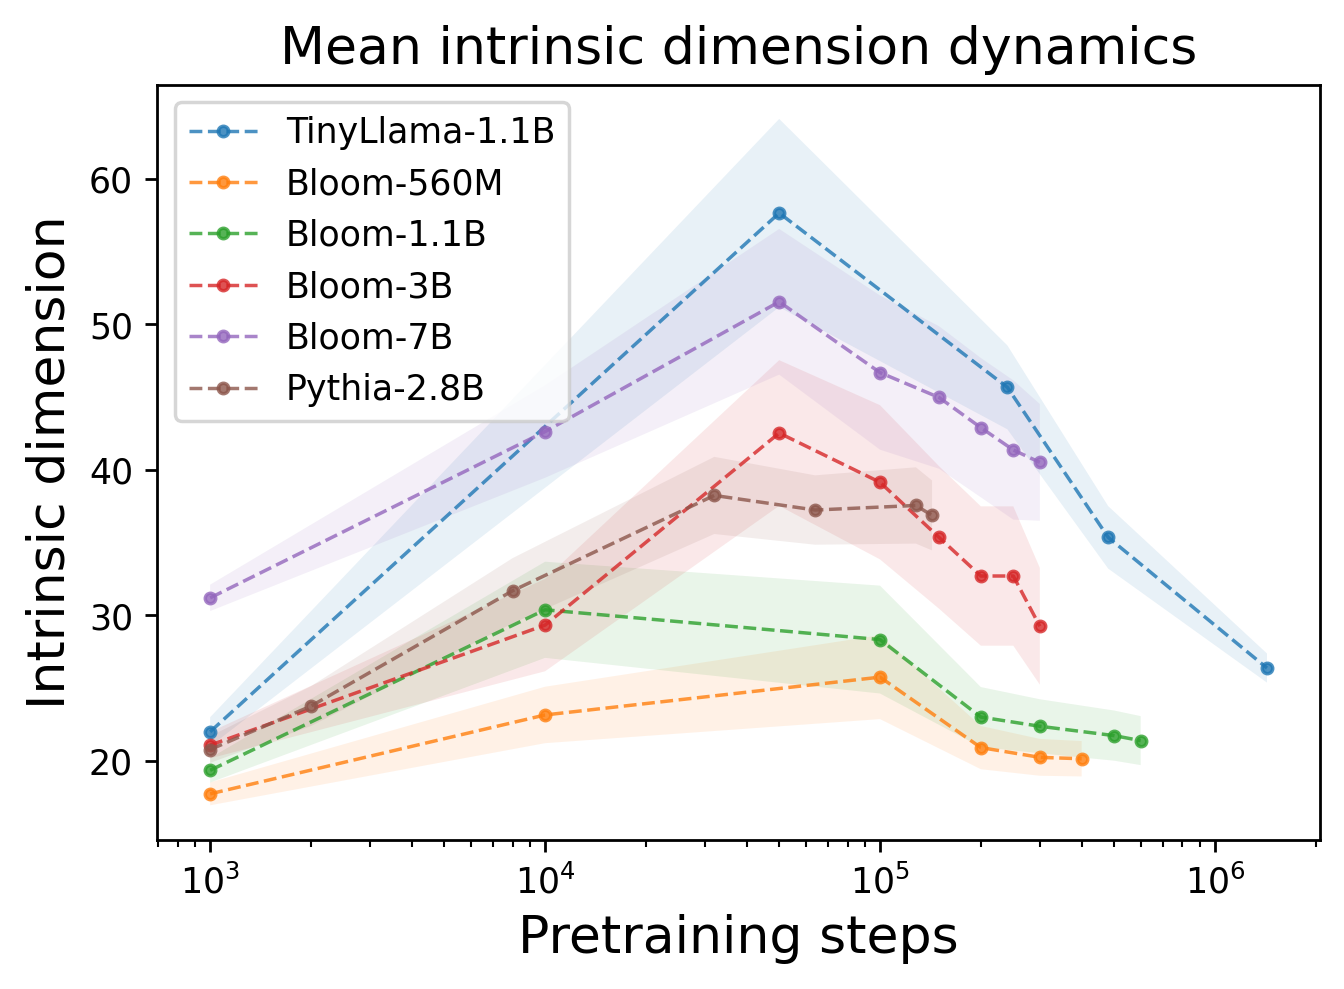
It appears that the first part of training moves features into higher dimensions to “remember” as much information as possible, and in the second phase, features begin to shrink, allowing more patterns to be identified, increasing the generalization abilities of the model.
Once again, all LLMs have two phases during training: embedding inflation and their subsequent compression.
What does this give?
We believe that, armed with new knowledge, we will be able to improve the process of training language models (and not only), make it more efficient, and make the transformers themselves faster and more compact. After all, if embeddings go through the compression stage and generally tend to be located along one line, then why not simply discard unused dimensions? Or help the model overcome the first phase more quickly.
We also found that shortly before loss explosions during training (a sore point for everyone who teaches LLM), the internal dimension grows significantly. Perhaps we will be able to predict loss explosions without wasting computing resources, or even overcome these instabilities by understanding their nature.
Although who am I kidding, all this is just to satisfy my curiosity!
Subscribe to the authors' channels on Telegram AbstractDL, CompleteAI, Dendi Math&AI, Ivan Oseledets


