How etcd works with and without Kubernetes
If you've ever interacted with a Kubernetes cluster, chances are it was based on etcd. etcd is at the heart of Kubernetes, but despite this, you don’t have to interact with it directly every day.
This translation of an article from learnk8s will introduce you to how etcd works so you can gain a deeper understanding of the inner workings of Kubernetes and gain additional tools to troubleshoot problems in your cluster. We'll set up and break down a three-node etcd cluster and learn why Kubernetes uses etcd as its database.
How ETCD fits into Kubernetes
In the Kubernetes cluster there are three categories of control-plane processes, that is, processes of the so-called “control layer”:
Centralized controllers. Scheduler, controller-manager and third-party controllers that configure pods and other resources.
Node-specific processes. The most important: kubelet, which fine-tune the pod and network based on the desired configuration.
API Serverwhich coordinates the interaction between all control-plane processes and nodes.
This is what it looks like:


Kubernetes has an interesting design decision: the API server itself does very little.
When a user or process makes an API call, the API server:
Determines whether an API call is allowed (using RBAC).
Depending on the settings, changes the payload of the API call using mutating webhooks.
Checks the payload for validity (using internal validation and validating webhooks).
Stores the API payload and returns the requested information.
Notifies API endpoint subscribers that an object has changed (more on this later).
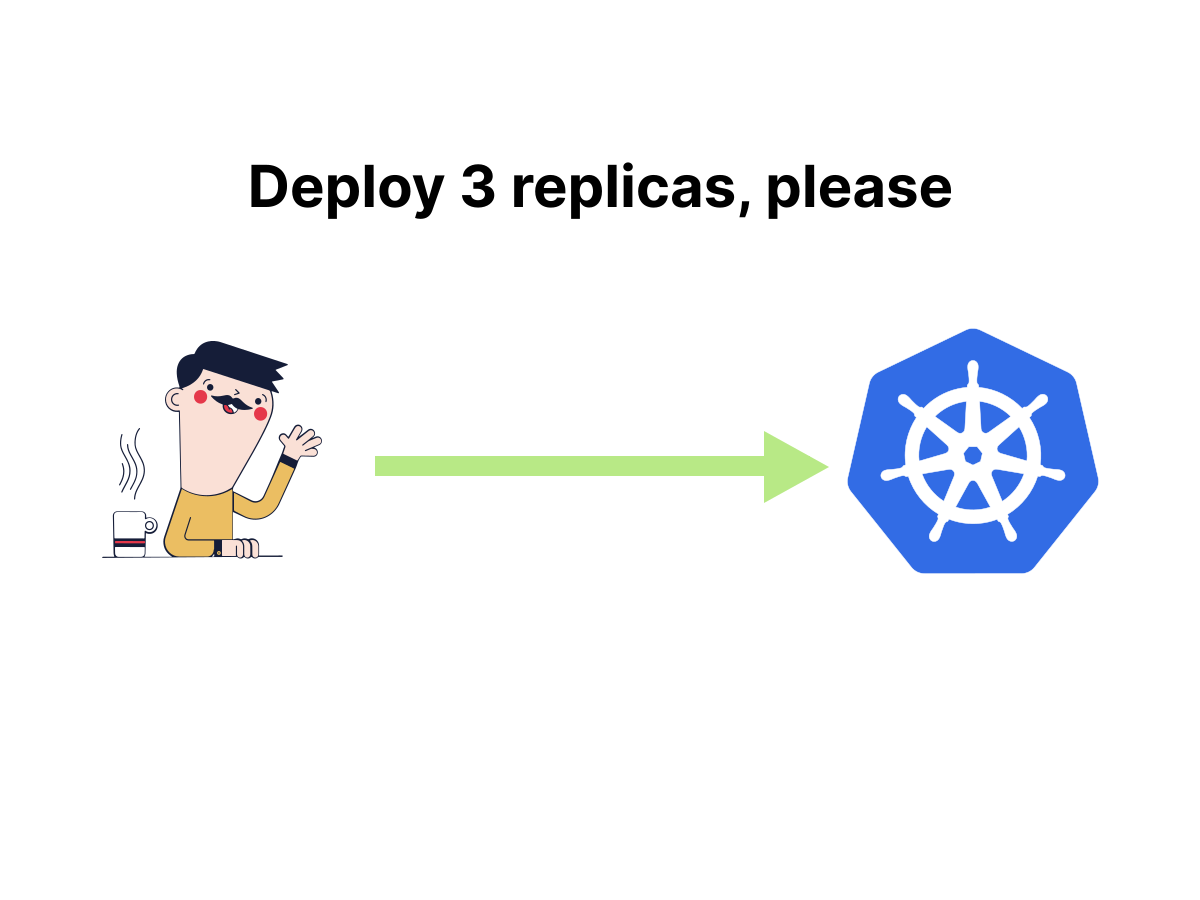
kubectl apply -f deployment.yaml.


Everything else that happens in the cluster is handled by node-specific controllers and processes.
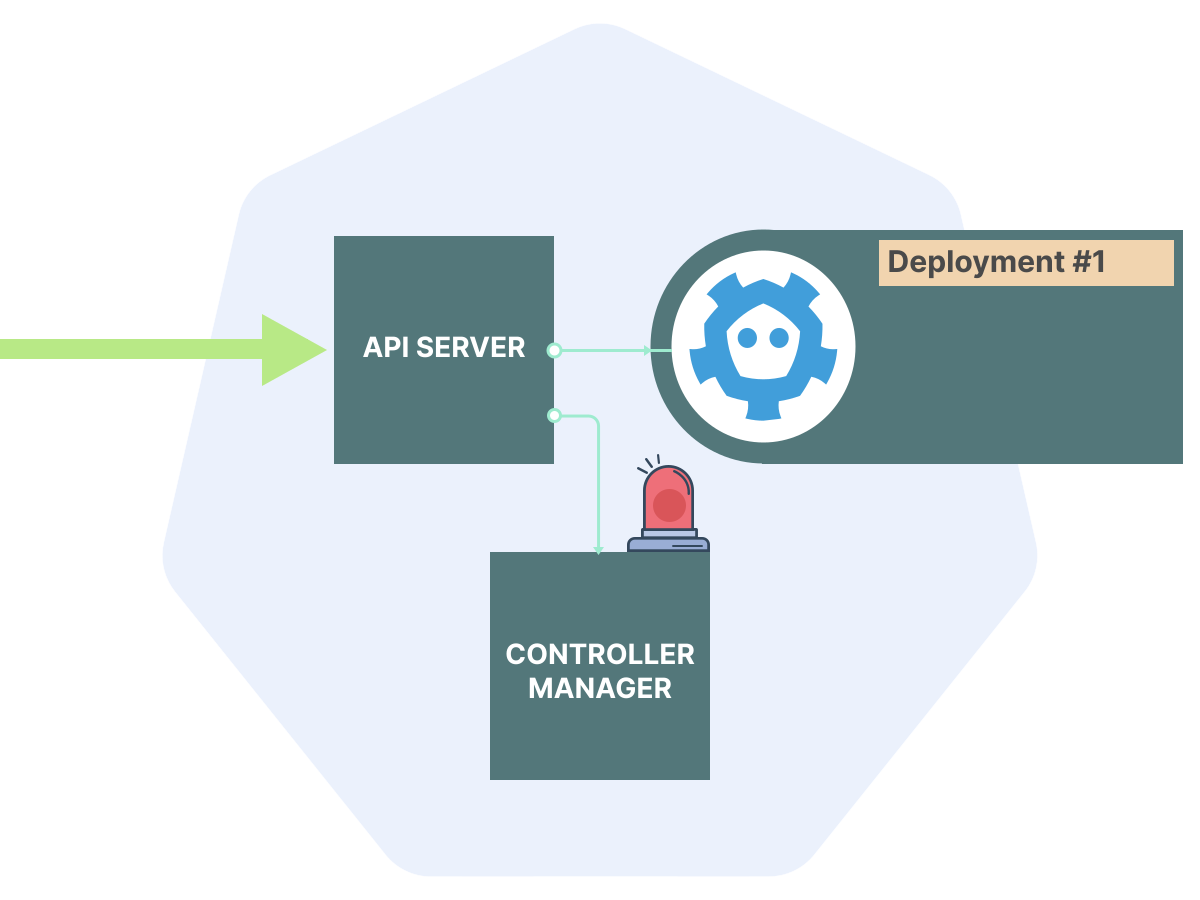
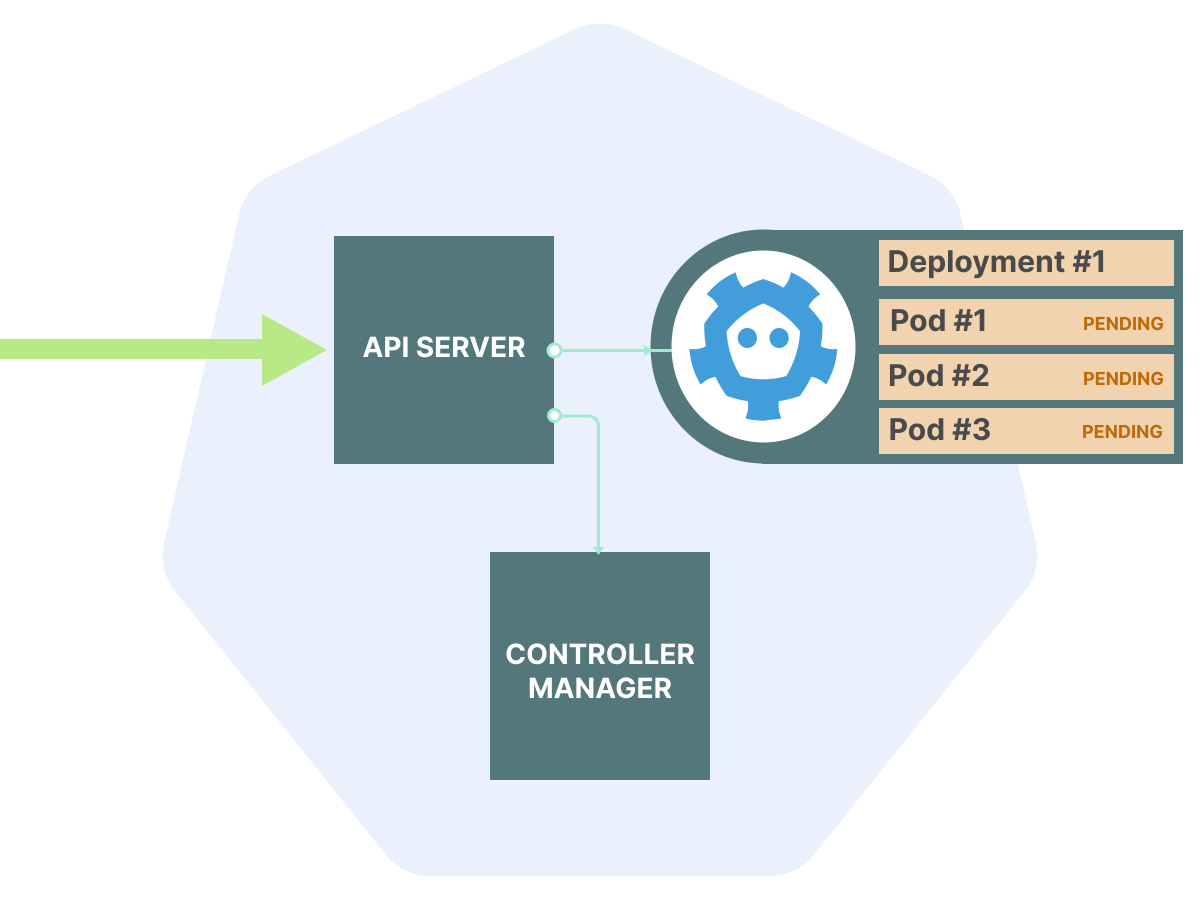
If we talk about architecture, the API server is essentially a CRUD application. That is, intended for reading, writing, updating and deleting data. It is basically no different from, for example, WordPress. Most of its work is storing and presenting data.
And, like WordPress, it needs a database to store persistent data, which is where etcd comes into play.
Why etcd?
Can the API server use a SQL database such as MySQL or PostgreSQL?
Of course it can (more on that later), but it's not very suitable for the special requirements of Kubernetes.
What properties should the database that the API server relies on have?
Typically these:
1. Consistency
Since the API server is the central focal point of the entire cluster, strong consistency is important.
It would be a disaster if, for example, two nodes tried to mount the same persistent volume over iSCSI because the API server told them both that it was available.
Because of this requirement, NoSQL databases and some distributed multi-master SQL configurations are excluded.
2. Availability
API downtime means stopping the entire Kubernetes control plane, which is undesirable for production clusters.
CAP theorem states that 100% availability is not possible with strict consistency, but minimizing downtime is still an important goal.
3. Stable performance
The API server for a busy Kubernetes cluster processes a significant number of read and write requests. Unpredictable slowdowns due to concurrent use would be a huge problem.
4. Notice of Changes
Since the API server acts as a centralized coordinator between different types of clients, streaming changes in real time would be a great feature (and it turns out that it is at the core of how Kubernetes works in practice).
Here's what not required from API database:
Large Datasets. Since the API server only stores metadata about pods and other objects, there is a natural limit to the amount of data it can store. A large cluster will store anywhere from hundreds of megabytes to several gigabytes of data, but certainly not terabytes.
Complex queries. The Kubernetes API is predictable in its access patterns: most objects are accessed by type, namespace, and sometimes by name. If there is additional filtering, it is usually done by tags or annotations. SQL's capabilities with joins and complex analytical queries are overkill for the API.
Traditional SQL databases are optimized for strong consistency with large and complex data sets, but it is often difficult to achieve high availability and consistent performance out of the box. Thus, they are not very suitable for using the Kubernetes API.
etcd
According to the information on his websiteetcd is a “strongly consistent distributed key-value store.”
Let's figure out what this means:
Strong consistency. etcd has strict serializability (strict serializability). It means a sequential global ordering of events. In practice, once a write from one client has completed successfully, the other client will never see stale data before the write. (This cannot be said about final consistent NoSQL databases).
Distribution. Unlike traditional SQL databases, etcd is designed from the ground up to work with multiple nodes. etcd is specially designed to achieve high availability (though not 100%) without loss of consistency.
Key-value store. Unlike SQL databases, etcd's data model is simple and includes keys and values instead of arbitrary data relationships. This helps it provide relatively predictable performance, at least compared to traditional SQL databases.
In addition, etcd has another killer feature that Kubernetes actively uses – change notifications.
Etcd allows clients to subscribe to changes to a specific key or set of keys.
Given these capabilities, etcd is relatively easy to deploy (when talking about distributed databases). That's why it was chosen for Kubernetes.
It's worth noting that etcd is not the only distributed key-value store available with similar characteristics. There are other options: Apache ZooKeeper And HashiCorp Consul.
How etcd works
The secret to balancing strong consistency and high availability etcd is Raft algorithm.
Raft solves a specific problem: how can multiple independent processes agree on a single meaning for something?
In computer science this problem is known as distributed consensus; it was decided Paxos algorithm Leslie Lamport, which is effective but notoriously difficult to understand and implement in practice.
Raft was designed to solve similar problems as Paxos, but in a much clearer way.
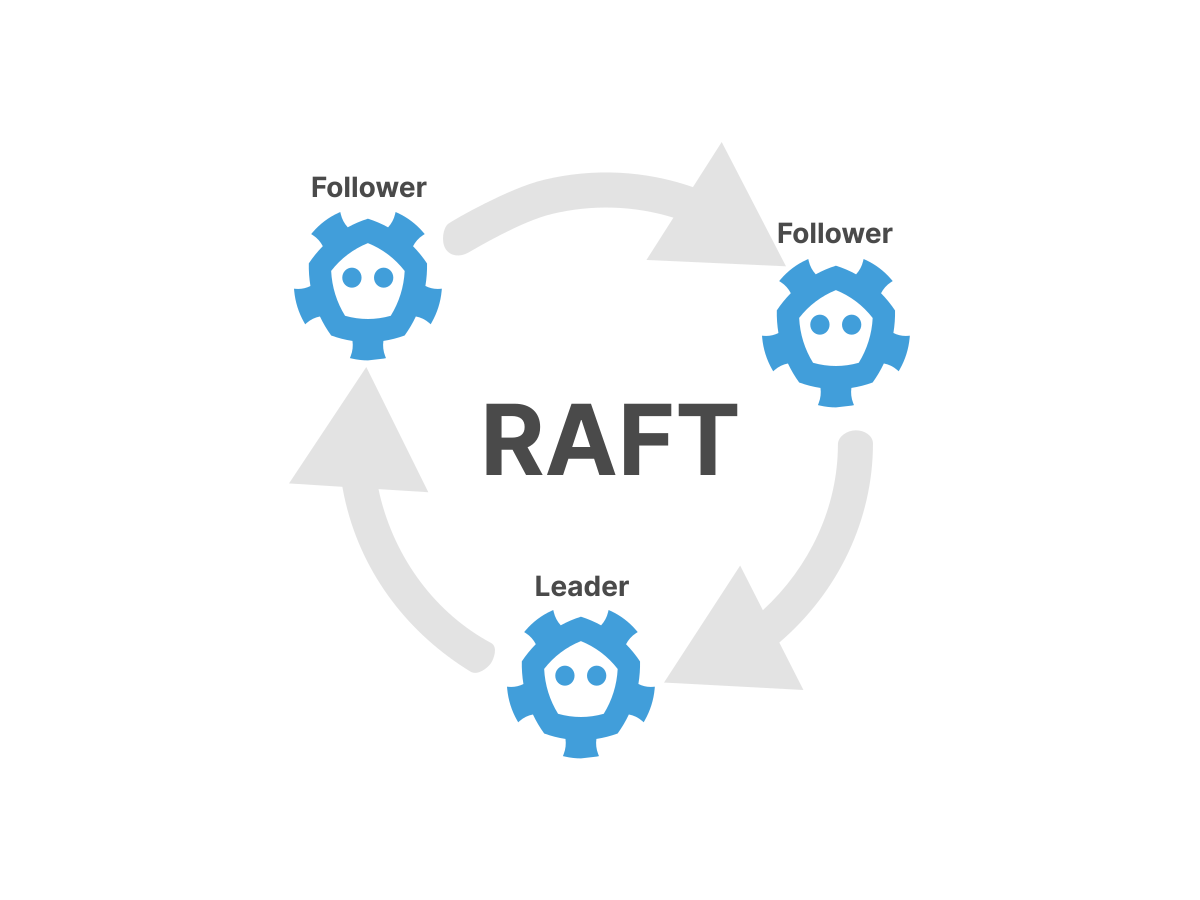
Raft selects a leader among a set of nodes and forces all write requests to go to the leader.
Here's how it happens:


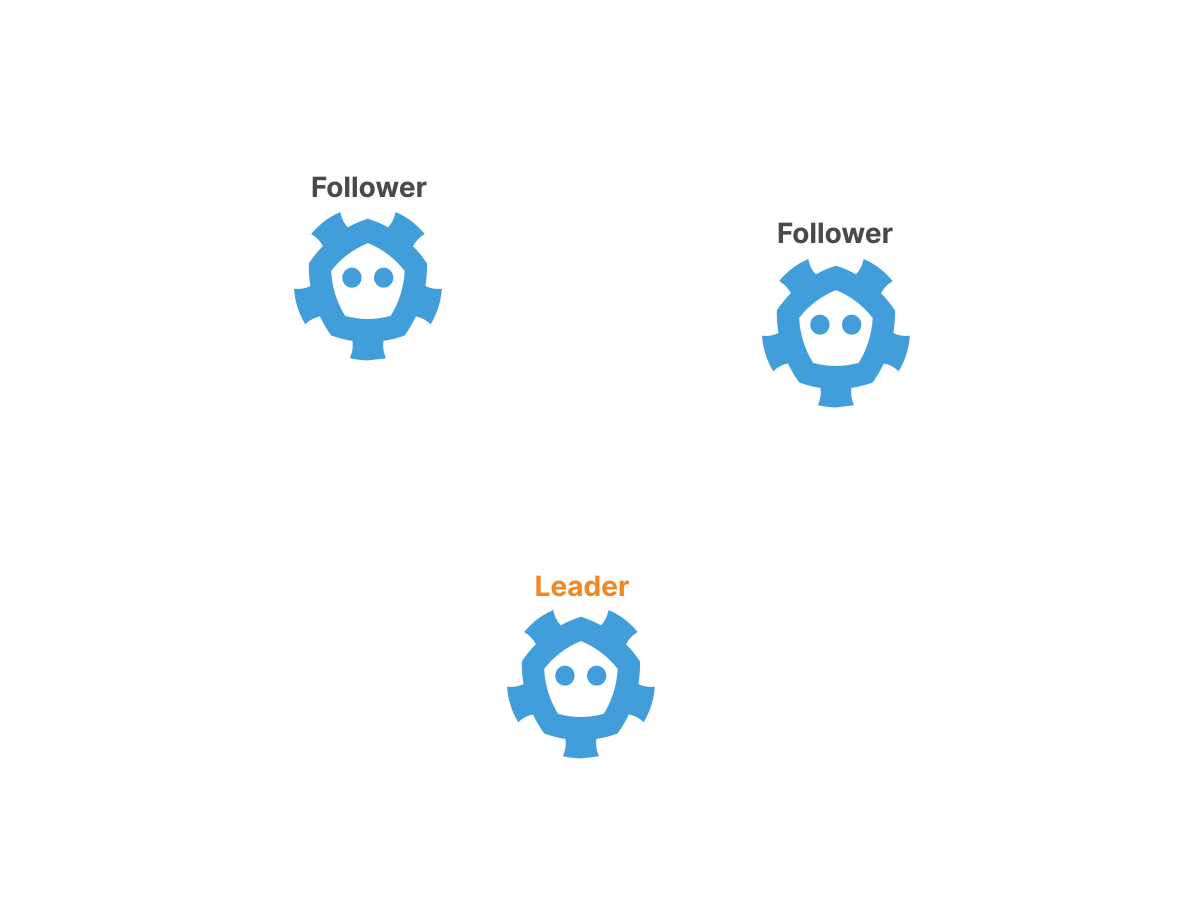
The changes are then replicated from the leader to all other nodes. If the leader ever switches off, a new vote is held and a new leader is chosen.
If you're interested in the details, here's a great one visual explanation. Original Raft article is also relatively easy to understand and worth reading.
Thus, in the etcd cluster at any given time there is a single leader node (which was chosen using the Raft protocol).
The recorded data follows the same path:
The client can send a write request to any etcd node in the cluster.
If the client contacts the leader node, the recording will be completed and replicated to other nodes.
If the client has chosen a non-leader node, then the write request will be redirected to the leader and then the record will be redirected and replicated to other nodes, as in point 2.
After successful completion of the recording, a confirmation is sent to the client.

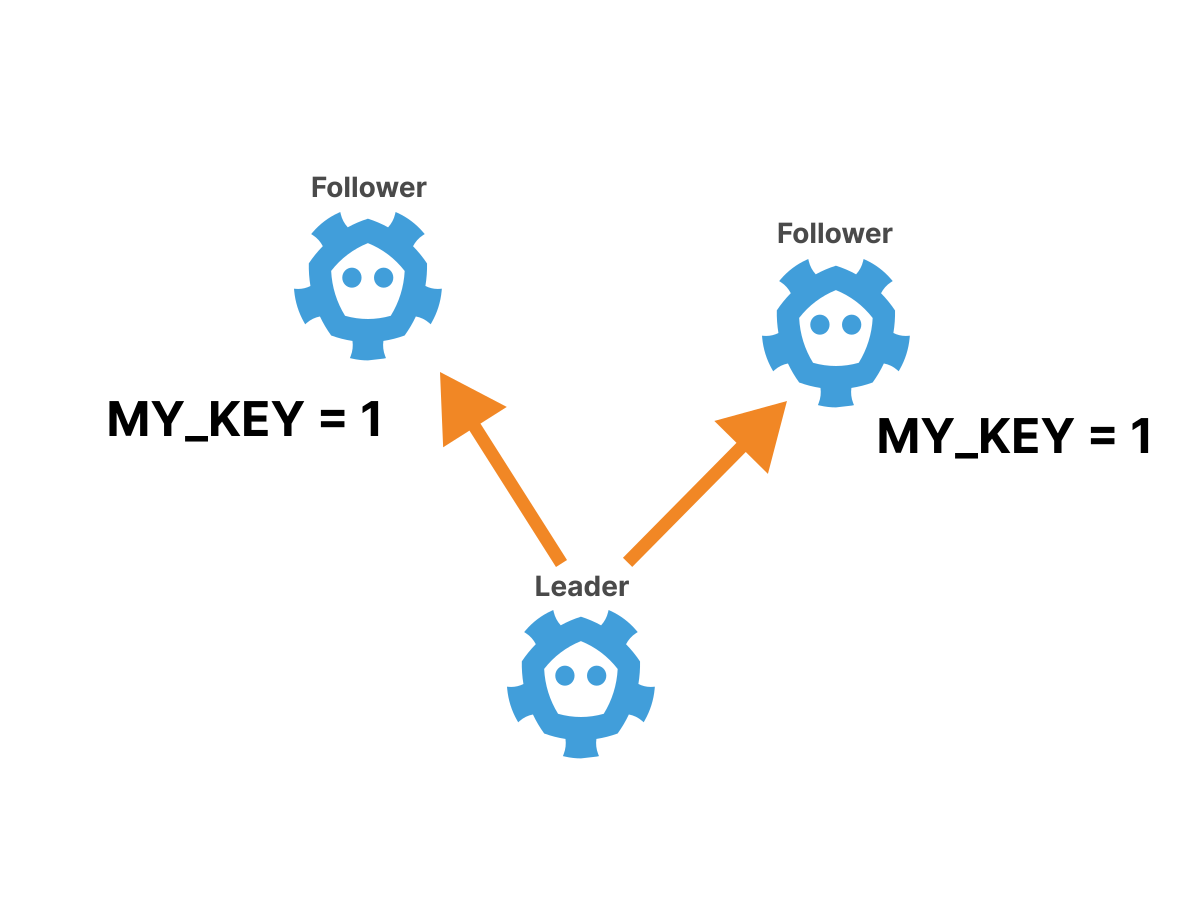

Read requests follow the same main path, although as an optimization it is possible to allow read requests to be executed on replica nodes by refusing linearity.
If the cluster leader goes offline for any reason, a new vote is held so that the cluster can remain online.
It is important that in order to elect a new leader, a majority of nodes (2/3, 4/6, etc.) must agree, and if a majority cannot be achieved, the entire cluster will be unavailable.
In practice this means that etcd will remain available as long as most nodes are online.
How many nodes should there be in an etcd cluster to ensure “good enough” availability?
As with most design questions, the answer is that it depends on the situation, but by looking at a quick table, a rule of thumb is:
Total number of nodes | Allowable number of failures among nodes |
1 | 0 |
2 | 0 |
3 | 1 |
4 | 1 |
5 | 2 |
6 | 2 |
From this table it is immediately obvious that adding one node to a cluster with an odd number of nodes does not increase availability.
For example, clusters with three or four nodes will only be able to withstand the failure of one node, so adding a fourth node is pointless.
Therefore, a good rule of thumb is to use an odd number of etcd nodes in the cluster.
How many nodes is correct?
Again, the answer depends on the circumstances, but it is important to remember that all writes must be replicated to the slave nodes. As more nodes are added to the cluster, this process will become slower.
Thus, it is necessary to find a trade-off between availability and performance: the more nodes you add, the better the availability of the cluster, but the worse the performance.
In practice, typical production etcd clusters usually have 3 or 5 nodes.
etcd in practice
Now that we've seen etcd in theory, let's see how to use it in practice. Let's start with something simple.
We can download etcd binaries directly from it release pages.
Here's an example for Linux:
curl -LO https://github.com/etcd-io/etcd/releases/download/v3.5.0/etcd-v3.5.0-linux-amd64.tar.gz
tar xzvf etcd-v3.5.0-linux-amd64.tar.gz
cd etcd-v3.5.0-linux-amd64
If you look at the contents of the release, you will see three binary files (along with documentation):
etcdwhich runs the actual etcd server.etcdctlwhich is a client binary for communicating with the server.etcdutlwhich provides some helper utilities for operations such as backup.
Starting an etcd “cluster” from one node is as easy as running the command:
./etcd
...
{"level":"info","caller":"etcdserver/server.go:2027","msg":"published local member..." }
{"level":"info","caller":"embed/serve.go:98","msg":"ready to serve client requests"}
{"level":"info","caller":"etcdmain/main.go:47","msg":"notifying init daemon"}
{"level":"info","caller":"etcdmain/main.go:53","msg":"successfully notified init daemon"}
{"level":"info","caller":"embed/serve.go:140","msg":"serving client traff...","address":"127.0.0.1:2379"}
From the logs it is clear that etcd has already created a “cluster” and has begun to serve traffic on the port unsafely 127.0.0.1:2379.
To interact with this running “cluster” you can use the binary etcdctl.
One complication to consider is that the etcd API has changed significantly between versions 2 and 3.
To use the new API, before starting etcdctl you need to explicitly set the environment variable.
To use API version 3, you can use the following command in each terminal window:
export ETCDCTL_API=3Now you can use etcdctl to write and read key-value data:
./etcdctl put foo bar
OK
./etcdctl get foo
foo
bar
As you can see the command etcdctl get will display the key and value. You can use a flag --print-value-onlyto disable this behavior.
To get a more detailed answer you can use the option --write-out=json.
./etcdctl get --write-out=json foo
{
  "header": {
    "cluster_id": 14841639068965180000,
    "member_id": 10276657743932975000,
    "revision": 2,
    "raft_term": 2
  },
  "kvs": [
    {
      "key": "Zm9v",
      "create_revision": 2,
      "mod_revision": 2,
      "version": 1,
      "value": "YmFy"
    }
  ],
  "count": 1
}
Here you can see the metadata that etcd supports.
The data looks like this:
version: 1create_revision: 2mod_revision: 2
IN etcd documentation The meaning of these parameters is explained: version refers to the version of a specific key.
In contrast, different meanings revision refer to global audit the entire cluster.
Every time a write operation occurs on the cluster, etcd creates a new version of its data set and the revision number is incremented.
This system is known as multiversion concurrency control (Multi-Version Concurrency Control), or MVCC for short.
It's also worth noting that both the key and value are returned base64 encoded. This is because keys and values in etcd are arbitrary byte arrays rather than strings.
Unlike, for example, MySQL, etcd does not have a built-in concept of string encoding.
Note that when overwritten, the version and revision number values are increased:
./etcdctl put foo baz
OK
./etcdctl get --write-out=json foo
{
  "header": {
    "cluster_id": 14841639068965180000,
    "member_id": 10276657743932975000,
    "revision": 3,
    "raft_term": 2
  },
  "kvs": [
    {
      "key": "Zm9v",
      "create_revision": 2,
      "mod_revision": 3,
      "version": 2,
      "value": "YmF6"
    }
  ],
  "count": 1
}
In particular, the fields have increased version And mod_revisionA create_revision – No.
This is logical: mod_revision refers to the revision when the key was last changed, and create_revision – to the revision when it was created.
etcd also allows you to perform “time travel” using the command --revwhich shows the value of a key that existed in a specific cluster revision:
./etcdctl get foo --rev=2 --print-value-only
bar
./etcdctl get foo --rev=3 --print-value-only
baz
As you might expect, keys can be deleted. Team – etcdctl del:
./etcdctl del foo
1
./etcdctl get foo
1returned by the commandetcdctl deldenotes the number of removed keys.
But deletion is not permanent, and you can still “time travel” to the state before the key was deleted using a flag --rev:
./etcdctl get foo --rev=3 --print-value-only
baz
Returning Multiple Results
One of the great features of etcd is the ability to return multiple values at once. To try this, first create some keys and values:
./etcdctl put myprefix/key1 thing1
OK
./etcdctl put myprefix/key2 thing2
OK
./etcdctl put myprefix/key3 thing3
OK
./etcdctl put myprefix/key4 thing4
OK
If you pass two arguments to the command etdctctl get, it will query the range and return all key-value pairs in that range. Here's an example:
./etcdctl get myprefix/key2 myprefix/key4
myprefix/key2
thing2
myprefix/key3
thing3
Here etcd returns all the keys from myprefix/key2 before myprefix/key4including the start key but excluding the end key.
Another way to get multiple values is to use the command --prefixwhich (unsurprisingly) returns all keys with a certain prefix.
This is how you get all the key-value pairs that start with myprefix/:
./etcdctl get --prefix myprefix/
myprefix/key1
thing1
myprefix/key2
thing2
myprefix/key3
thing3
myprefix/key4
thing4
Please note that in this case in the symbol
/there's nothing special and--prefix myprefix/keyworks just as well.
Believe it or not, you've already seen most of what etcd has to offer in terms of database capabilities!
There are several more options for transactionsordering keys, and limiting responses, but at its core, etcd's data model is extremely simple.
However, etcd has a few more interesting features.
Monitoring Changes
One of the key features of etcd that you haven't seen yet is the command etcdctl watchwhich works more or less the same as etcdctl getbut passes the changes back to the client.
Let's see how it works!
In one terminal window, watch changes to everything that has a prefix myprefix/:
./etcdctl watch --prefix myprefix/Then, in another terminal window, change some data and see what happens:
./etcdctl put myprefix/key1 anewthing
OK
./etcdctl put myprefix/key5 thing5
OK
./etcdctl del myprefix/key5
1
./etcdctl put notmyprefix/key thing
OK
In the original window you should see a stream of all the changes that have occurred to the prefix myprefixeven for keys that didn't previously exist:
PUT
myprefix/key1
anewthing
PUT
myprefix/key5
thing5
DELETE
myprefix/key5
Please note that updating a key starting with
notmyprefixwas not transmitted to the subscriber.
But the team watch isn't limited to just real-time changes – you can also see the “time travel” version of events using the option --revwhich will transmit all changes starting from this revision.
Let's see the history of the key foo from the previous example:
./etcdctl watch --rev=2 foo
PUT
foo
bar
PUT
foo
baz
DELETE
foo
This convenient feature allows customers to be confident that they will not miss out on updates if they are not available online.
Setting up an etcd cluster with multiple nodes
Until now, your etcd “cluster” consisted of only one node, which is not particularly interesting.
Let's set up a 3-node cluster and see how high availability works in practice!
In a real cluster, all the nodes will be on different servers, but you can set up a cluster by placing all the nodes on one computer and assigning unique ports to each node.
First, let's create data directories for each node:
mkdir -p /tmp/etcd/data{1..3}When setting up an etcd cluster, you need to know the IP addresses and ports of the nodes in advance so that the nodes can detect each other.
Let's bind all three nodes to localhost, assign the “client” ports (ports that clients use to connect) to 2379, 3379 and 4379, and the “peer” ports (ports used between etcd nodes) to 2380, 3380 and 4380.
Starting the first etcd node comes down to setting the correct CLI flags:
./etcd --data-dir=/tmp/etcd/data1 --name node1 \
  --initial-advertise-peer-urls http://127.0.0.1:2380 \
  --listen-peer-urls http://127.0.0.1:2380 \
  --advertise-client-urls http://127.0.0.1:2379 \
  --listen-client-urls http://127.0.0.1:2379 \
  --initial-cluster node1=http://127.0.0.1:2380,node2=http://127.0.0.1:3380,node3=http://127.0.0.1:4380 \
  --initial-cluster-state new \
  --initial-cluster-token mytoken
Let's look at some of these parameters:
--name: This parameter specifies the name of a specific node.--listen-peer-urlsAnd--initial-advertise-peer-urls: These parameters define the URLs on which the node will listen for node-to-node traffic.--advertise-client-urlsAnd--listen-client-urls: These parameters define the URLs where the node will listen for client traffic.--initial-cluster-token: This option sets a common token for the cluster to prevent nodes from accidentally joining the wrong cluster.--initial-cluster: This is where you provide etcd with the complete initial configuration of the cluster so that the nodes can find each other and start communicating.
Launching a second node is very similar. Run it in a new terminal:
./etcd --data-dir=/tmp/etcd/data2 --name node2 \
  --initial-advertise-peer-urls http://127.0.0.1:3380 \
  --listen-peer-urls http://127.0.0.1:3380 \
  --advertise-client-urls http://127.0.0.1:3379 \
  --listen-client-urls http://127.0.0.1:3379 \
  --initial-cluster node1=http://127.0.0.1:2380,node2=http://127.0.0.1:3380,node3=http://127.0.0.1:4380 \
  --initial-cluster-state new \
  --initial-cluster-token mytoken
And run the third node in the third terminal:
./etcd --data-dir=/tmp/etcd/data3 --name node3 \
  --initial-advertise-peer-urls http://127.0.0.1:4380 \
  --listen-peer-urls http://127.0.0.1:4380 \
  --advertise-client-urls http://127.0.0.1:4379 \
  --listen-client-urls http://127.0.0.1:4379 \
  --initial-cluster node1=http://127.0.0.1:2380,node2=http://127.0.0.1:3380,node3=http://127.0.0.1:4380 \
  --initial-cluster-state new \
  --initial-cluster-token mytoken
To communicate with the etcd cluster you must specify etcdctlwhich endpoints should communicate with using the option --endpointswhich is simply a list of etcd endpoints (equivalent --listen-client-urlsmentioned earlier).
Let's check that all nodes have successfully joined using the command member list.
export ENDPOINTS=127.0.0.1:2379,127.0.0.1:3379,127.0.0.1:4379
./etcdctl --endpoints=$ENDPOINTS member list --write-out=table
+------------------+---------+-------+-----------------------+-----------------------+------------+
|        ID        | STATUS  | NAME  |      PEER ADDRS       |     CLIENT ADDRS      | IS LEARNER |
+------------------+---------+-------+-----------------------+-----------------------+------------+
| 3c969067d90d0e6c | started | node1 | http://127.0.0.1:2380 | http://127.0.0.1:2379 |      false |
| 5c5501077e83a9ee | started | node3 | http://127.0.0.1:4380 | http://127.0.0.1:4379 |      false |
| a2f3309a1583fba3 | started | node2 | http://127.0.0.1:3380 | http://127.0.0.1:3379 |      false |
+------------------+---------+-------+-----------------------+-----------------------+------------+
You can see that all three nodes have successfully joined the cluster!
Ignore the field
IS LEARNERit belongs to a special type of node called learner node. They have their own specialized use case.
Let's confirm that the cluster can indeed read and write data:
./etcdctl --endpoints=$ENDPOINTS put mykey myvalue
OK
./etcdctl --endpoints=$ENDPOINTS get mykey
mykey
myvalue
What happens if one of the nodes fails?
Let's kill the first etcd process (using Ctrl-C) and find out!
The first thing you need to check after killing the first node is the command member listbut the result is a little surprising:
./etcdctl --endpoints=$ENDPOINTS member list --write-out=table
+------------------+---------+-------+-----------------------+-----------------------+------------+
|        ID        | STATUS  | NAME  |      PEER ADDRS       |     CLIENT ADDRS      | IS LEARNER |
+------------------+---------+-------+-----------------------+-----------------------+------------+
| 3c969067d90d0e6c | started | node1 | http://127.0.0.1:2380 | http://127.0.0.1:2379 |      false |
| 5c5501077e83a9ee | started | node3 | http://127.0.0.1:4380 | http://127.0.0.1:4379 |      false |
| a2f3309a1583fba3 | started | node2 | http://127.0.0.1:3380 | http://127.0.0.1:3379 |      false |
+------------------+---------+-------+-----------------------+-----------------------+------------+
All three members are still present even though we killed node1. The confusing thing is that all members of the cluster are listed, regardless of their state.
To check the status of cluster members, use the command endpoint statuswhich shows the current state of each endpoint:
./etcdctl --endpoints=$ENDPOINTS endpoint status --write-out=table
{
  "level": "warn",
  "ts": "2021-06-23T15:43:40.378-0700",
  "logger": "etcd-client",
  "caller": "v3/retry_interceptor.go:62",
  "msg": "retrying of unary invoker failed",
  "target": "etcd-endpoints://0xc000454700/#initially=[127.0.0.1:2379;127.0.0.1:3379;127.0.0.1:4379]",
  "attempt": 0,
  "error": "rpc error: code = DeadlineExceeded ... connect: connection refused\""
}
Failed to get the status of endpoint 127.0.0.1:2379 (context deadline exceeded)
+----------------+------------------+-----------+------------+--------+
|    ENDPOINT    |        ID        | IS LEADER | IS LEARNER | ERRORS |
+----------------+------------------+-----------+------------+--------+
| 127.0.0.1:3379 | a2f3309a1583fba3 |      true |      false |        |
| 127.0.0.1:4379 | 5c5501077e83a9ee |     false |      false |        |
+----------------+------------------+-----------+------------+--------+
Here you will see a warning about a faulty node and some interesting information about the current state of each node.
But does the cluster work?
Theoretically it should (since most nodes are still online), so let's check:
./etcdctl --endpoints=$ENDPOINTS get mykey
mykey
myvalue
./etcdctl --endpoints=$ENDPOINTS put mykey newvalue
OK
./etcdctl --endpoints=$ENDPOINTS get mykey
mykey
newvalue
Everything looks good: both reading and writing work!
And if you return the original node (using the same command as before) and check again endpoint statusthen you can see that the node quickly restores communication with the cluster:
./etcdctl --endpoints=$ENDPOINTS endpoint status --write-out=table
+----------------+------------------+-----------+------------+--------+
|    ENDPOINT    |        ID        | IS LEADER | IS LEARNER | ERRORS |
+----------------+------------------+-----------+------------+--------+
| 127.0.0.1:2379 | 3c969067d90d0e6c |     false |      false |        |
| 127.0.0.1:3379 | a2f3309a1583fba3 |      true |      false |        |
| 127.0.0.1:4379 | 5c5501077e83a9ee |     false |      false |        |
+----------------+------------------+-----------+------------+--------+
What happens if two nodes become unavailable?
Let's kill node1 And node2 using Ctrl-C and try again to determine endpoint status:
./etcdctl --endpoints=$ENDPOINTS endpoint status --write-out=table
{"level":"warn","ts":"2021-06-23T15:47:05.803-0700","logger":"etcd-client","caller":"v3/retry_i ...}
Failed to get the status of endpoint 127.0.0.1:2379 (context deadline exceeded)
{"level":"warn","ts":"2021-06-23T15:47:10.805-0700","logger":"etcd-client","caller":"v3/retry_i ...}
Failed to get the status of endpoint 127.0.0.1:3379 (context deadline exceeded)
+----------------+------------------+-----------+------------+-----------------------+
|    ENDPOINT    |        ID        | IS LEADER | IS LEARNER |        ERRORS         |
+----------------+------------------+-----------+------------+-----------------------+
| 127.0.0.1:4379 | 5c5501077e83a9ee |     false |      false | etcdserver: no leader |
+----------------+------------------+-----------+------------+-----------------------+
This time, an error message appears stating that the leader is not available.
If you try to read or write to the cluster you will simply get errors:
./etcdctl --endpoints=$ENDPOINTS get mykey
{
  "level": "warn",
  "ts": "2021-06-23T15:48:31.987-0700",
  "logger": "etcd-client",
  "caller": "v3/retry_interceptor.go:62",
  "msg": "retrying of unary invoker failed",
  "target": "etcd-endpoints://0xc0001da000/#initially=[127.0.0.1:2379;127.0.0.1:3379;127.0.0.1:4379]",
  "attempt": 0,
  "error": "rpc error: code = Unknown desc = context deadline exceeded"
}
./etcdctl --endpoints=$ENDPOINTS put mykey anewervalue
{
  "level": "warn",
  "ts": "2021-06-23T15:49:04.539-0700",
  "logger": "etcd-client",
  "caller": "v3/retry_interceptor.go:62",
  "msg": "retrying of unary invoker failed",
  "target": "etcd-endpoints://0xc000432a80/#initially=[127.0.0.1:2379;127.0.0.1:3379;127.0.0.1:4379]",
  "attempt": 0,
  "error": "rpc error: code = DeadlineExceeded desc = context deadline exceeded"
}
Error: context deadline exceeded
But if you return these two nodes to their original state (using the original commands), everything will quickly return to normal:
./etcdctl --endpoints=$ENDPOINTS endpoint status --write-out=table
+----------------+------------------+-----------+------------+--------+
|    ENDPOINT    |        ID        | IS LEADER | IS LEARNER | ERRORS |
+----------------+------------------+-----------+------------+--------+
| 127.0.0.1:2379 | 3c969067d90d0e6c |     false |      false |        |
| 127.0.0.1:3379 | a2f3309a1583fba3 |     false |      false |        |
| 127.0.0.1:4379 | 5c5501077e83a9ee |      true |      false |        |
+----------------+------------------+-----------+------------+--------+
./etcdctl --endpoints=$ENDPOINTS get mykey
mykey
newvalue
A new leader is elected and the cluster is up and running again. Fortunately, there was no data loss, although there was some downtime.
Kubernetes and etcd
Now that you know how etcd works in general, let's look at how Kubernetes uses etcd internally.
These examples will use minikubebut production-ready Kubernetes settings should work very similarly.
To see etcd in action, launch minikube, connect to it via SSH and download etcdctl the same as before:
minikube start
minikube ssh
curl -LO https://github.com/etcd-io/etcd/releases/download/v3.5.0/etcd-v3.5.0-linux-amd64.tar.gz
tar xzvf etcd-v3.5.0-linux-amd64.tar.gz
cd etcd-v3.5.0-linux-amd64
Unlike the test setup, minikube deploys etcd with mutual TLS authenticationso you need to provide TLS certificates and keys with every request.
It's a little tedious, but a Bash variable can help speed up the process:
export ETCDCTL=$(cat <<EOF
sudo ETCDCTL_API=3 ./etcdctl --cacert /var/lib/minikube/certs/etcd/ca.crt \n
  --cert /var/lib/minikube/certs/etcd/healthcheck-client.crt \n
  --key /var/lib/minikube/certs/etcd/healthcheck-client.key
EOF
)
The certificate and keys used here are generated by minikube during the initial boot of the Kubernetes cluster. They are intended for use with etcd healthchecks, but are also good for debugging.
Then you can run the commands etcdctl in the following way:
$ETCDCTL member list --write-out=table
+------------------+---------+----------+---------------------------+---------------------------+------------+
|        ID        | STATUS  |   NAME   |        PEER ADDRS         |       CLIENT ADDRS        | IS LEARNER |
+------------------+---------+----------+---------------------------+---------------------------+------------+
| aec36adc501070cc | started | minikube | https://192.168.49.2:2380 | https://192.168.49.2:2379 |      false |
+------------------+---------+----------+---------------------------+---------------------------+------------+
As you can see, there is one etcd node running in the minikube cluster.
How does the Kubernetes API store data in etcd?
A little research showed that almost all Kubernetes data is prefixed /registry:
$ETCDCTL get --prefix /registry | wc -l
5882
Additional research showed that pod definitions are under the prefix /registry/pods:
$ETCDCTL get --prefix /registry/pods | wc -l
412
The naming scheme is: /registry/pods/<namespace>/<pod-name>.
Here you can see the definition of the pod's scheduler:
$ETCDCTL get --prefix /registry/pods/kube-system/ --keys-only | grep scheduler
/registry/pods/kube-system/kube-scheduler-minikube
The option used here is
--keys-onlywhich, as you'd expect, only returns query keys.
What does the actual data look like? Let's explore:
$ETCDCTL get /registry/pods/kube-system/kube-scheduler-minikube | head -6
/registry/pods/kube-system/kube-scheduler-minikube
k8s

v1Pod�
�
kube-scheduler-minikube�
                        kube-system"*$f8e4441d-fb03-4c98-b48b-61a42643763a2��نZ
Looks like a bit of a mess!
This is because the Kubernetes API stores actual object definitions in a binary format rather than in a human-readable form.
If you want to see the object specification in a readable format such as JSON, you need to call the API rather than calling etcd directly.
Now the etcd key naming scheme in Kubernetes should be completely clear: it allows the API to query or track all objects of a certain type in a particular namespace by querying the etcd prefix.
This is a common practice in Kubernetes, and is how Kubernetes controllers and operators subscribe to changes to the objects they care about.
Let's try to subscribe to pod changes in the namespace defaultto see it in action.
First use the command watch with the appropriate prefix:
$ETCDCTL watch --prefix /registry/pods/default/ --write-out=jsonThen, in another terminal, create a pod and see what happens:
kubectl run --namespace=default --image=nginx nginx
pod/nginx created
You should see multiple JSON messages in the etcd watch output, one for each change in pod status (for example, going from Pending to Scheduled to Running).
Each message should look something like this:
{
  "Header": {
    "cluster_id": 18038207397139143000,
    "member_id": 12593026477526643000,
    "revision": 935,
    "raft_term": 2
  },
  "Events": [
    {
      "kv": {
        "key": "L3JlZ2lzdHJ5L3BvZHMvZGVmYXVsdC9uZ2lueA==",
        "create_revision": 935,
        "mod_revision": 935,
        "version": 1,
        "value": "azh...ACIA"
      }
    }
  ],
  "CompactRevision": 0,
  "Canceled": false,
  "Created": false
}
To satisfy curiosity about what the data actually contains, you can run the value through xxdto explore interesting lines. For example:
$ETCDCTL get /registry/pods/default/nginx --print-value-only | xxd | grep -A2 Run
00000600: 5072 696f 7269 7479 1aba 030a 0752 756e  Priority.....Run
00000610: 6e69 6e67 1223 0a0b 496e 6974 6961 6c69  ning.#..Initiali
00000620: 7a65 6412 0454 7275 651a 0022 0808 e098  zed..True.."....
From this we can conclude that the Pod you created currently has the status Running.
In the real world, you will rarely interact with etcd directly in this way, but will instead subscribe to changes through the Kubernetes API.
But it's easy to imagine how the API interacts with etcd using just such requests.
Replacing etcd
etcd works great on thousands of real-world Kubernetes clusters, but it may not be the best tool for all use cases.
For example, if you need an extremely lightweight cluster for testing or embedded environments, etcd may be overkill.
That's the idea k3s — a lightweight Kubernetes distribution designed specifically for such use cases.
One of the distinctive features that sets k3s apart from vanilla Kubernetes is its ability to replace etcd with SQL databases.
The default backend is SQLite, which is an ultra-lightweight built-in SQL library.
This allows users to run Kubernetes without having to worry about managing an etcd cluster.
How does k3s do this?
The Kubernetes API doesn't offer a way to replace databases—etcd is fairly hard-coded into the codebase.
To be able to connect other databases to k3s, it would be possible to rewrite the Kubernetes API. This could work, but it would impose a huge maintenance burden.
Instead, k3s uses a special project called Kine (which means “Kine is not etcd”).
Kine is a shim that translates etcd API calls into actual SQL queries.

Because the etcd data model is so simple, translation is relatively easy.
For example, here is a template for listing keys by prefix in Kine SQL Driver:
SELECT (%s), (%s), %s
FROM kine AS kv
JOIN (
  SELECT MAX(mkv.id) AS id
  FROM kine AS mkv
  WHERE
    mkv.name LIKE ?
    %%s
  GROUP BY mkv.name) maxkv
ON maxkv.id = kv.id
WHERE
    (kv.deleted = 0 OR ?)
ORDER BY kv.id ASC
Kine uses a single table that stores keys, values, and some additional metadata. Queries with a prefix are simply translated into SQL LIKE requests.
Of course, since Kine uses SQL, it won't have the same performance or availability characteristics as etcd.
Apart from SQLite, Kine can also use MySQL or PostgreSQL as a backend.
Why do this?
Sometimes the best database is the one managed by someone else!
Let's say your company has a team of database administrators with extensive experience working with production-ready SQL databases.
In this case, it may make sense to use this experience instead of managing etcd yourself (again, with the caveat that the availability and performance characteristics may not be equivalent to etcd).
Conclusion
It's always interesting to look under the hood of Kubernetes, and etcd is one of the most important pieces of the Kubernetes puzzle.
In etcd, Kubernetes stores all information about the state of the cluster. In fact, it is the only stateful part of the Kubernetes control plane.
etcd provides a feature set that is ideal for Kubernetes.
It is highly consistent so can act as a central coordinator for the cluster, but is also highly available thanks to the Raft consensus algorithm.
And the ability to stream changes to clients is a killer feature that helps all components of a Kubernetes cluster stay in sync.
While etcd works well with Kubernetes, as Kubernetes begins to be used in more unusual environments (such as embedded systems), it may not always be the ideal choice.
Projects like Kine allow you to replace etcd with another database where it makes sense.
If you're learning Kubernetes and are drowning in documentation trying to find answers to your questions, come to Slurm for Kubernetes courses. Kubernetes Base — starter course for administrators. It will help you get acquainted with components and abstractions, gain first experience in setting up a cluster and running applications on it. Kubernetes Mega — a course for experienced: we get under the hood of Kubernetes, study the mechanisms for ensuring stability and security.
