Efficient tracing in Go
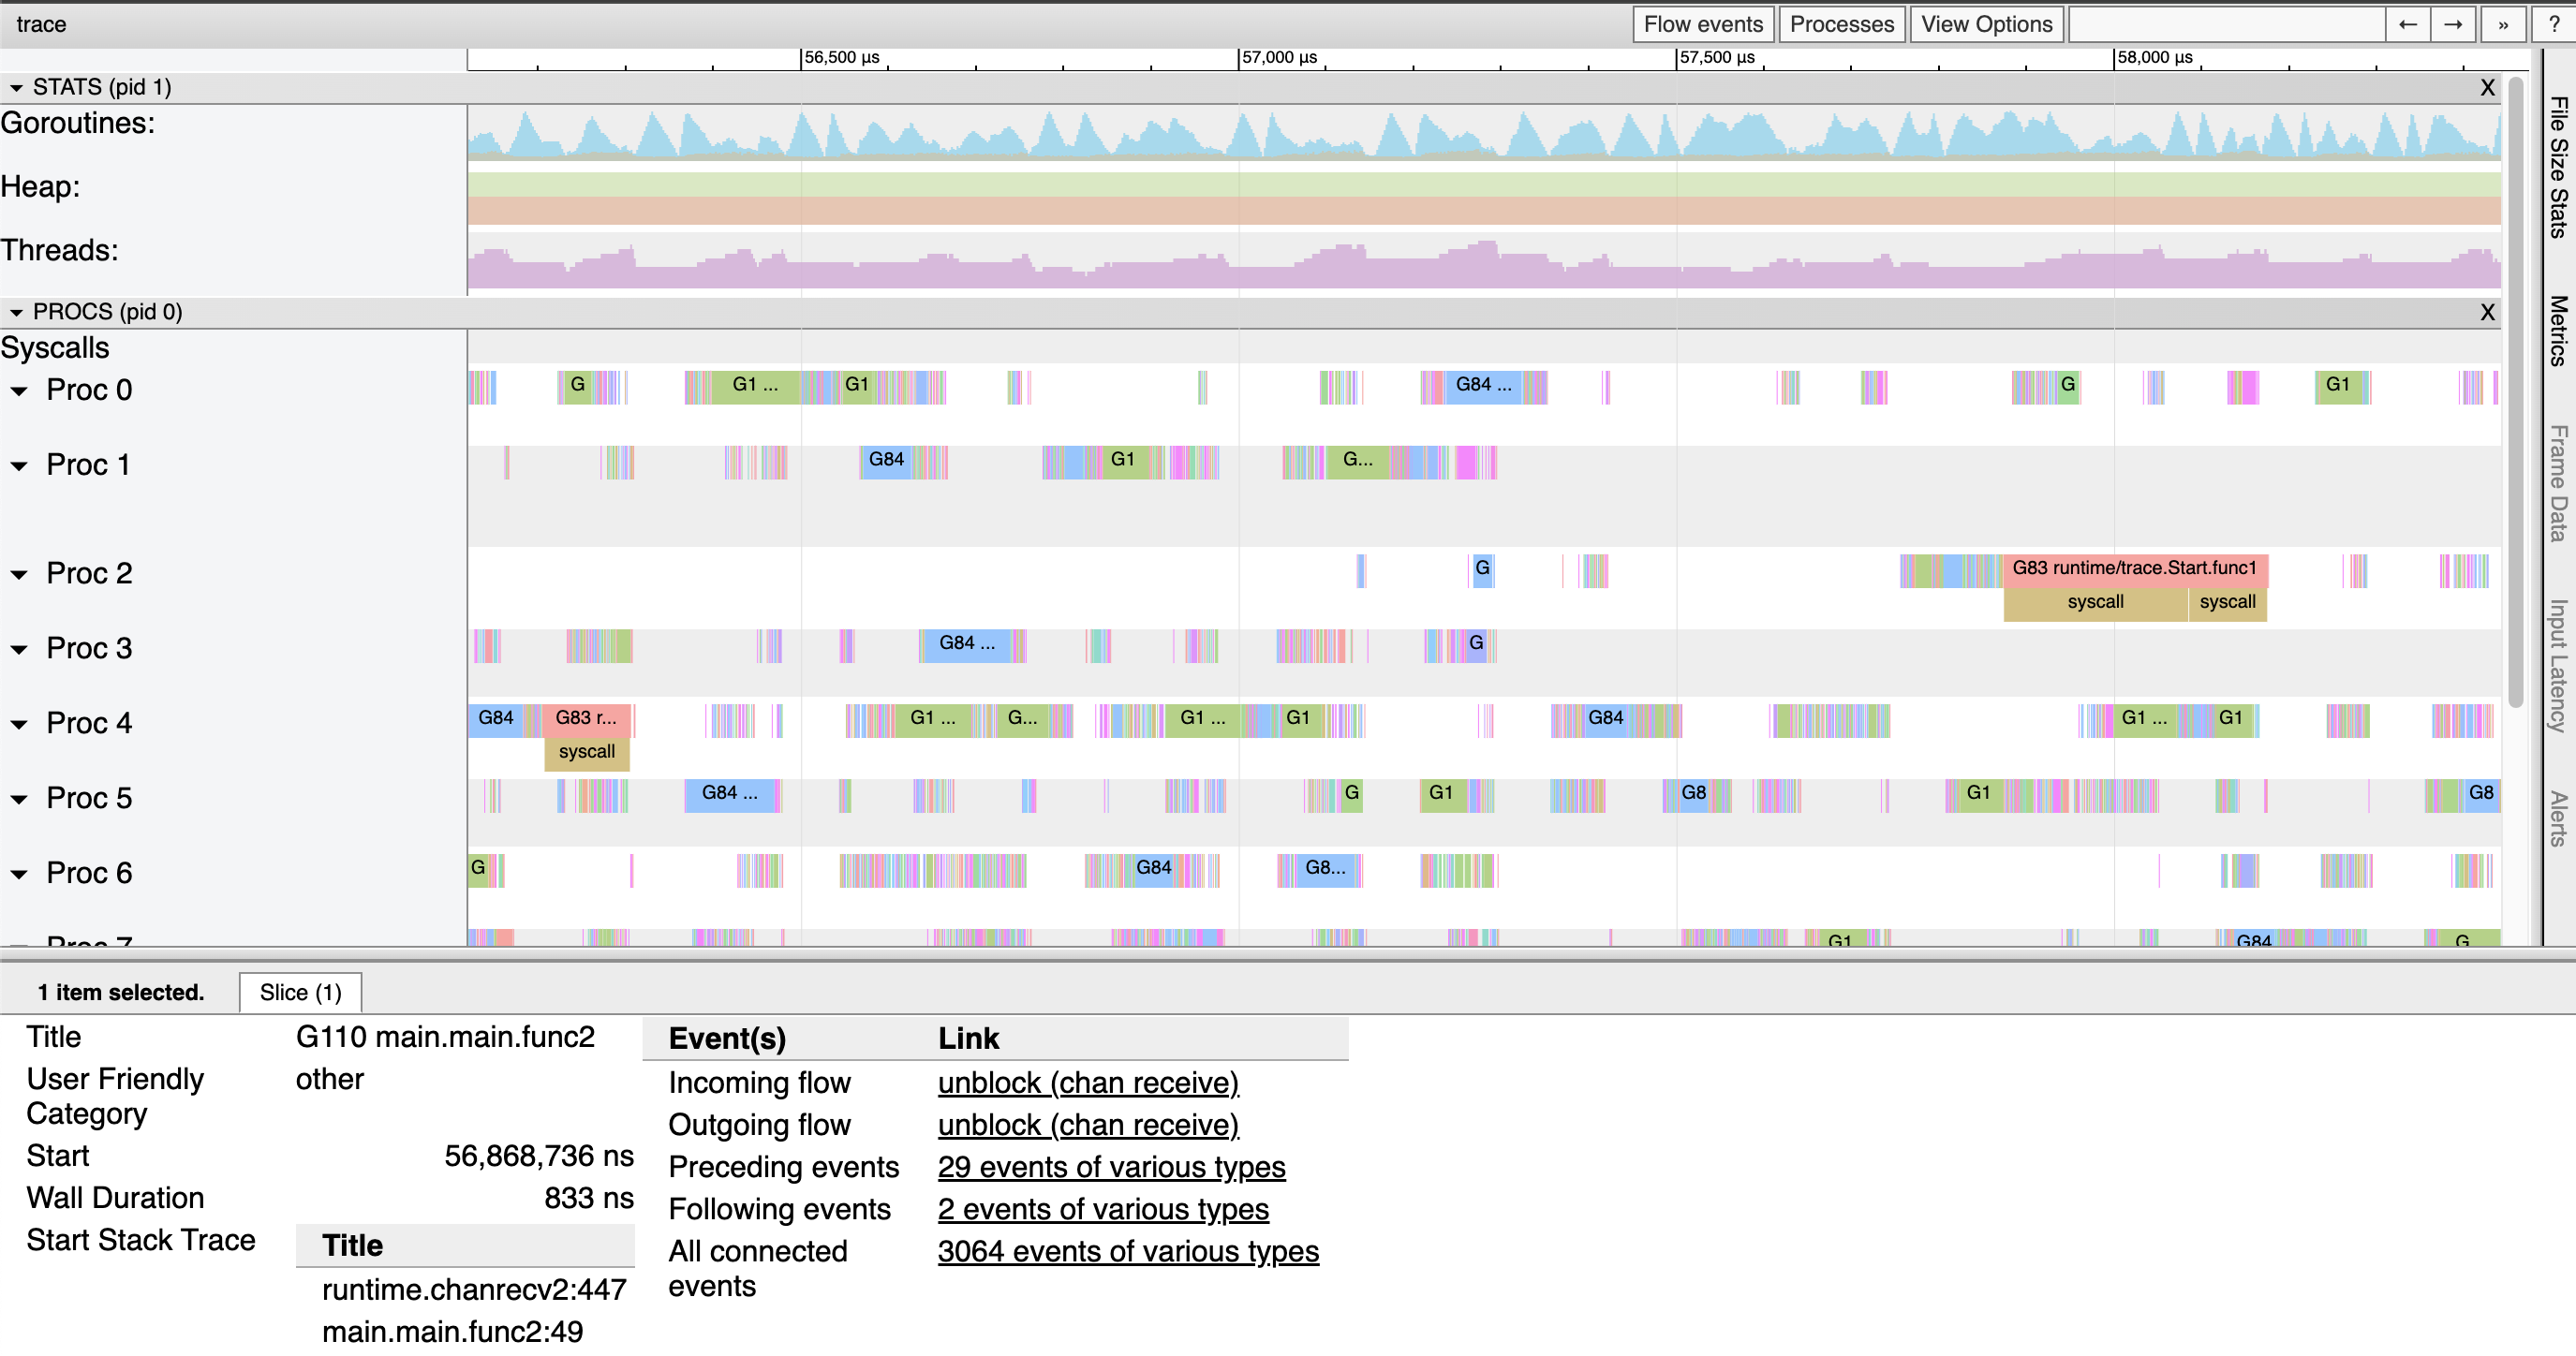
Plastic bag runtime/trace contains a powerful tool for understanding and troubleshooting Go programs. The functionality inside allows you to create a trace of the execution of each goroutine over a certain period of time. By using go tool trace (or an excellent tool gotraceui open source) you can visualize and explore the data in these traces.
The magic of tracing is that it can easily reveal things in a program that are difficult to see in other ways. For example, a parallelism bottleneck where multiple goroutines block on the same channel can be quite difficult to see in the processor profile because there is no execution for the sample. But in a trace, the lack of execution will be visible with amazing clarity, and a stack trace of blocked goroutines will quickly point to the culprit.
Go developers can even instrument their own programs with tasks, regions And logswhich they can use to correlate their high-level concerns with low-level execution details.
Problems
Unfortunately, a huge amount of information in traces may not be available. Historically, this has been hampered by four big problems.
Traces had high overhead.
Traces do not scale well and may become too large to analyze.
It was often unclear when to start tracing to capture a specific misbehavior.
Only the bravest gophers could programmatically analyze the traces, given the lack of a publicly available package for analyzing and interpreting traces.
If you've used traces in the last few years, chances are you've been frustrated by one or more of these issues. But we're happy to share that we've made great progress in all four of these areas over the last two versions of Go.
Low overhead tracing
Before Go 1.21, runtime tracing overhead was 10-20% CPU for many applications, limiting tracing to situational use rather than constant use like CPU profiling. It turned out that most of the tracing costs come from tracebacks. Many events generated by the runtime contain a stack trace, which is invaluable for determining what goroutines were doing at key points during their execution.
Thanks to the work of Felix Geisendörfer and Nick Ripley on optimizing the efficiency of tracebacks, the CPU overhead for tracing has been significantly reduced, to 1-2% for many applications. You can read more about the work done in Felix's wonderful blog post about this theme.
Scalable Traces
The format of the trace and its events was designed with relatively efficient emissions in mind, but required tools to parse and save the state of the entire trace. A trace of several hundred megabytes in size could require several gigabytes of RAM for analysis!
This problem, unfortunately, is fundamental to the way traces are generated. To reduce runtime overhead, all events are written to the equivalent of thread-local buffers. But this means that events appear out of their true order, and the burden falls on the tracing tool to figure out what actually happened.
The key to allowing tracing to scale while maintaining low overhead was to periodically split the generated trace. Each split point will behave roughly the same as disabling and re-enabling the trace at the same time. All trace data at this point is a complete and self-contained trace, and new trace data seamlessly picks up where it left off.
Fixing all this required rethinking and rewriting many of the fundamentals of tracing implementation. We're happy to announce that this work has been completed in Go 1.22 and is now publicly available. Appeared many nice improvementsincluding also some improvements in go tool trace command. If you are interested, all the details are described in project document.
(Note: go tool trace still loads the full trace into memory, but now you can remove this restriction for traces produced by Go 1.22+ programs.)
Flight recording
Let's say you are working on a web service and RPC takes a very long time. You couldn't start tracing at a time when you already knew the RPC was taking a long time because the root cause of the slow request had already happened and wasn't captured.
A technology called flight recording, which you may already be familiar with from other programming environments, can help with this. The point of flight recording is to constantly monitor and always save the latest trace data, just in case. Then, as soon as something interesting happens, the program can simply record everything it has!
Before the advent of route separation, this was practically impossible. But since continuous tracing has become viable due to low overhead, and the fact that runtime can now split traces at any time, flight recording has proven to be a piece of cake to implement.
As a result, we are pleased to announce a flight recorder experiment that is available in golang.org/x/exp/trace.
Please, try! Below is an example that sets up flight recording to capture a long HTTP request to get you started.
// Set up the flight recorder.
fr := trace.NewFlightRecorder()
fr.Start()

// Set up and run an HTTP server.
var once sync.Once
http.HandleFunc("/my-endpoint", func(w http.ResponseWriter, r *http.Request) {
	start := time.Now()

	// Do the work...
	doWork(w, r)

	// We saw a long request. Take a snapshot!
	if time.Since(start) > 300*time.Millisecond {
		// Do it only once for simplicity, but you can take more than one.
		once.Do(func() {
			// Grab the snapshot.
			var b bytes.Buffer
			_, err = fr.WriteTo(&b)
			if err != nil {
				log.Print(err)
				return
			}
			// Write it to a file.
			if err := os.WriteFile("trace.out", b.Bytes(), 0o755); err != nil {
				log.Print(err)
				return
			}
		})
	}
})
log.Fatal(http.ListenAndServe(":8080", nil))
If you have any feedback, positive or negative, please share it on proposal issue!
Trace reader API
Along with the reworking of the tracing implementation, an attempt was made to clean up other internal components, such as go tool trace. This sparked an attempt to create a trace reading API that was good enough to be shared and could make traces more accessible.
As with flight recorder, we're happy to announce that we also have an experimental API for reading traces that we'd like to share. It is available in same package as flight recorder, golang.org/x/exp/trace.
We think it's good enough to start building something new on top of it, so please give it a try! Below is an example that measures the proportion of goroutine blocking events that are blocked from waiting on the network.
// Start reading from STDIN.
r, err := trace.NewReader(os.Stdin)
if err != nil {
	log.Fatal(err)
}

var blocked int
var blockedOnNetwork int
for {
	// Read the event.
	ev, err := r.ReadEvent()
	if err == io.EOF {
		break
	} else if err != nil {
		log.Fatal(err)
	}

	// Process it.
	if ev.Kind() == trace.EventStateTransition {
		st := ev.StateTransition()
		if st.Resource.Kind == trace.ResourceGoroutine {
			id := st.Resource.Goroutine()
			from, to := st.GoroutineTransition()

			// Look for goroutines blocking, and count them.
			if from.Executing() && to == trace.GoWaiting {
				blocked++
				if strings.Contains(st.Reason, "network") {
					blockedOnNetwork++
				}
			}
		}
	}
}
// Print what we found.
p := 100 * float64(blockedOnNetwork) / float64(blocked)
fmt.Printf("%2.3f%% instances of goroutines blocking were to block on the network\n", p)
And just like with a flight recorder, there is proposal issue for your feedback!
We'd like to give special mention to Dominik Honnef as someone who tried it out early, provided great feedback, and contributed to maintaining older versions of the API.
Thank you!
This work was completed, in no small part, thanks to the assistance of those included in diagnostic working groupstarted over a year ago as a collaboration between stakeholders from across the Go community and open to the public.
We would like to take a moment to thank those community members who have attended regularly over the past year: Felix Geisendörfer, Nick Ripley, Rhys Hiltner, Dominik Honnef, Bryan Boreham, thepudds.
The discussions, feedback and work you all put in has helped us get to where we are today. Thank you!