Costing to collect Income and Expenditure Budget (I&C) fact using Power Query
If the company has not implemented management accounting automation (ERP, 1C UP, BIT FINANCE, etc.), then the only source for cost calculation remains accounting (hereinafter referred to as BU), and, in the vast majority of cases, this is 1C ACCOUNTING. For the purposes of calculating income and expenses within the framework of management accounting (hereinafter – MA), a complete transfer of information from accounting is not always correct. So, there are a number of expenses and income that need to be excluded or, on the contrary, added (technical operations) to the management system; sometimes it is necessary to add additional analytics and extras. requisites.
In any case, the process of transferring data from the accounting system to the management system is always labor-intensive, and in the classic case – when an economist forms budgets from balance sheets – it is also extremely inflexible, since any change in the data in the accounting system entails repeated data collection.
In this article, we propose to use the Power Query tool (hereinafter referred to as PQ) to collect factual data and to partially automate it. Of course, the role of the economist, the notorious human factor, will remain prevalent, but the process itself will take much less time. At the same time, the accuracy of accounting will increase.
Because in most cases, economists are far from programming, and writing any code becomes a problem for them; it is suggested to use only standard functions of the PQ interface.
Task
Simplify the process of cost calculation and income accounting for management accounting purposes from 1C ACCOUNTING
Data source
The minimum unit of information in accounting is the accounting entry; it is proposed to take it as the basis for the formation of the operating instructions, because The more information, the better analytics we can provide.
To form a control unit, we can go in two ways. The difficult one is to repost all expenses based on the Management Accounting Policy. Simple – use the costs already posted within the accounting framework.
The simple method involves a number of simplifications, because BU has its own specifics, which are not entirely suitable for the purposes of OU. So, for example, an accountant can write off inventory items from account 10 not at the time of actual expenditure of this inventory item, but (to optimize taxation) earlier or later. But the simplified method is less complicated, so this article will describe it.
To calculate costs we will need the following accounts – 20,25,26,44,91.2, to generate income – 90.1, 91.1. Different accounts contain different analytics, so each account will be processed individually, after which all accounts will be combined into a single file. As an example, consider the conditional legal entity Romashka LLC, in which accounts 20 and 90.1 are used.
The standard report in 1C Accounting, which generates data in the context of transactions, is called an “account card”, and we will work with it.
The report looks like this:
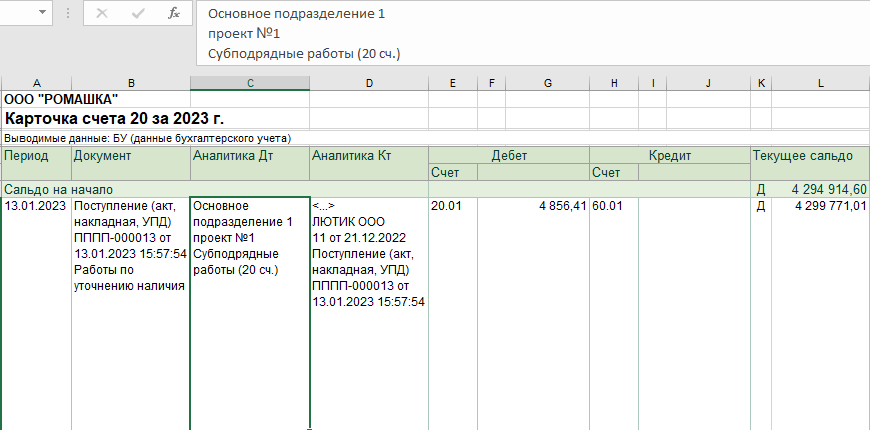
A number of difficulties for processing data using standard methods are immediately visible: firstly, the combined columns, and secondly, in each cell with analytics, the data is separated by a line break.
Although the report form is standard, its content can be individual, depending on the type of analytics used by the accounting department. In this example, the analytics “division, project, cost item, counterparty, agreement with counterparty, settlement document, description of the type of work” are used.
Analytics also differ depending on the correspondence of accounts (dt20 kt60, dt20 kt70, dt20 kt10, etc.), so with correspondence dt20 kt10 in the column “Analytics Kt” there will be no counterparty and agreement, but the name of the inventory will appear. This adds additional difficulties. An approach to solving such difficulties will be shown below.
Costing
In order to load a table into PQ, you need to convert it to a Smart Table. To do this, select the entire table and transform it into a “Smart Table” /Insert – Table/. At this stage, you can immediately delete unnecessary lines – opening balance, account, as well as totals at the bottom of the table.
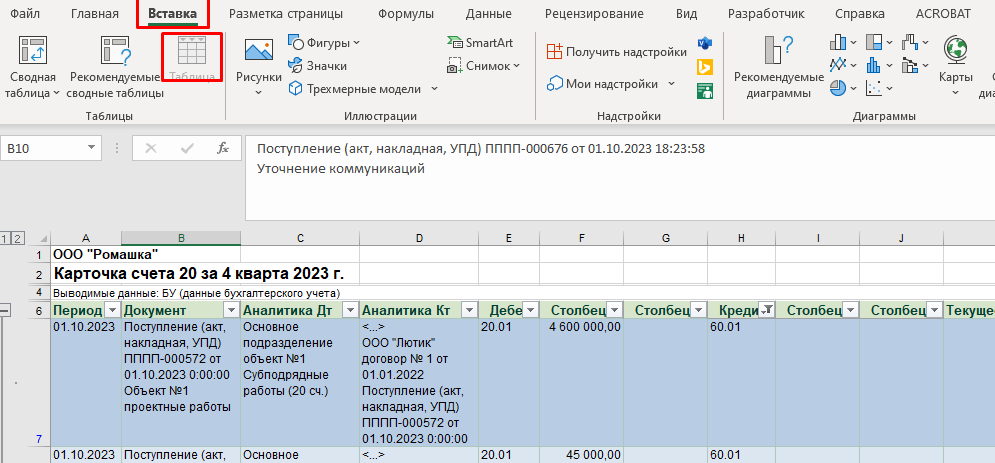
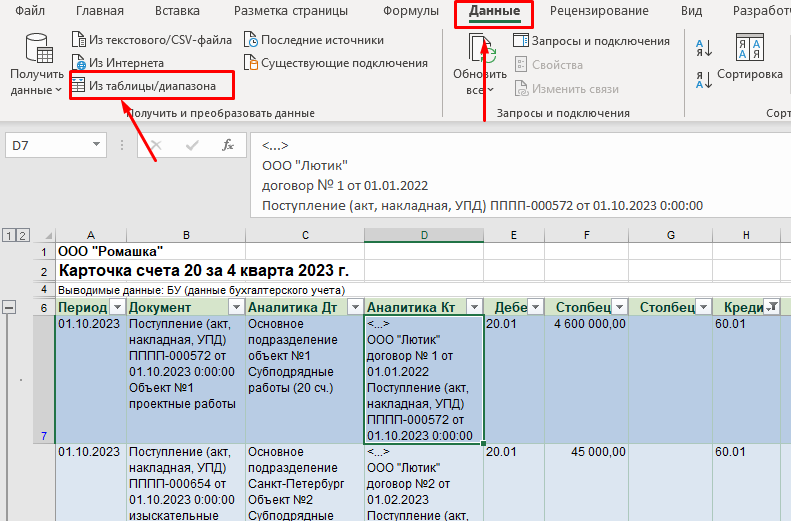
Step #1 Loading the table into the PQ query /Data – From Table /. Depending on the version of Excel, the menu may differ slightly from what is shown.
The PQ main menu looks like this:
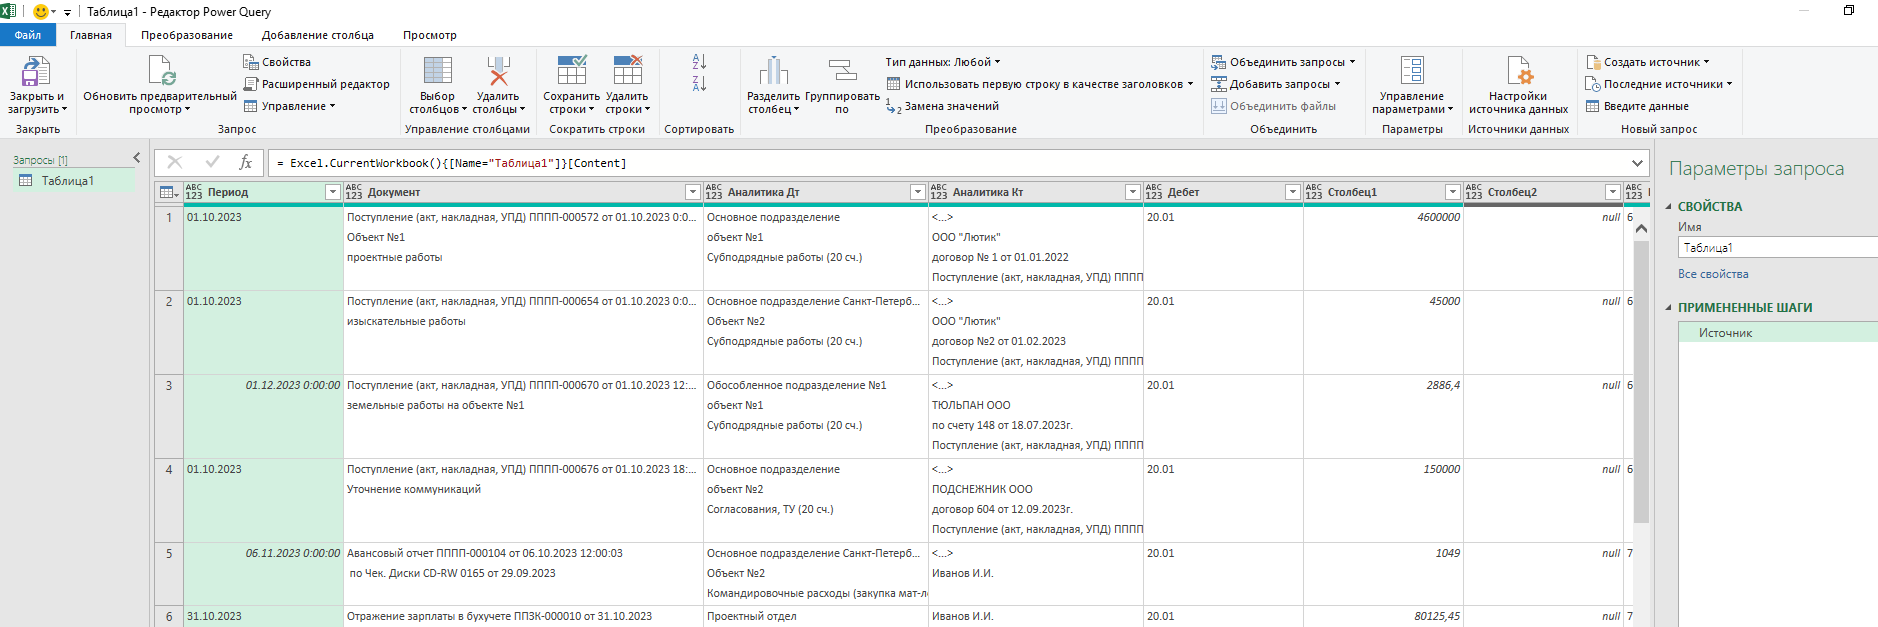
On the right side are the query parameters, which reflect all stages of working with data.
The first step is the source; it specifies the absolute address of the table in question
= Excel.CurrentWorkbook(){[Name="Таблица1"]}[Content]Step #2 Remove all unnecessary columns. Right-click on the column header and “delete”.
Step #3 We separate the Columns “Document”, “Analytics Dt” and “Analytics Kt” by the separator – “line feed” /Home – Split column by delimiter/

Next, select the “custom” option, remove all the characters in the cell below, as indicated in the screenshot (in the example, a dot is automatically added), put a mark (tick) /Split using special character – Line translation/. The newline character #(lf) appears.
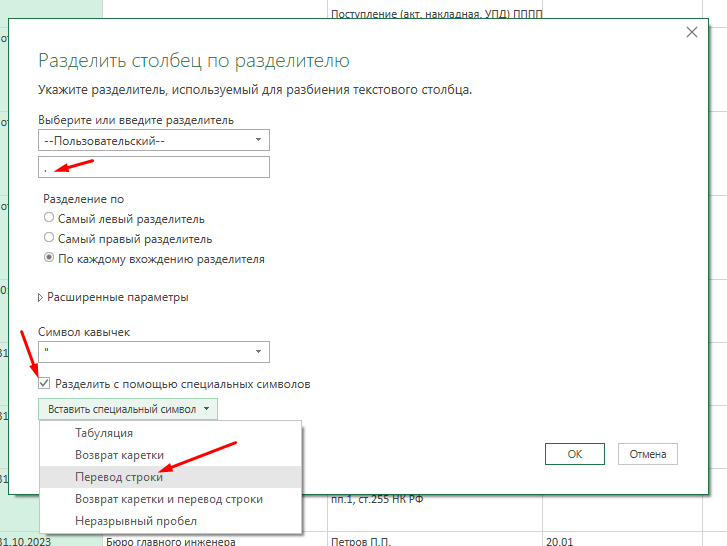
Confirm: “OK”; in this example, the column is divided into 2 parts – this is the type of operation and its brief description. The same operation is carried out with the remaining columns. As a result, instead of three columns, nine appeared.
Step #4 We rename the columns in accordance with the meaning of the information they contain. It is better to immediately write the names of the columns in lower case; this will be useful when merging all queries in subsequent steps.
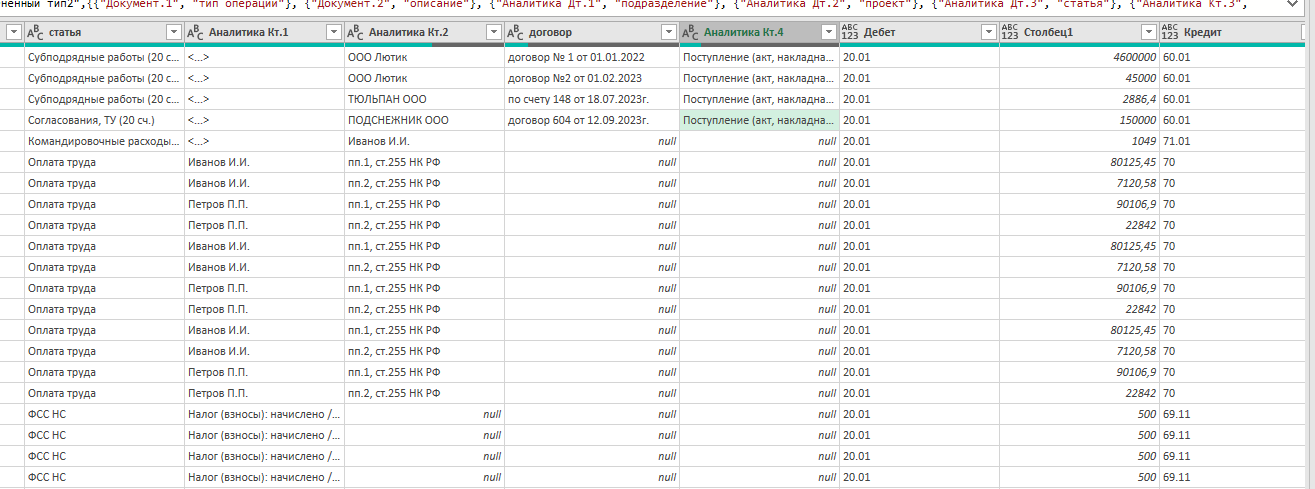
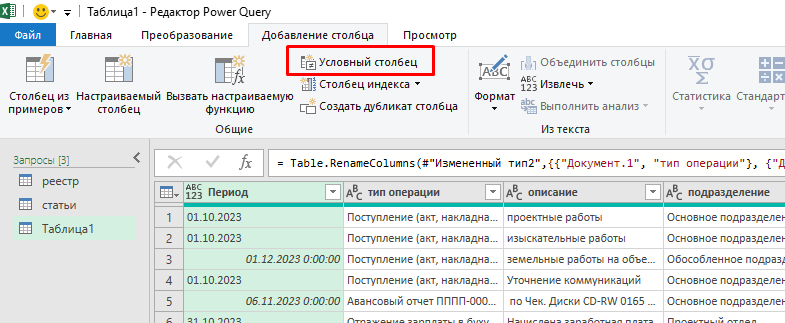
Step #5. In the “Ct Analytics” column, depending on the Loan account, the analytics are different. So, in case of correspondence with accounts 60.01 and 71.01, the counterparty analytics goes in the “Analytics Kt.2” column, and in the case of accounts 70, 76.10 – in the “Analytics Kt.1” column. Let's correct this situation by using the If…Else function – an analogue of the conditional IF action in Excel. To do this, create a new column according to the condition /Adding a Column – Conditional column/. You can also enter this command in the “Custom Column” option or in the advanced editor. Since the condition is simple, the built-in interface will do.
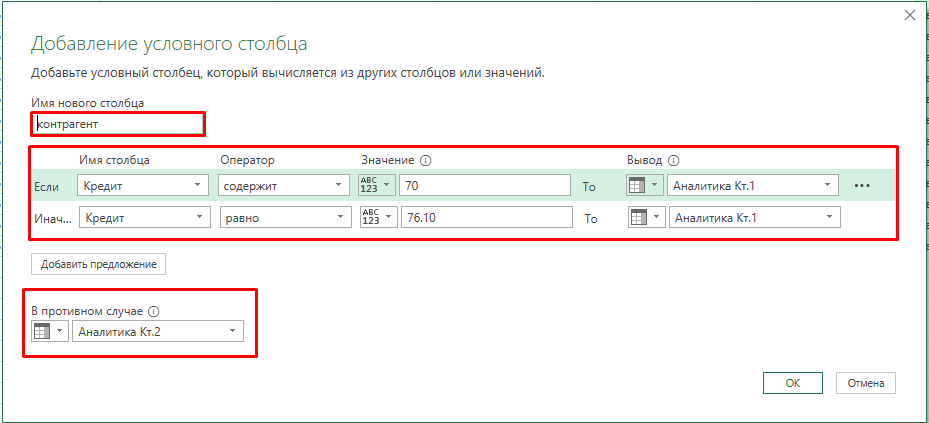
In the request, we assign the name “counterparty” to the column and enter the condition: if the value in the “Credit” column contains 70, then insert data from the “Analytics Kt.1” column. Note that the “contains” operation and not “equals” was selected as an illustration to provide for the case when accounting uses subaccounts; this makes it possible to include the entire count in the condition – 10.1,10.2,10.5, etc. If the value in the “Credit” column is 76.10, then the value from the “Analytics Ch.1” column is inserted; in other cases, the value from the “Analytics Ch.2” column is inserted. As a result, a new column “Account” appears with combined values from two columns according to the specified condition.
Step #6 We bring the columns into the desired format and order, and then rename the columns that were not previously renamed.

This completes the processing of the account card. Rename the request (for example, “registry”) for future collection of data from the folder and select the option – Close and load.
The same manipulations are carried out with the remaining account cards loaded into separate files.
Step #7. Let us note some nuances in working with the account card – 90.01. All amounts in this subaccount include VAT. Since the BDR is calculated without VAT, it is necessary to subtract the VAT amount from the data.

You can take advantage of the fact that the VAT rate appears in the “Ct Analytics” column. Since in different cases its different values are possible – 20%, 10%, 0% or “excluding VAT”, this must be immediately written down in the condition similar to the example with the “Counterparty” column. After dividing the column “Analytics Kt” by the separator, the function was analyzed in detail earlier, we add a conditional column in which we write the condition: if the column contains 0 or Without VAT, then 1 is entered, otherwise – the value of the VAT rate from the column “Analytics Kt” . Taking this condition into account allows you to perform arithmetic operations with data.
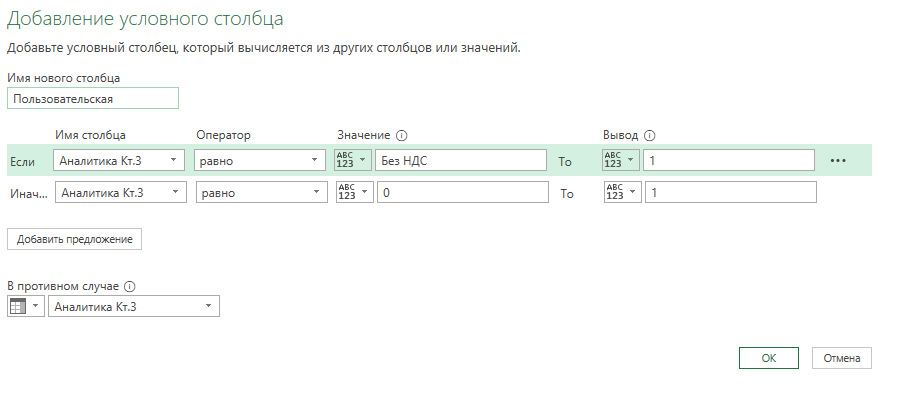
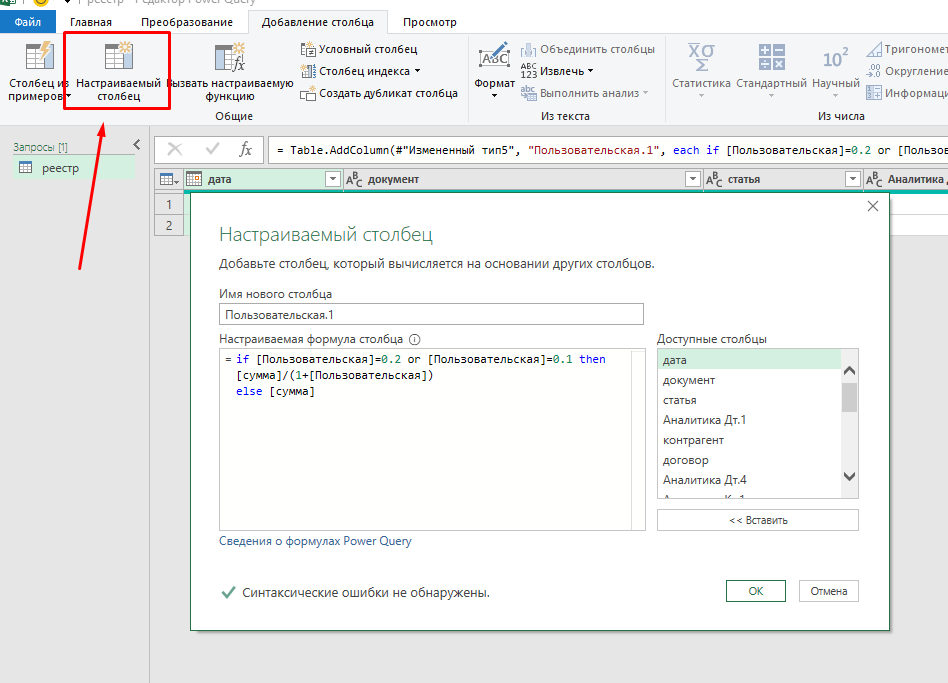
Next, create a new column /Add Column – Custom Column/
And we set the following condition:
if [Пользовательская]=0.2 or [Пользовательская]=0.1
then [сумма]/(1+[Пользовательская])
else [сумма]
This means: if the value in our column is 0.2 or 0.1, then we divide the value in the “sum” column by 1+ our column, in other cases we put the data from the “sum” column. Using this formula allows you to get the amount without VAT.
This concludes the processing of account cards.
Consolidate requests and add necessary analytics
After processing all the account cards necessary for analysis, you need to combine them into one file and add, if necessary, additional analytics.
Step #1 – create an empty Excel file and in it create a smart table in which we write the path to the folder with account cards. We give the table and column arbitrary names, in the example they are “path_folder” and “path”, respectively.
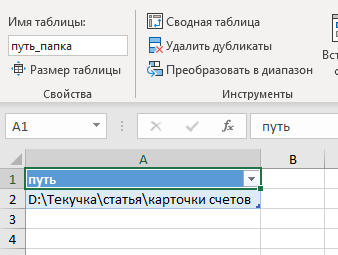
Next, create an empty request / Data – To get data – From other sources – Empty request/ and enter the following conditions in the advanced editor or on the command line:
= Folder.Files(Excel.CurrentWorkbook(){[Name="путь_папка"]}[Content]{0}[путь]) 
As a result, a list of all files located in the specified folder will appear.
This step can be simplified if there is no need to change the address of the folder with account cards and the absolute address / Data – To get data – From file – From folder/. In the window that opens, select the “convert” option; after that, in the opened request, instead of the path shown above, there will be an absolute path to the folder:
= Folder.Files("D:\Текучка\статья\карточки счетов")It can also be changed, but in the request itself.
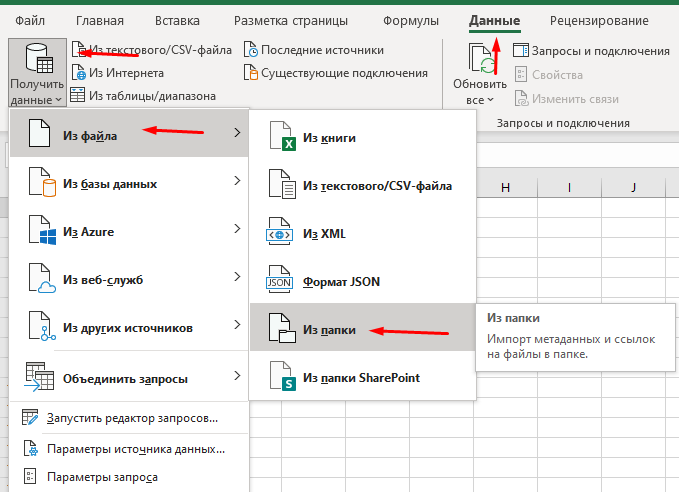
Step #2 -add a custom column /Add Column – Custom Column/, and enter the command: Excel.Workbook([Content]), this function returns the contents of an Excel workbook. Expand the resulting column by clicking the button in the column header.
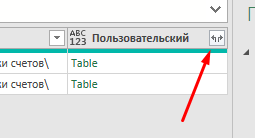
Filter the “…Kind” column by selecting the Table type (to select only a smart table from our files) and filter by the “…Name” column by table name; in the example it is “registry”
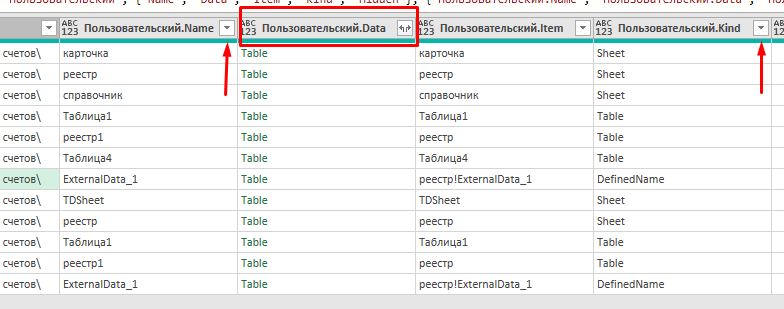
Next, delete all columns except the “…Data” column and expand it, unchecking the “Use original column name as a prefix” checkbox so that the column names are the same as in the account cards. If there is a need for information about the data source, for example, to more easily find errors in the sources, you can leave the “Name” column, which contains the name of the source files.
This is where the importance of matching column names comes into play: if some columns have different names, they will not be merged, but will be added as separate columns at the end of the query. This principle is also true in the case when a column is in one table, but not in another.
You can stop there if the accounting analytics are sufficient to form the fact of a BDR. But it may be necessary to correct or supplement the data. In this case, it is not advisable to make a manual replacement, because the first time the query is updated, all adjustments will be lost. We suggest using improvised reference books to correct data. As an example, let’s replace cost items from accounting with items for management.
Step #3. We create a new smart table, in one column of which we indicate the item from the account card that we want to replace; in the second column we indicate the standard of this article. In the example, the CU article is the standard, the BU article is data from the account cards.
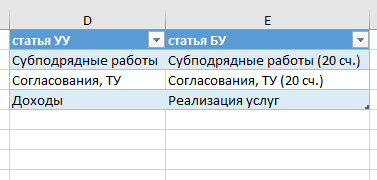
We add the table to PQ, as we did earlier. Another request will appear in the “requests” menu on the left.
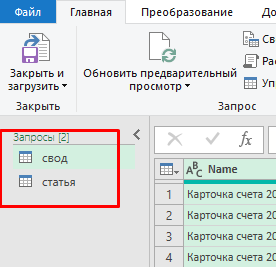
Now we need to combine these queries. To do this, in a query with data (in the example, “pivot”), we select the command “merge queries” / home – Merge queries – Merge requests/. In the window that opens, select a query with articles and select the columns for which the merge will occur (in the example: the query “article” – the column “article BU”, the query “collection” – the column “article”), leave other parameters as default and confirm “ OK”.
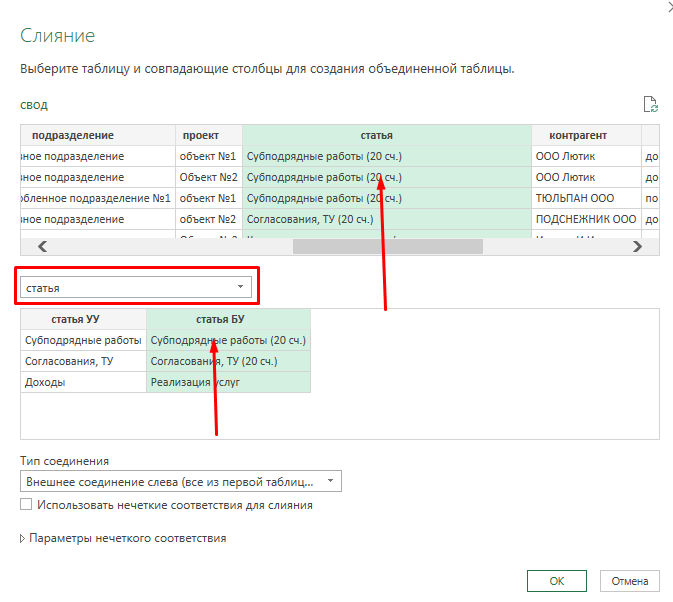
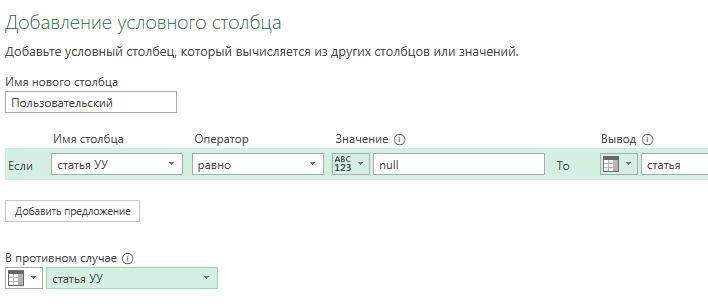
As a result, a new column has been added, which we expand and select the option “show only the column with reference data” (in the example, “UU article”). Data appeared in the column in those rows in which we wanted to replace the articles. Next, you need to replace the data in the “article” column. The easiest way to do this is to create a conditional column. To do this, we write a condition: if there are no values in the “Article CU” column (in PQ there are no values displayed as “null”), then we substitute the values from the “Article” column; in other cases, we substitute the values from the “Article of the Ownership” column using the command:
if [статья УУ] = null
then [статья]
else [статья УУ]
Next, delete the extra columns and save the result.
As a result, we get automatic replacement of data for any additions or changes to the source code. We can also add new reference articles to the reference table as needed. Using this principle, you can add, change or delete any data: substituting an item by counterparty (for example, highlighting intragroup expenses), content or project, replacing one counterparty with another, adding analytics, etc. In the future, the economist simply needs to monitor the emergence of new data to correct the data and update the reference books. The program will do everything else itself.
Conclusion
As a result of all manipulations, we receive a ready-made database of all income and expenses of the company with detail down to the accounting entries and with all the necessary analytics, which will be automatically updated when data is added.
From this database you can obtain information both in the form of summary tables and in the form of complex reports with graphs and histograms. We are practically unlimited by the amount of data. This scheme works both with one organization and with ten. It is possible to add plans and conduct plan-fact analysis by combining queries; PQ copes well with such a volume of information. But at this level, difficulties of a different order arise: the difficulty of identifying and processing errors by a specialist, the inadequacy of analytics in accounting (as the data grows, its substitution will already cause difficulties), etc. They are being solved by other means – both technical (through the introduction of full automation) and organizational (through the unification of Management and Accounting policies to a single denominator, correction of reference books, etc.).


