Configuring JLink+Eclipse Incremental Debugging
classic situation. We wrote down the firmware via the SWD interface and … nothing happens. HeartBeat LED does not flash. Logs in UART (e) do not appear. CLI is not responding. Probably the firmware fell somewhere in HardFault_Handler(). What to do? How to understand where the error is? Of course, you can include and exclude pieces of the program before assembling and flash until we find out that problematic function. But this can take a very long time. All day.
This is where step-by-step GDB debugging comes in handy. And for this you need to configure the GDB client and GDB server.
I have a separate post about step-by-step debugging in the console. https://habr.com/ru/post/694708/
However, stepping through the console can be tedious. It is much easier to debug step by step directly in a text editor, such as Eclipse.
What do you need from the equipment?
equipment | Purpose |
USB-A USB micro cable | To connect the programmer to NetTop PC |
debug board (for example nrf5340-DK) | for step-by-step debugging of the firmware in the microcontroller |
J-Link programmer | for step-by-step debugging of the microcontroller |
Lap Top | to run utilities |
What do you need from the software?
Utility | Purpose |
JVM | eclipse text editor scroll virtual machine |
JLinkGDBServer.exe | gdb server |
nrfjprog.exe | utility to flash nrf family microcontroller |
arm-none-eabi-gdb.exe | gdb client |
eclipse.exe | Text editor |
Phase 1 Install GNU ToolChain for Arm Embedded
More about it here https://habr.com/ru/post/673522/
It is necessary to set the Path variable to the path to the ARM ToolChain (y): preprocessor, compiler, assembler, linker, binutils (s), debugger.
C:/Program Files (x86)/GNU Arm Embedded Toolchain/10 2021.10/bin
Phase 1 Start GDB Debug Server
You can use the JLinkGDBServer.exe utility as a debug server.
C:\Program Files (x86)\SEGGER\JLink\JLinkGDBServer.exe
You can even sprinkle a simple script so as not to configure the JLink GDB Server (a) settings each time with the mouse
echo off
cls
set GDBServerOpt = -select USB -device nRF5340_xxAA_APP -endian little -if SWD -speed 400 -ir -LocalhostOnly -logtofile -log "C:\projects\code_base_workspace\code_base_firmware\tool\GdbServerLog.txt"

set GDBServerDir="C:\Program Files (x86)\SEGGER\JLink\"
set GDBServerPath=%GDBServerDir%JLinkGDBServer.exe"
cd %GDBServerDir%
call %GDBServerPath% %GDBServerOpt%
In the JLink GDB Server(a) settings, you need to check the connection interface with the board. This board is USB. Check the connection interface of the programmer and the target microcontroller. In this circuitry, this is SWD. Check that the correct processor core is selected. In this case it is nRF5340_xxAA_APP. If everything is correct, then press ok.
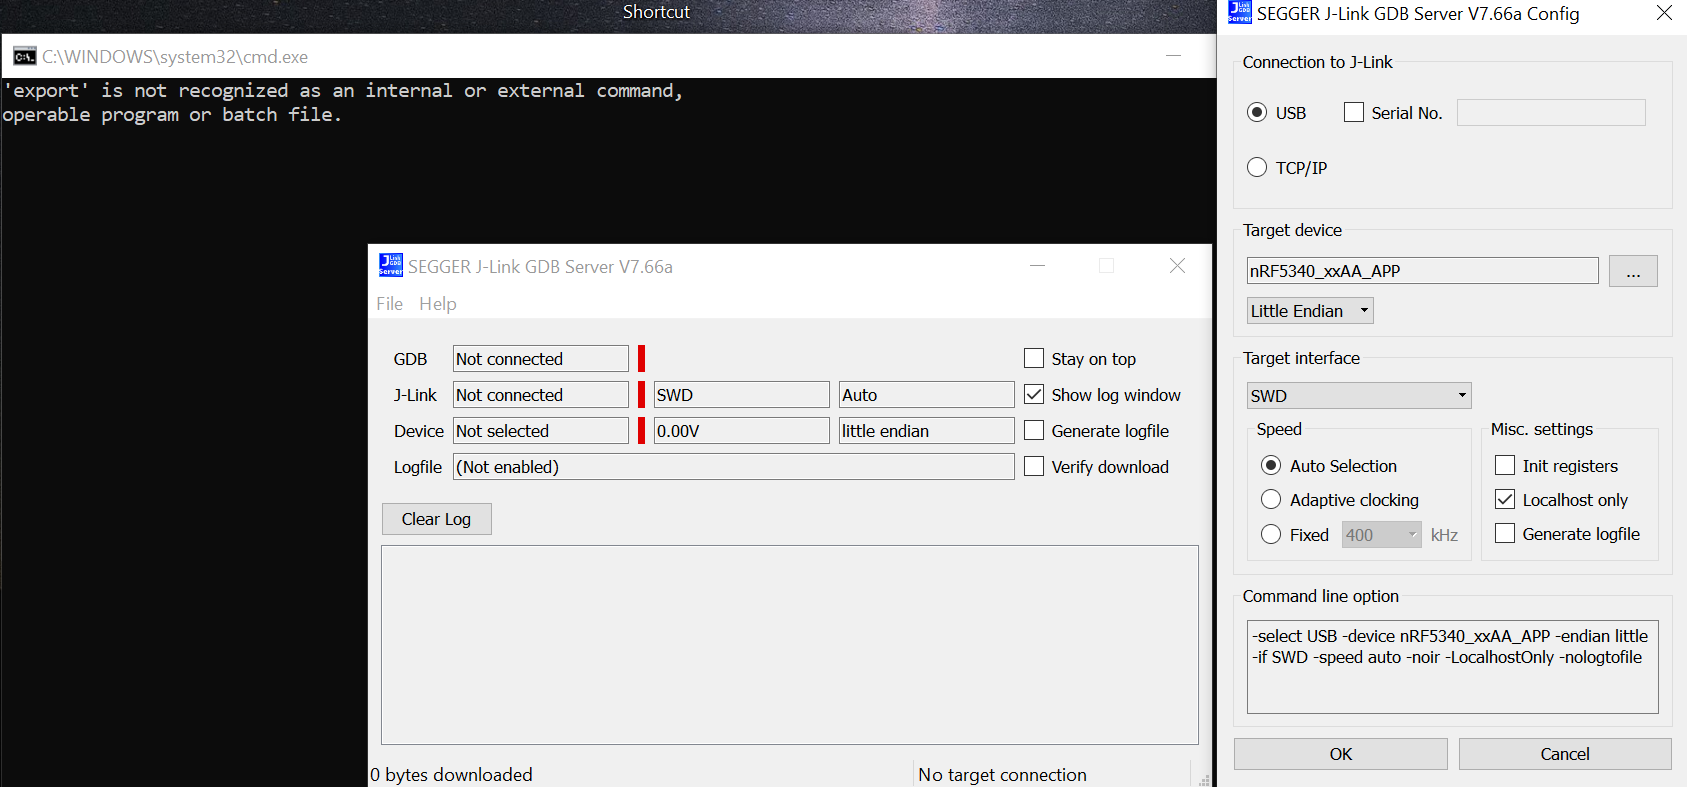
JLink GDB Server goes into standby mode to connect to GDB client.

Here is a sample log of a successful connection after starting the GDB client.

Phase 3. Setting up the GDB Client
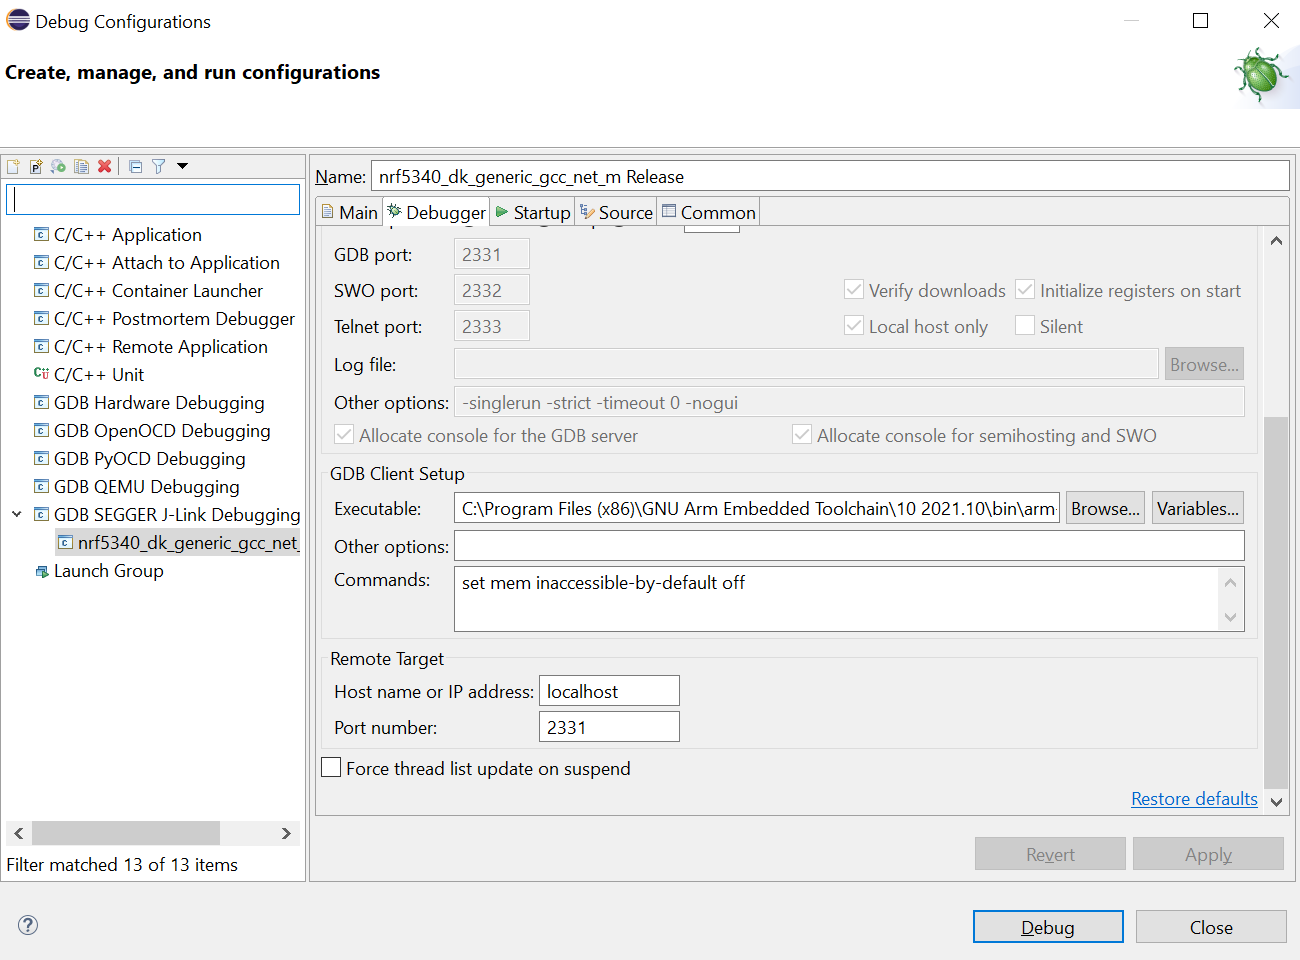
You need to open the Debug Configuration menu, create a configuration and specify the path to the *.elf file

On the Debugger tab, specify the path to the GDB client arm-none-eabi-gdb.exe.
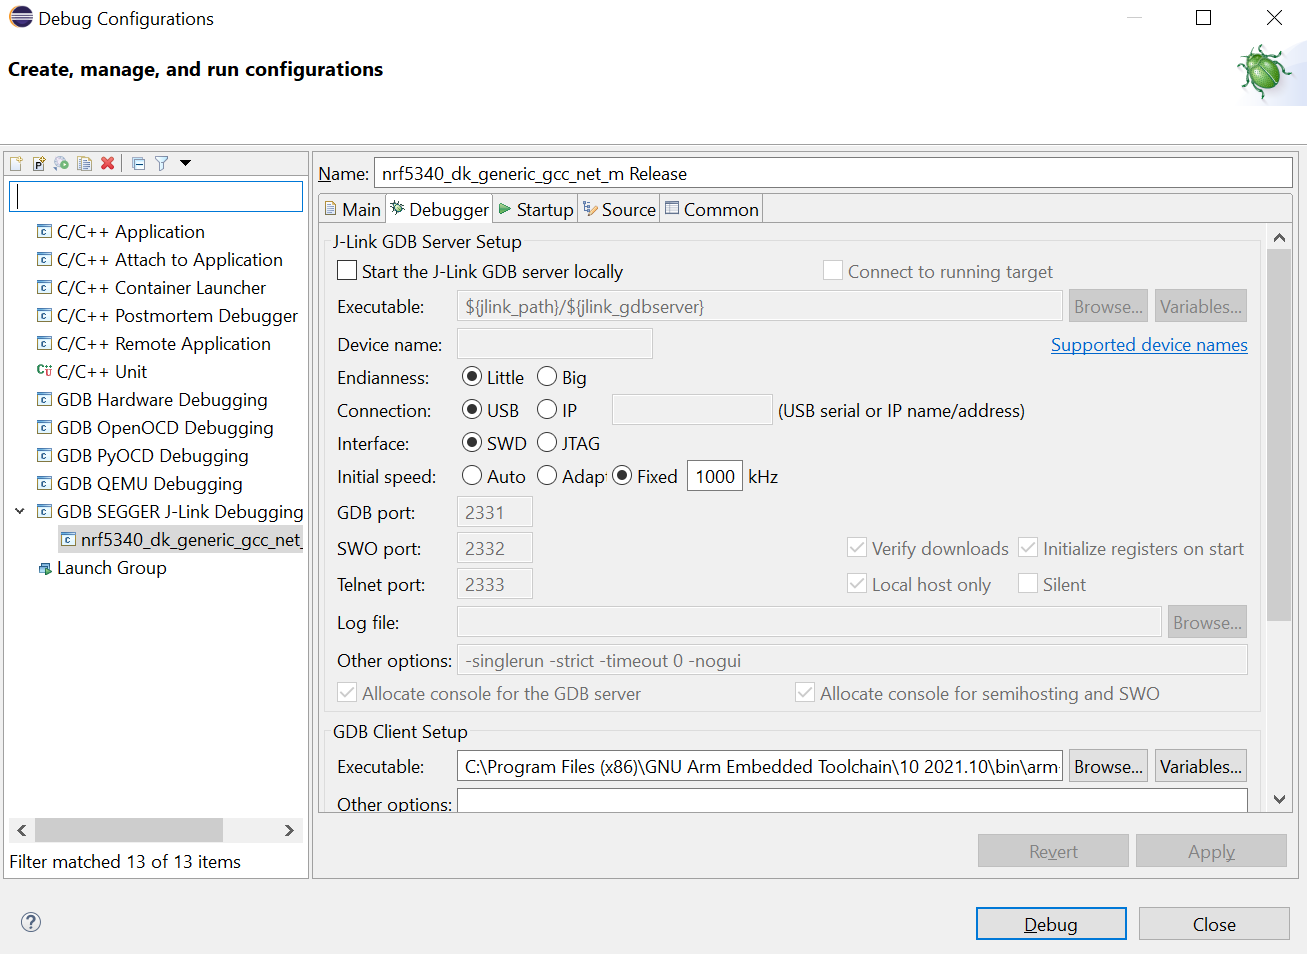
You can write the full path to the GDB client
C:\Program Files (x86)\GNU Arm Embedded Toolchain\10 2021.10\bin\arm-none-eabi-gdb.exe
Customize the Startup tab.
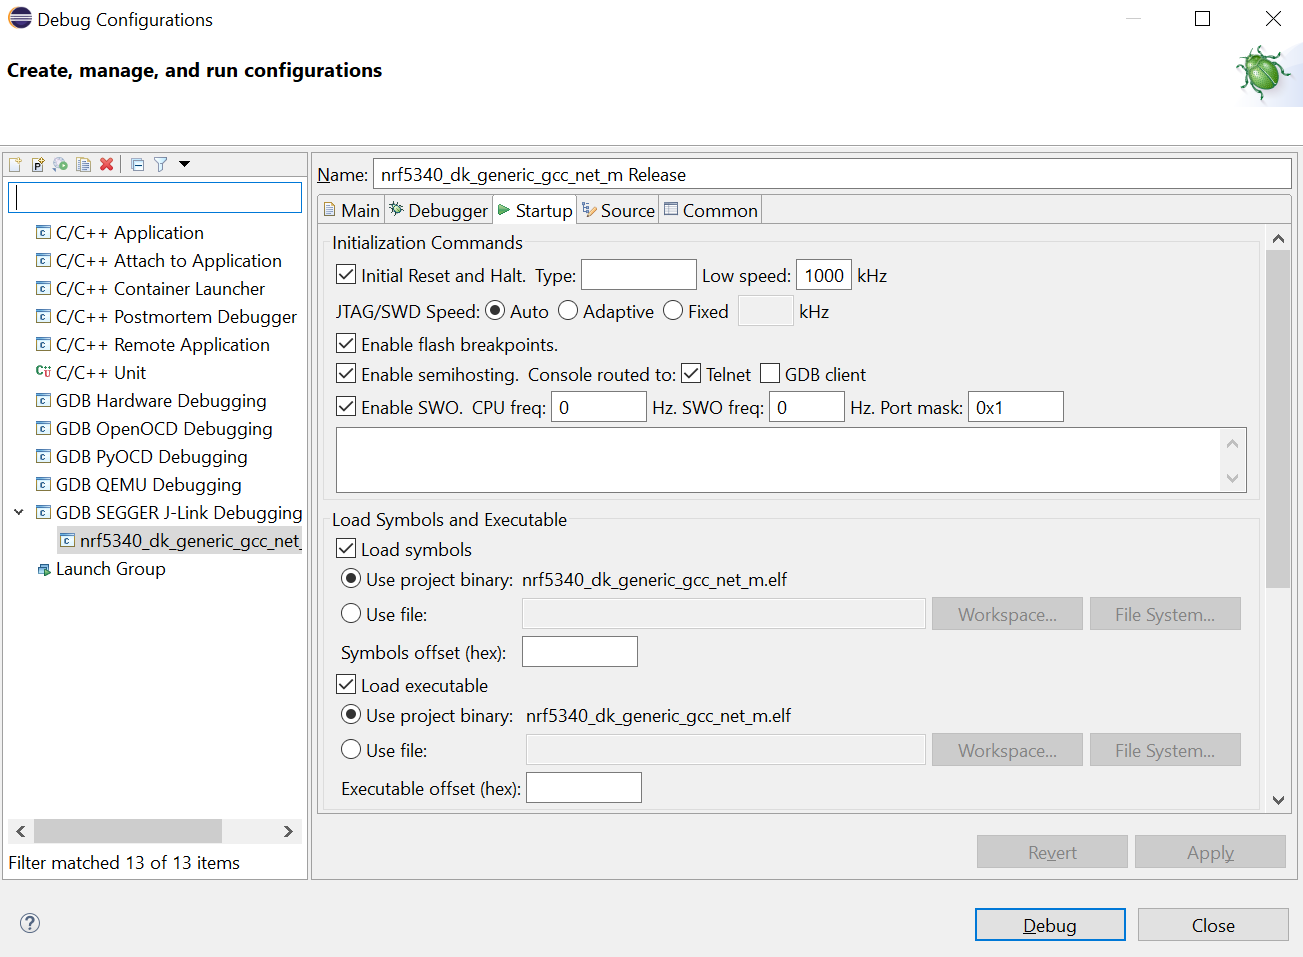
we set that it is necessary to stop at the main function

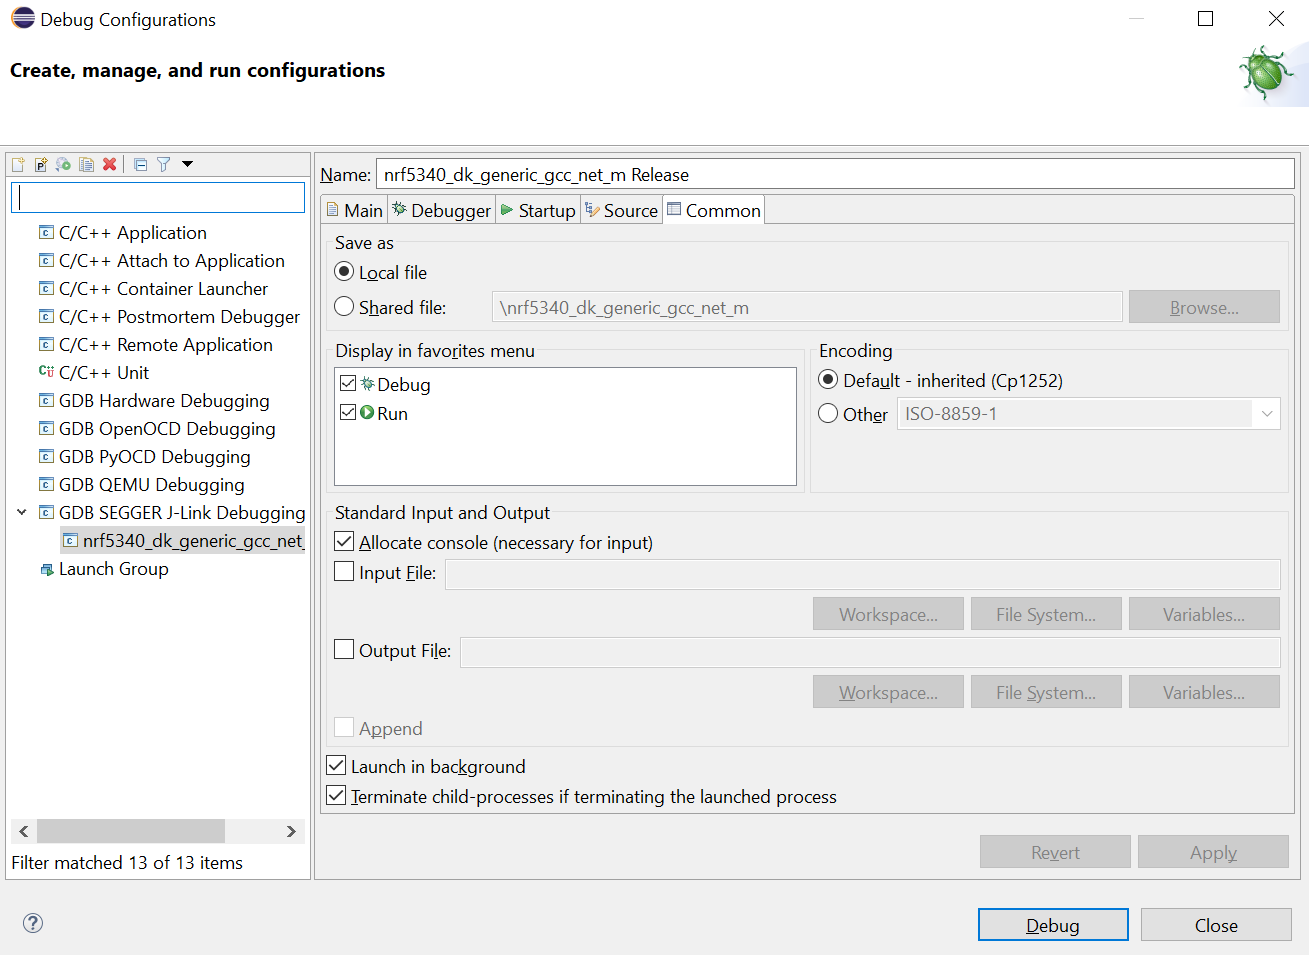
Customize the Common tab as shown in the screenshot
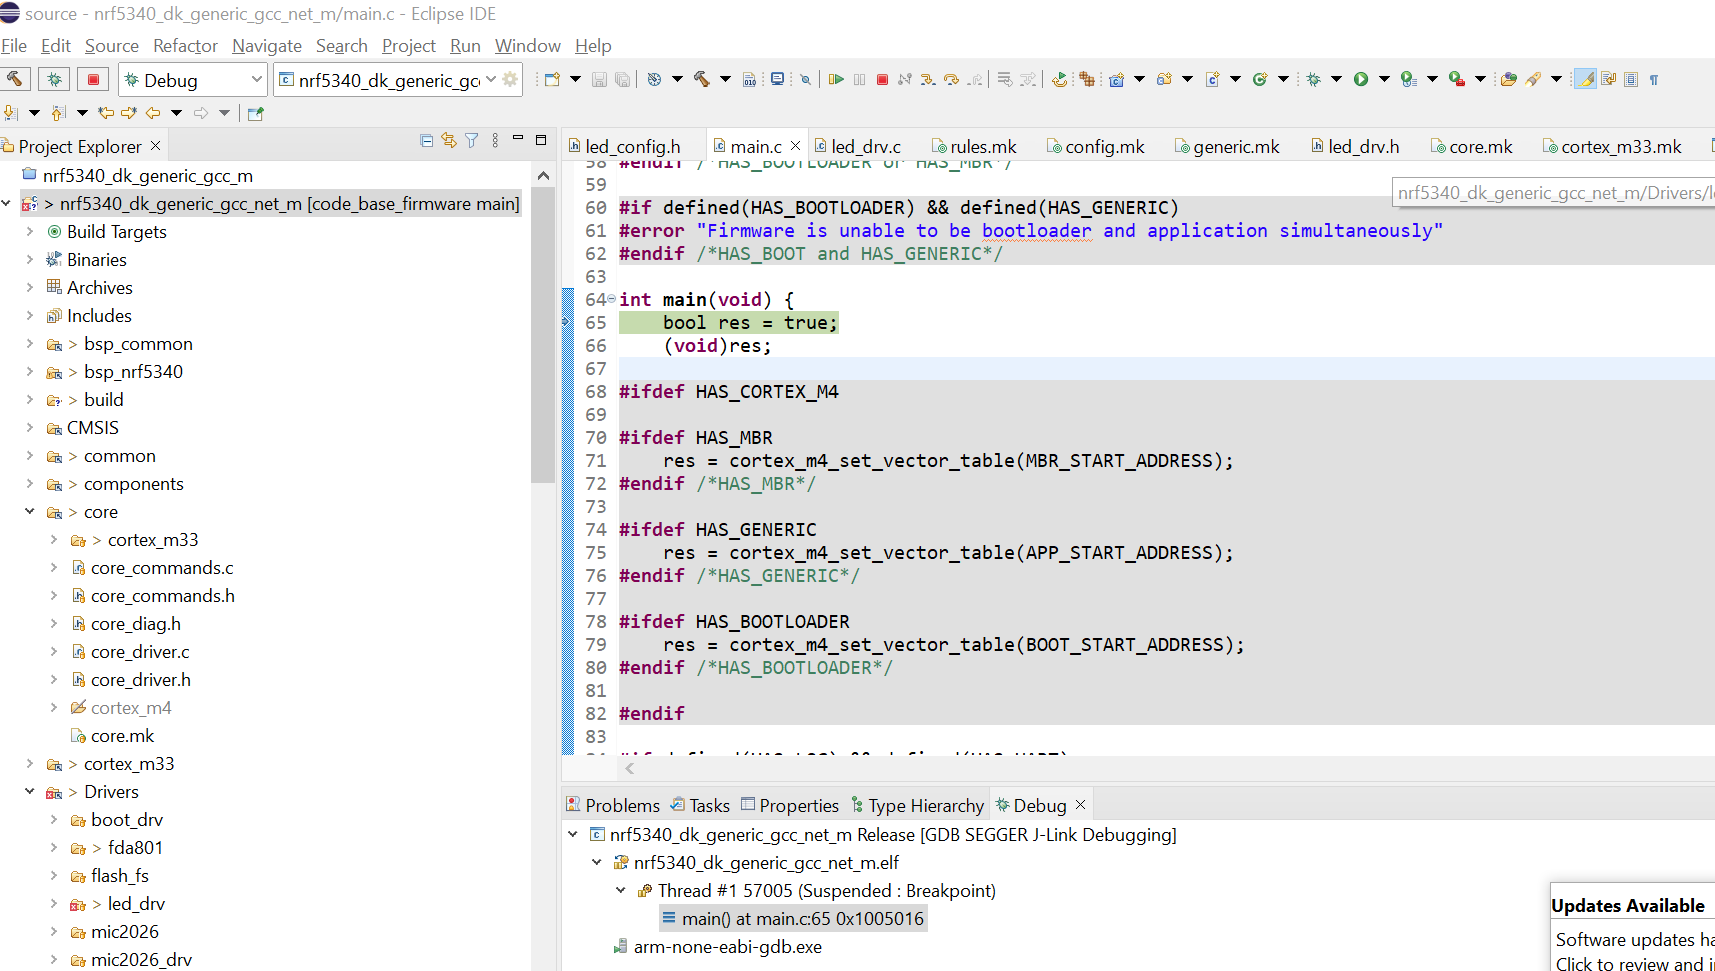
Now just press the Debug button and you can perform step-by-step debugging
the following scheme of interaction of utilities turned out

Conclusion
Step by step debugging will help you to debug the UART. Next, you run the CLI on top of the UART and you will be able to debug freely only through the CLI.
Dictionary
Acronym | Decryption |
CLI | command-line interface |
UART | universal asynchronous receiver-transmitter |
LED | light emitting diode |
RISC | reduced instruction set computer |
JVM | Java virtual machine |
PC | personal computer |
UNIX | UNiplexed Information Computing System |
ARM | Advanced RISC Machine |
SWD | Serial Wire Debug |
USB | Universal Serial Bus |
GNU | GNU’s Not UNIX |
gdb | GNU Debugger |
Links
https://bitknitting.wordpress.com/2015/07/11/using-eclipse-to-program-the-nrf51822/
https://dev.px4.io/v1.10_noredirect/en/debug/eclipse_jlink.html
https://eclipse-embed-cdt.github.io/debug/jlink/
https://habr.com/ru/company/rainbow/blog/251053/
https://habr.com/ru/post/215483/
https://habr.com/ru/post/578830/
https://habr.com/ru/post/673522/https://habr.com/ru/post/694708/https://habr.com/ru/post/694408/https://habr.com/ en/post/681280/
https://karibe.co.ke/2014/03/debugging-arm-freescale-microcontrollers-with-j-link-gdb-server-and-gnu-arm-toolchain-gdb-with-semihosting-in-linux/
https://mcuoneclipse.com/2019/09/22/eclipse-jtag-debugging-the-esp32-with-a-segger-j-link/
https://mcuoneclipse.com/2022/07/16/getting-started-raspberry-pi-pico-rp2040-with-eclipse-and-j-link/