Comparison of Intel vs AMD processors for 1C work
The purpose of this study was to compare Intel and AMD processors for running 1C in the Hyper-V virtual environment.
The performance of the 1C accounting system is practically a key requirement for any business. The ideal option would be to allocate a separate server for working with 1C, but in practice this is not always possible. Most often, a server (host) is used to host virtual machines that consume processor power.
Important! Don't forget that live migration of virtual machines is convenient when using identical processors. Of course, the processor compatibility mode will help resolve the situation, but it will require care and additional configuration. |
In this regard, the question arises about choosing a processor for a server that can provide the best 1C performance when the load from virtual machines on the host increases.
Important! It is necessary to take into account the dynamic load on the host, which is generated by the work of users on virtual machines. |
For which IT infrastructure do we choose a processor?
Typically, in small and medium businesses, the server infrastructure looks like this:
the main server (host) on which the hypervisor is deployed and virtual machines are installed;
The 1C accounting system operates in a client-server version.
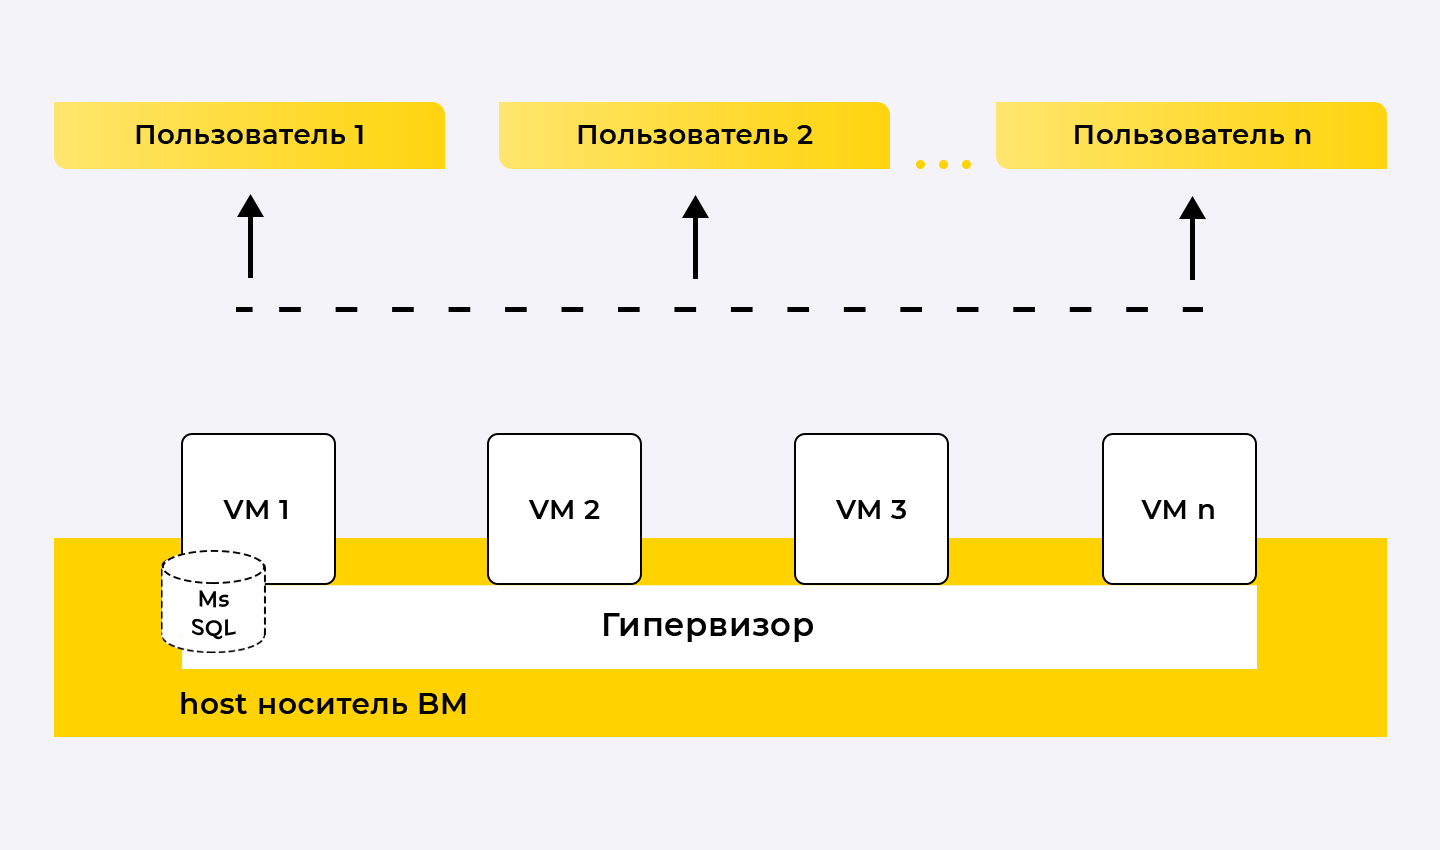
Testing methodology
During testing, publicly available tests were used. The testing approach is as follows:
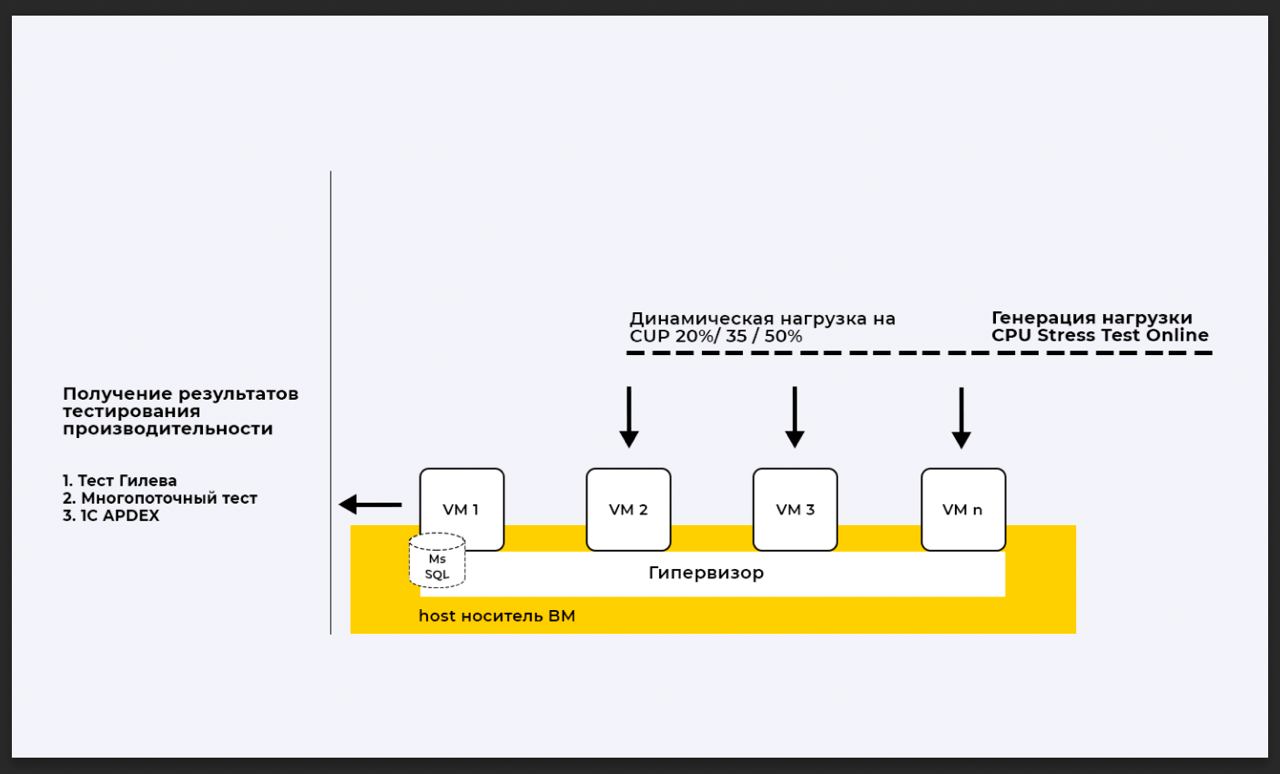
We measure 1C performance without external load on the host.
We simulate the load on the processor, simulating the operation of virtual machines.
We measure 1C performance.
To eliminate errors, we carry out the number of measurements 3 times after changing conditions.
Load Simulation
We create the load on virtual machines using a synthetic test.
This test simulates the performance of many different tasks. In this case, we are not interested in the test result itself; it is important to load the processor.
We create the load on the CPU sequentially at 20, 35, 50% of the VM
to generate the load we use “CPU Stress Test” Online: https://cpux.net/cpu-stress-test-online
1C performance measurement
We will measure the performance of the accounting system using three different tests. We run each of the tests three times at CPU load of 20, 35 and 50%.
To take measurements we use publicly available tests:
Gilev test – single-threaded (TRS-1C)
Multi-threaded performance testing of 1C server – DBMS
Typical 1C load testing using the APDEX methodology:
To carry out measurements we use a standard 1C:ERP solution with a test center.
Planned result
As a result of the measurements, we will conclude which of the compared processors is suitable for our IT infrastructure for the highest performance of the 1C accounting system, taking into account dynamic load.
Comparison of AMD and Intel processors in practice
Let's consider in practice solving the problem of choosing a suitable processor between:
Base frequency: 2.8 GHz
Number of cores: 32
Number of threads: 64
Base frequency: 2.7 GHz
Number of cores: 18
Number of threads: 36
The test bench is a virtual machine carrier (host) for two processors, its description:
CPU: 16 cores
Operating system: Windows Server 2019 Std
RAM: 96 GB
DBMS: MSSQL 2019 Enterprise
Hyper-V Virtualization
Measurements on test benches
According to our methodology, we measure 1C performance in four situations:
Test 1 – host CPU load from VM is 0%
Test 2 – host CPU load from VM is 20%
Test 3 – host CPU load from VM is 35%
Test 4 – host CPU load from VM is 50%
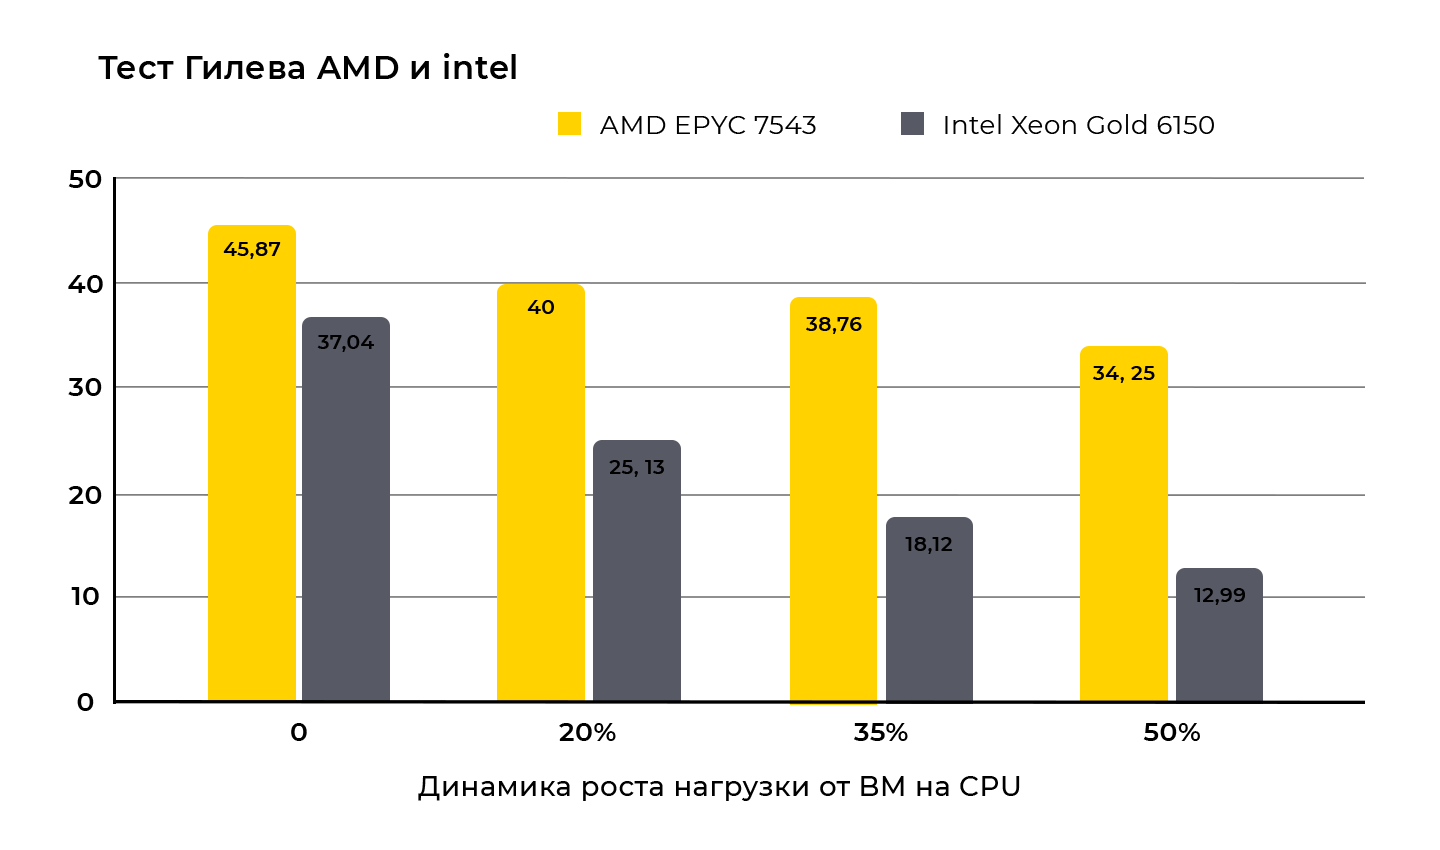
Gilev test – single-threaded (TRS – 1C)
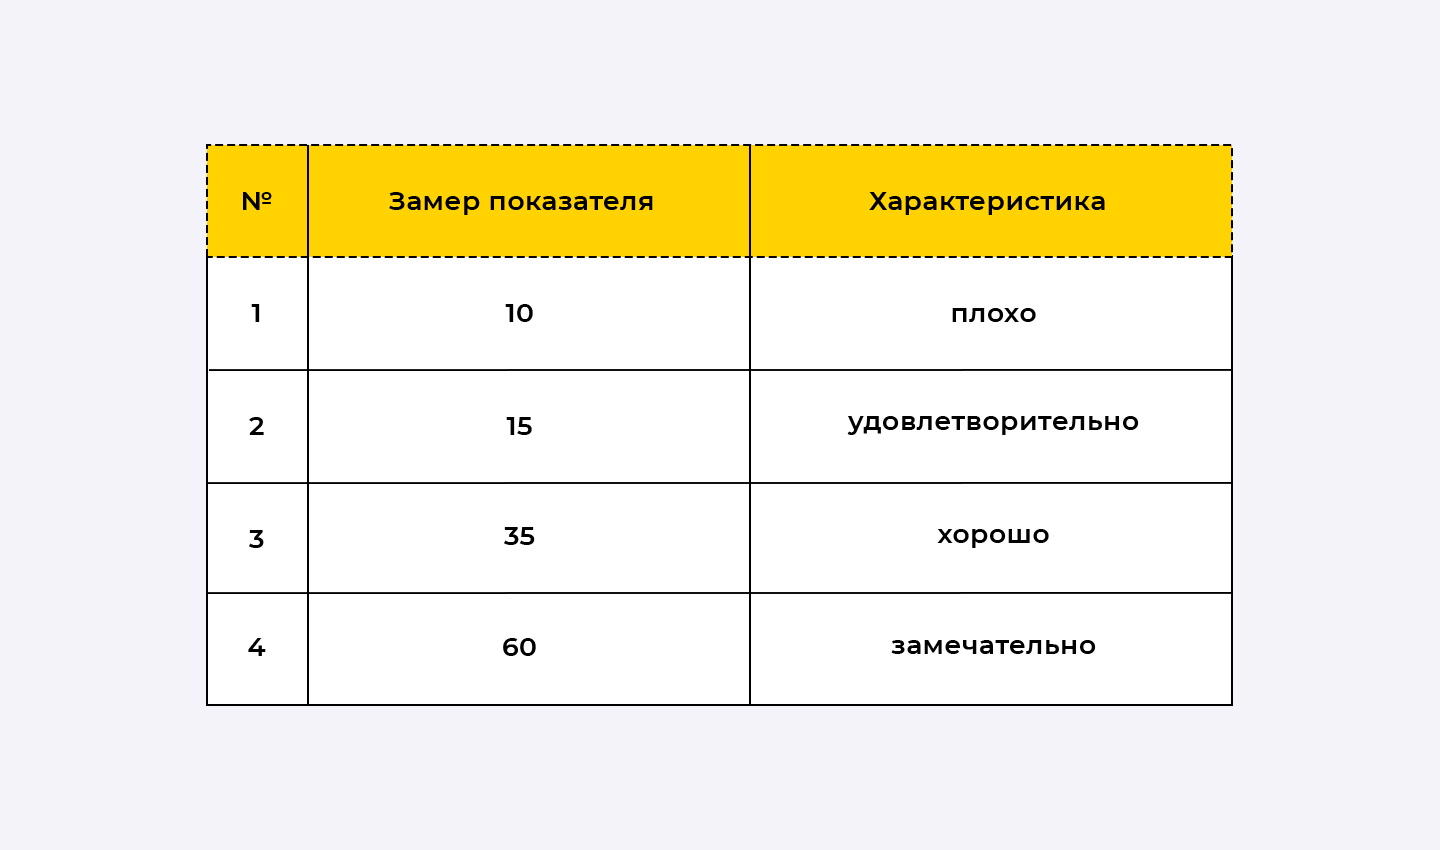
The generally accepted Gilev load test scale is as follows:

Interim test results:
It is clearly visible that the AMD EPYC 7543 processor showed the best results at all stages of testing.
When the processor load increased from 0 to 50%, the decrease in 1C performance according to the Gilev test results was 25% for the AMD processor and 65% for the Intel processor.
Based on the experience of operating server infrastructure, it can be stated that the average CPU load in the host is 35%. The test clearly shows that at the target CPU load, APYC performance is 53% higher compared to Xeon Gold.
Multi-threaded performance testing of 1C server – DBMS
The test's job is to create multiple background sessions that perform the same actions. For example, creating directory elements or writing sets of register records. It allows you to evaluate how “productive” the combination of 1C and DBMS is.
Having carried out measurements using the general method with increasing load on the host CPU, we obtained the following results:

The table clearly shows that the performance results of the AMD EPYC 7543 are higher than those of the Intel Xeon Gold 6150 at all stages of testing.
AMD performs most efficiently when the Host CPU load is 35%. Based on the experience of operating and supporting server solutions, such CPU load is the average statistical norm and allows us to withstand peak surges in user activity during reporting periods and month-end closings.
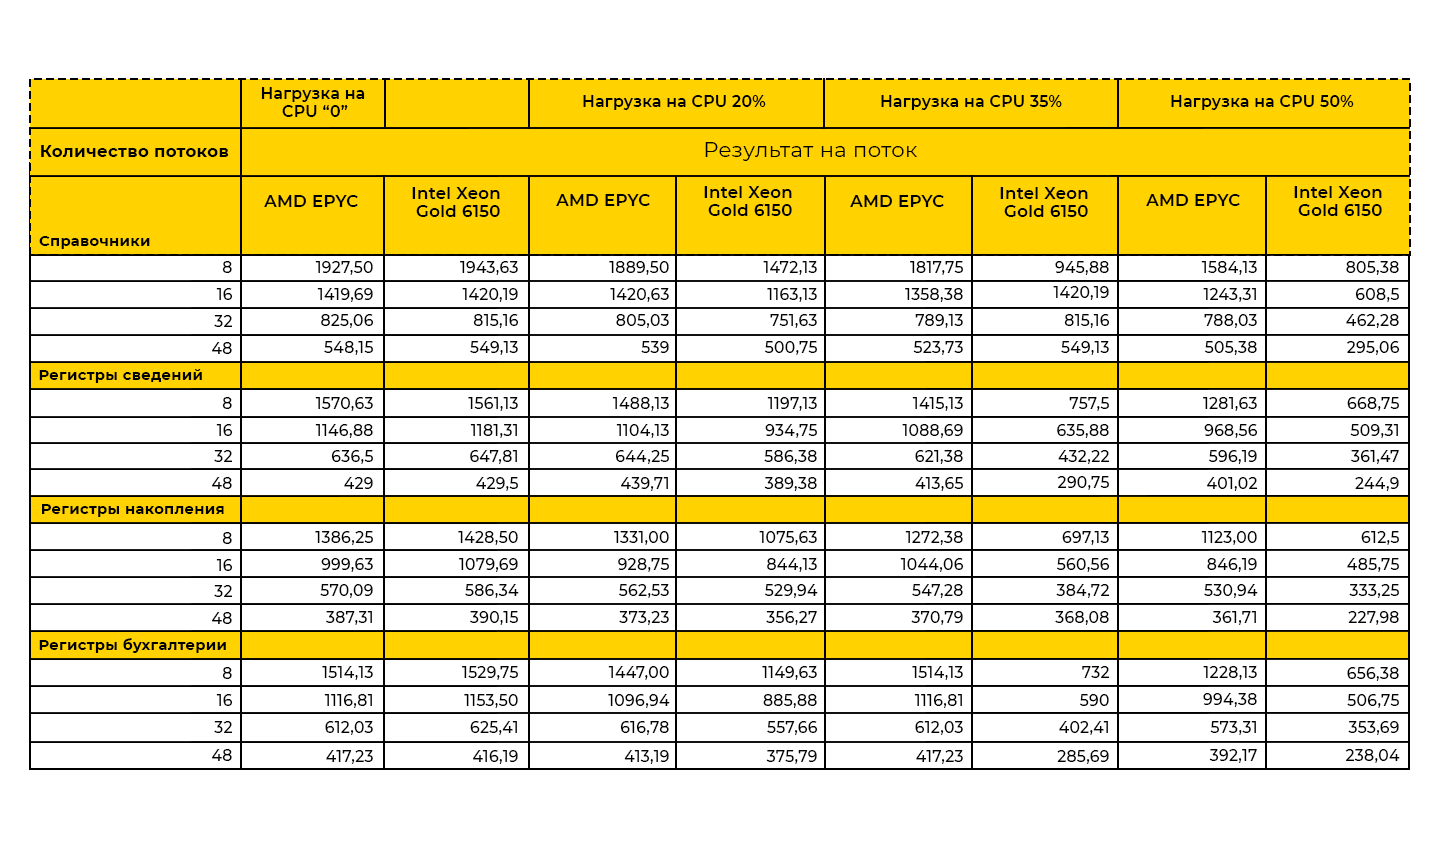
It has been experimentally established that a loss in processor performance occurs when the number of threads increases to more than 16. Moreover, the loss in performance is typical for both processors.
Typical 1C load testing using APDEX methodology
This test is standard and is available to 1C:ITS users. The test is built into the ERP configuration and has pre-configured user scenarios. We carry out testing according to the general methodology similar to the previous measurements.
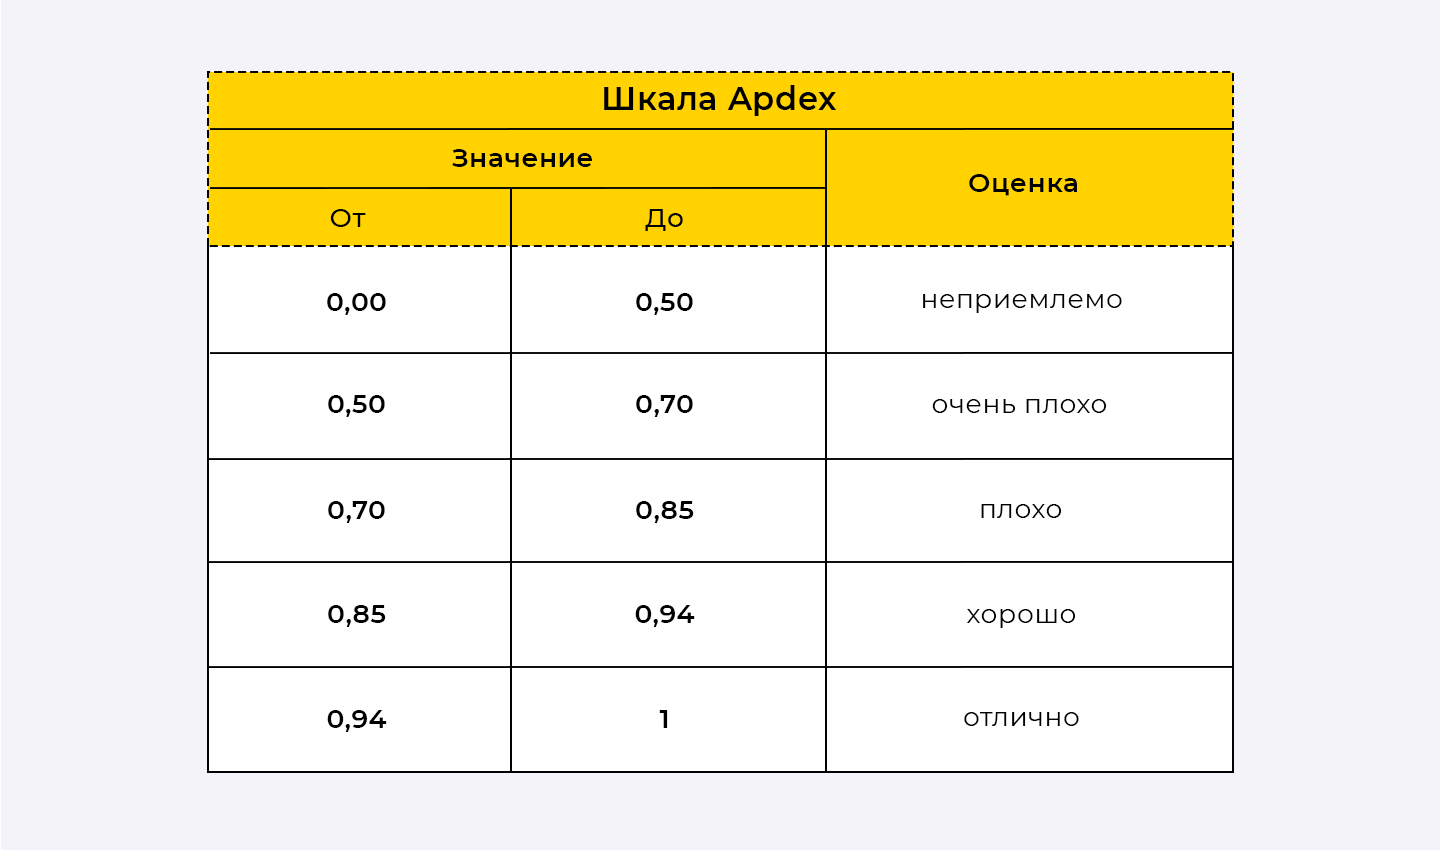
The APDEX technique allows you to interpret the obtained numerical values of the coefficient in terms of qualitative estimates. The APDEX scale contains the following ranges of values:
Results of a load test with a dynamic increase in CPU load:

As can be seen from the results of the measurements, EPYC 7543 showed better results compared to the Xeon Gold 6150.
It is important to note that when the CPU load increases to 35%, AMD shows almost no performance degradation.
Observation during the test
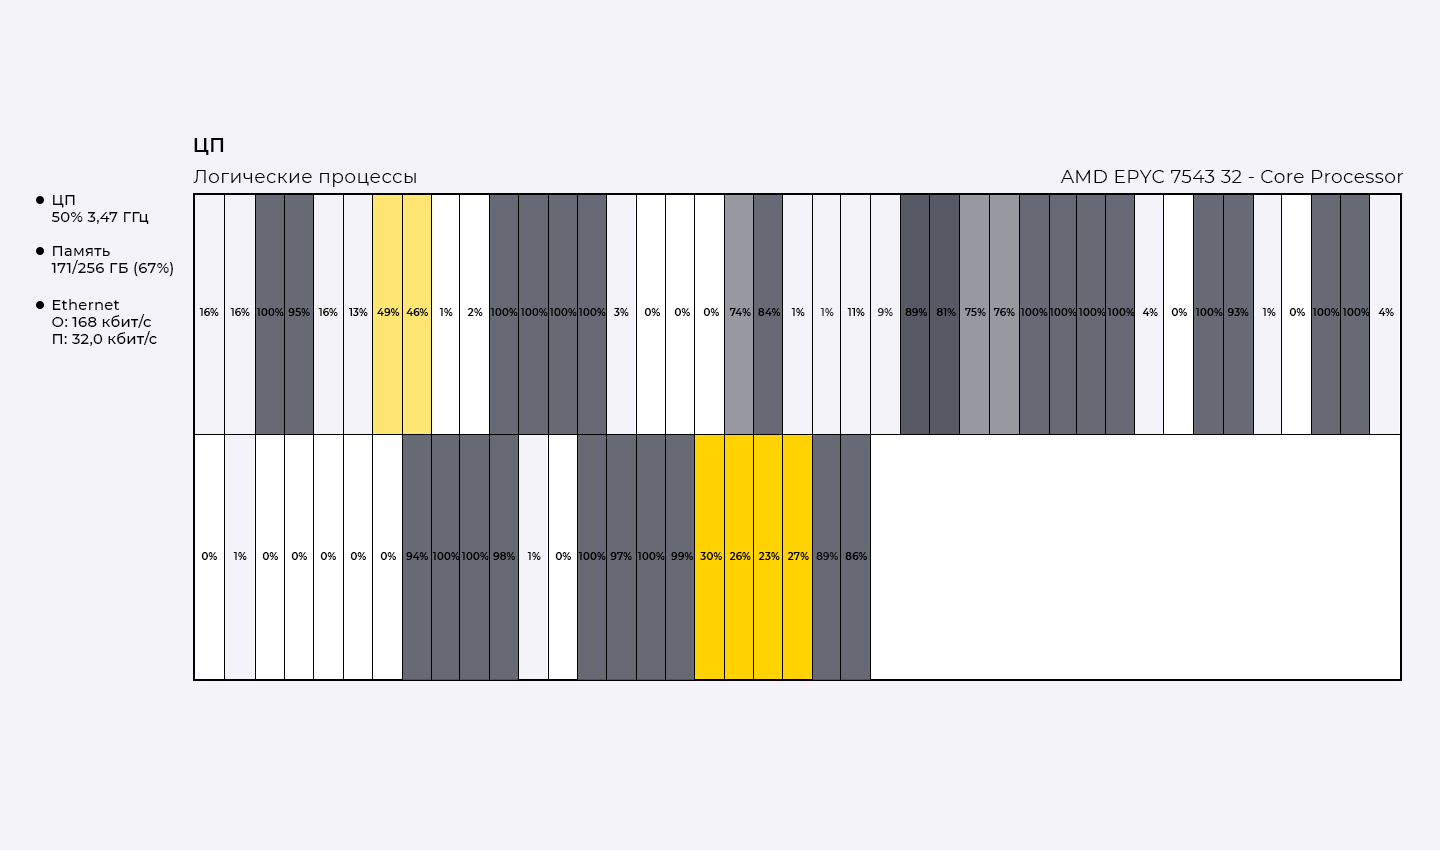
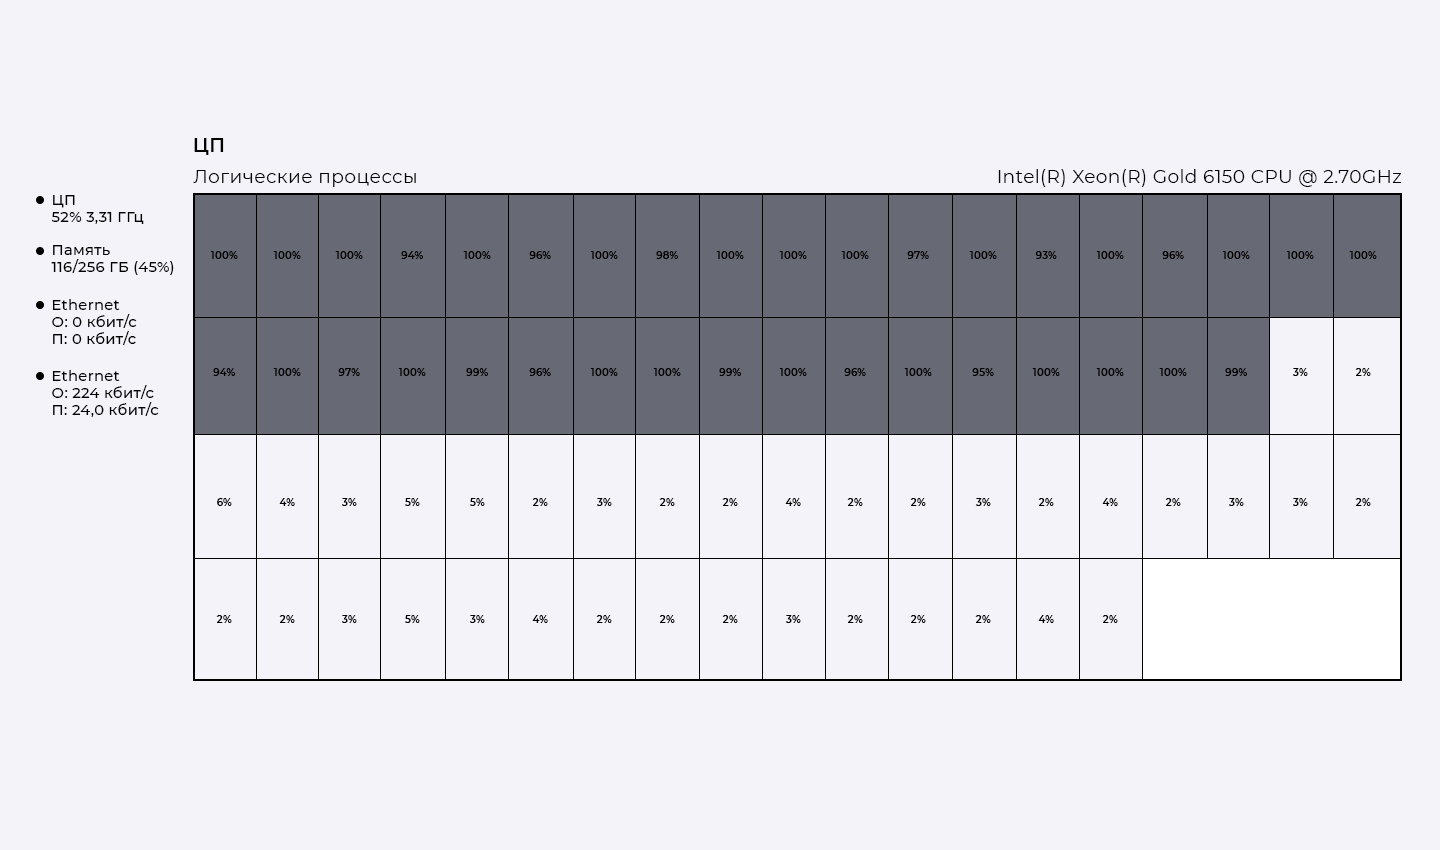
During testing, it was found that the Windows operating system uses kernels more efficiently when running Epyc, ensuring that a free kernel is always available.
Final result
Having measured 1C performance using three different tests to eliminate errors and bias, we can draw the following conclusions:
The AMD EPYC 7543 processor performed better than the Intel Xeon Gold 6150 in all tests.
It is important to note that the results at 35% CPU load have the greatest discrepancy in favor of EPYC.
Both processors showed acceptable results in the Gilev tests and the 1C APDEX standard test.
Based on the results obtained, we can conclude that when designing an IT infrastructure and selecting equipment, it is important to conduct preliminary tests that minimize the risk of design errors.


