Cell XV. Cell type mapping
The study of man is currently carried out by many different sciences using known and new methods and very intensively. Multi-billion dollar research projects are underway around the world. The human genome, proteome, transcriptome, human brain and other components of the body are studied. People realized that the time had come to seriously begin to study themselves, their body, consisting of trillions of interconnected cells. The complexity of the body is ensured, however, not only by the presence of a large number of cells performing different functions, but also by their interaction at the level of the intercellular environment, tissues and even entire organs.
As part of the Human Cell Atlas project, such an atlas has been created and is already in use. He included data obtained by several international research teams. The development of modern technologies for single cell RNA sequencing (scRNA-seg) has shown that the cell types of the human body are very diverse, there are now hundreds of different types. This work describes the characteristics of the transcriptome within which cell mapping is carried out, its structure and dynamics.
Transcriptome called an RNA molecule formed as a result of transcription (expression of the corresponding gene or DNA section). Examples of transcripts are: messenger RNAs (mRNAs). The article provides characteristics of the transcriptome, its structure and dynamics. Methods for studying transcripts. Coding and non-coding RNAs, their classification, micro RNAs, siRNAs, nano-RNAs, transcript assembly are briefly discussed in the publication.
The purpose of the publication is primarily educational, cognitive, popularization of science, as well as the desire to attract an influx of new young minds into the ranks of researchers and science, to arouse in such minds a desire to find answers to emerging questions. The scale of the topic requires the introduction of reasonable restrictions on the material presented after a brief panoramic consideration of it.
Introduction
General diagram showing the relationships between the genome, transcriptome, proteome and metabolome (lipidome, glycome).
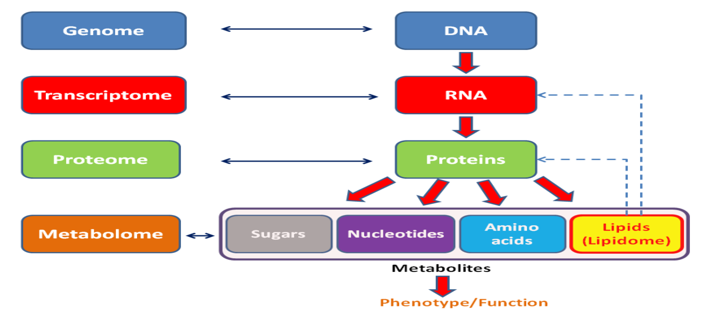
After some success and some order in the genome and proteome, it’s time to tackle the transcript and metabolome. A huge array of cells in the human body turned out to be practically unilluminated by science; cell atlases did not exist. There was no answer even to the question about the number of cell types. The basis of cellular (cytological) diagnostics is the study of cells, their types, changes in their distribution in organs, location, interaction and structure.
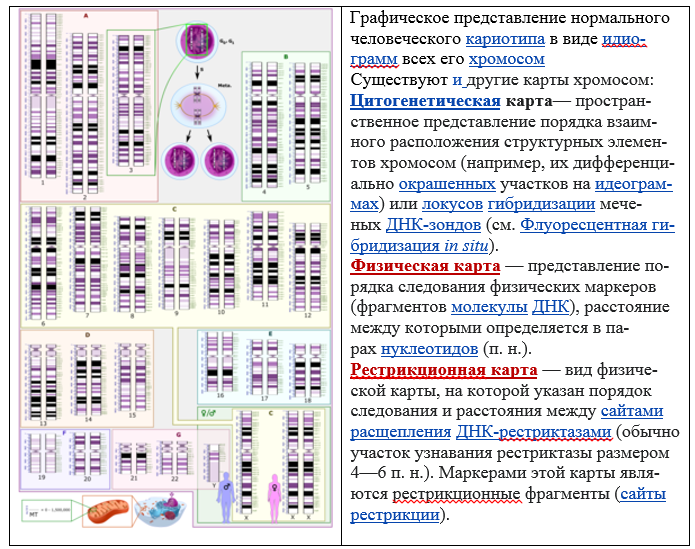
The ultimate goal of studying genome of a specific organism is the integration of its genetic, cytogenetic and physical maps, as well as their linkage to the complete genomic sequences.
Genome mapping is also possible using bioinformatics methods. To do this, the genome is first sequenced, the resulting reads are aligned, contigs and scaffolds are obtained, which are then mapped onto the genome using special mapping programs.
Cytological diagnostic criteria include analysis of the cellular and non-cellular composition of organisms: the number of cells, the presence of cells of different types, their location in structures or separately, the type of structures, size, shape, structure of cells and nuclei, the presence or absence of cellular and nuclear polymorphism and other parameters.
By the nature and severity of deviations from the normal cellular composition, the nature of the pathological process is judged. Based on the characteristics characteristic of certain tissues, the tissue identity of the tumor is judged. In this case, the background of the drug is taken into account – blood elements, structureless substance, colloid, fat, etc.
The next step is to study the metabolome and develop a theory of metabolomics.
Metabolome can be defined as the complete set of low molecular weight metabolites in the body and includes different classes of chemicals
Basic concepts and terms
Every cell in the human brain contains the same sequence of DNA, but in different types of cells, different genes are copied onto strands of RNA for use as protein programs. It is because of the diversity of proteins that there are so many types of cells in the body and in the brain, which makes our brains so complex. Let us reveal some important terms and concepts for understanding the context.
Transcript – molecule RNAresulting from transcriptions (expressions of the corresponding gene or plot DNA).Examples of transcripts are: mRNA, rRNA,tRNA, small RNAs.
Transcriptome (English transcriptome) – the totality of all transcriptssynthesized by one cell or a group of cells, including mRNA And non-coding RNAs. The term “transcriptome” can mean the complete set of transcripts in a given organism or a specific set of transcripts (RNA molecules) present in a certain type of cell. The transcriptome can vary greatly depending on environmental conditions. It includes all transcripts of a given cell and also reflects the profile gene expression at a given moment in time.
Transcriptomics is a technology that identifies all messenger RNAs encoding proteins, determines the amount of each individual mRNA, and determines the patterns of expression of all genes encoding proteins.
Spatial transcriptomics is a technology that allows researchers to observe (and observe) patterns of gene expression in tissues while maintaining their spatial context. One powerful platform in this area is 10x Genomics Visium coupled with Illumina sequencing. Its main provisions are illustrated in the figures below.
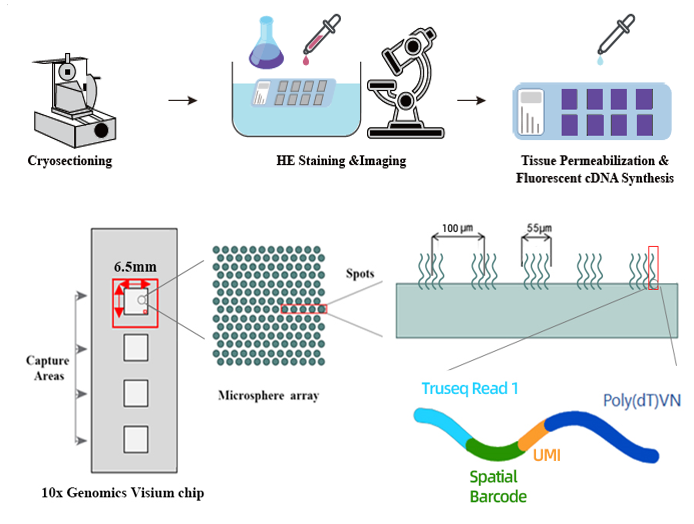
Designed by a spatial transcriptomics method that allows the analysis of individual cells in tissue sections. The method involves tissue sectioning, staining, recognition of individual cells using artificial intelligence, automated microdissection of cells with a laser, protein extraction and sample analysis using mass spectrometry, including cataloging all the RNA in individual cells. The results of the analysis can then be overlaid on an image of the tissue section, thereby highlighting spatial differences in transcriptomic profiles.
Splicing (from the English splice – to splice or glue the ends of something) – the process of cutting out certain nucleotide sequences from RNA molecules and joining the sequences that remain in the “mature” molecule during RNA processing.
RNA sequencing (English RNA sequencing, RNA-seq) – method of determination primary structure molecules RNAwhich is a highly sensitive and precise tool for studying transcriptome. This can be meant as sequencing mRNAand the definition of the sequence non-coding RNA. Modern whole genome sequencing is based on direct sequencing of fragments cDNA.
Expression genes – the process during which hereditary information from a gene (sequence nucleotides DNA) is converted into a functional product – RNA or protein. Some stages of gene expression can be regulated: these are transcription, broadcast, RNA splicing and stage post-translational modifications of proteins. The process of activation of gene expression by short double-stranded RNA called RNA activation.
Methods for determining gene expression are currently RNA sequencingcontaining poly-A tail (mRNA), as well as the use of expression DNA microarrays. RNA sequencing is becoming an increasingly common method due to improvements in next generation sequencing methods. RNA sequencing not only makes it possible to determine the expression level of each protein-coding gene in the genome, but also to distinguish between the resulting mRNA variants alternative splicing.
Transcriptomic technologies (English transcriptomics technologies) – methods developed to study transcriptome (that is, the totality of all RNA–transcripts) organism. The transcriptome includes all transcripts that were present in cage at the moment RNA isolation. By examining the transcriptome, it is possible to determine which cellular processes were active at one time or another.
There are two fundamental principles in transcriptomics. method: microchipsallowing to identify the presence and quantity of certain transcripts, and RNA sequencing (RNA-Seq), which uses methods sequencing next generation to obtain the sequences of all transcripts. The type of cells in a mouse brain is determined by methylation: chemical markers—“barcodes”—along the DNA that determine when genes are turned on or off.
Transcriptomic Database are constantly growing and becoming more and more useful for researchers. This is due to the fact that correct interpretation of data obtained during a transcriptomic experiment is almost impossible without relying on previous studies.
Chronology
1970 RNA Libraries, cat. converted to complementary DNA (for the butterfly)
1979 Collection of a cDNA library for silkworm mRNA
1980 Transcripts were obtained (Sanger chain termination method) by reading base pairs (bp)
1990 Transcriptomics becomes a biological science
1991 Sequence of 609 mRNA obtained from human brain
1995 1st transcriptomic method based on sequencing, serial gene expression analysis
1997 First study describing 60,633 transcripts expressed in S. serevisiae
1998 The term metabolome was introduced, coined to match existing terms
2003 A book on metabolomics was published
2005 Sequencing technology with a read length of 0.7 billion bp. (454 Life Sciences platform)
2006 Sequencing technology read length 50-300 bp 900 billion bp (Illumina platform)
2008 2 human transcriptomes were obtained from millions of sequences from 16 thousand genes
2008 Sequencing technology with a read length of 50 bp. 320 billion p.o. (SOLID platform)
2010 Sequencing technology with a read length of 400 bp. 30 billion p.o. (Ion Torrent platform)
2011 Sequencing technology with read length 104 p.o. 320 billion p.o. (Pac Bio platform)
2015 Simple. The procedure produces transcriptomes of people with different diseases of tissues (cells)
2016 RNA-Seg launches hosted in the NCBI SRA database
2017 Launched Cell Census Network (BICCN) – a consortium of centers in the USA and Europe
2019 Sequenced RNA from the skin, cartilage, liver and muscles of a 14,300-year-old Tumat puppy.
2021 Atlas of the mouse metabolome at different stages of its life is published on the Internet.
Cell type mapping challenge
The basis of cytological diagnosis of organisms is the study of cells, changes in their location and structure. The criteria for such diagnostics include analysis of cellular and non-cellular composition: the number of cells, the presence of cells of different types, their location in structures or separately, the type of structures, size, shape, structure of cells and nuclei, the presence or absence of cellular and nuclear polymorphism and other parameters.
By the nature and severity of deviations from the normal cellular composition, the nature of the pathological process is judged. Based on the characteristics characteristic of certain tissues, the tissue identity of the tumor is judged. In this case, the background of the drug is taken into account – blood elements, structureless substance, colloid, fat, etc.
Cell type mapping challenge in tissues is of interest both from the standpoint of fundamental science and medicine. The latest spatial transcriptomics technologies help solve this problem: cells of different types synthesize a different set of RNA (transcriptome) and proteins (proteome), which makes it possible to distinguish them from each other.
The principle of 10x Genomics Visium lies in a special chip. Captured RNA molecules from tissue are then tagged with advanced molecular identifiers (UMIs) during the reverse transcription process. The combination of spatial barcode patterns and UMI ensures the accuracy and specificity of the generated data.
Using this spatial transcriptomics query, researchers can gain a deeper understanding of the spatial organization of cells. and complex molecular interactions occurring within tissues, invaluable theory about mechanisms, conferences based on biological processes in various fields including oncology, neuroscience, developmental biology, immunology. and botanical research.
Areas in the tissue sample were identified for analysis, the results of which determined the RNA composition in each.  It was assumed that this would make it possible to determine what type of cells are located in a particular area. As always, difficulties could not be avoided.
Firstly, in a tissue there can be many cell types that differ little in RNA composition, for example, of stromal origin, which significantly complicates their identification.
Secondly, the size of the tissue sections being studied is usually much larger than the average size of cells, as a result of which each contains a mixture of RNA from different types, which complicates subsequent processing.
Given these limitations, processing cannot be done with the manual labor of researchers alone; scalable computational methods are needed. An international group, which included a representative from the Russian Federation, developed a cell2location tool that reveals the spatial distribution of cell types based on single-cell sequencing data in spatial transcriptomics.
The system compares the amount of RNA in spatial data with reference RNA expression profiles for the cell types present in the tissue, determining the exact number of different cells in each of the experimentally studied areas. The cell2location tool effectively corrects for various sources of experimental bias, allowing the integration of cellular and spatial transcriptomics with higher sensitivity than existing tools. This tool is universal and allows you to find rare types of cells that cannot be detected by traditional histological methods.
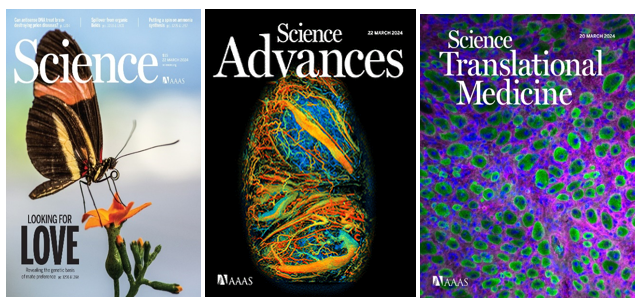
As part of the project, scientists published 21 new articles in three journals: Science, Science Advances and Science Translational Medicine.
The era of cellular research into the human brain is knocking on our door!
Brain Research through Advancing Innovative Neurotechnologies (BICCN) project. It launched in 2017. In October 2021, the BRAIN Initiative Cell Census Network (BICCN) completed the first phase of a long-term project to create an atlas of the entire mouse (mammalian) brain, comprising 17 studies, including an atlas and census of cell types in the primary motor cortex.
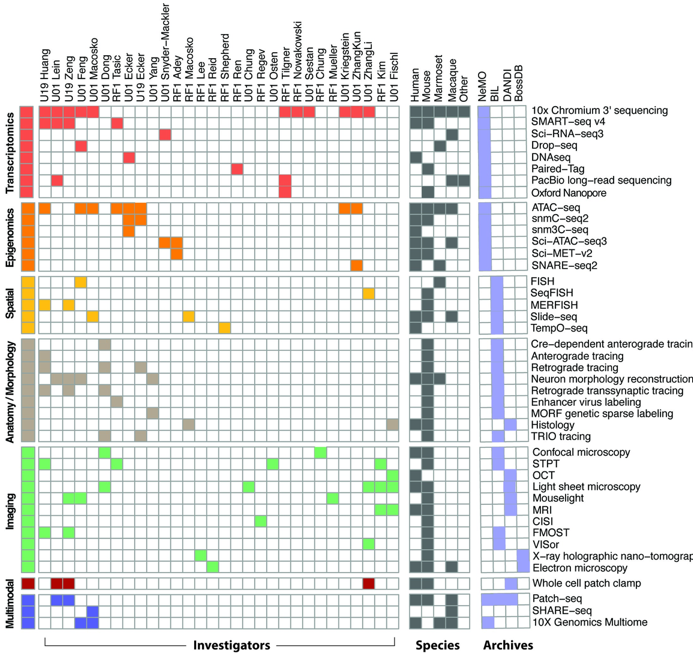
Data, tools and knowledge for cell types
Below are the data generation projects associated with BICCN and their methods for profiling specific cell types. Filled cells indicate ongoing and planned data acquisition in mice, non-human primates, and humans. More detailed information on each project is available at team pages portal.
Role of the BCDC is in ensuring public access and organization of complex data, tools and knowledge generated by BICCN. The BICCN Portal serves as the starting point for BICCN activities and provides access to BICCN data sets stored in the R24 data archives. As our knowledge of the interrelationships of BICCN data modalities is revealed, a summary of cell type knowledge will be presented that will help improve our understanding of the role of cell types in the brain.
All BICCN data that meets accepted quality control standards is immediately available to the public through several R24 data archives and accessible through this website. Archives BICCN data include:
Of particular interest now is the use of modern tools:
structural and functional magnetic resonance imaging (fMRI),
diffusion MRI,
magnetoencephalography (MEG),
electroencephalography (EEG),
positron emission tomography (PAT),
near infrared spectroscopy (NIRS)
and other non-invasive scanning methods for imaging anatomy,
physiology, perfusionfunctions and phenotypes human brain.
The data has been archived by the Cell Census Network (BICCN) and allows researchers to address fundamental scientific questions about the human brain and its genetic organization. The main goal of BICCN is to characterize cell types and their functions in human, nonhuman primate (NHP) and rodent brains.
Using cutting-edge technologies that have so far largely been applied only to animals, the cellular composition of the adult and developing human brain is being studied at the transcriptional, epigenetic and functional levels.
The studies are organized around five main themes:
(i) an adult human single cell atlas, including studies using single cell transcriptomic and epigenomic analyzes to characterize the human brain;
(ii) the adult nonhuman primate (NHP) single cell atlas, which focuses on similar single cell analyzes in the brains of marmosets and macaques;
(iii) comparative single cell analysis that compares the cellular composition of human and NHP brains;
(iv) single-cell analysis of human brain and NHP development aimed at characterizing the dynamics of human brain and NHP development;
(v) functional and anatomical analysis and modeling of human neuronal cell types, which includes physiological and anatomical characterization of cellular properties in living human tissues, as well as modeling of cell types and specialized cellular properties in humans compared to rodent models.
Thanks to more subtle techniques, it has become possible to see which genes are active in different brain cells of the most important organ of humans and animals, that is, by developing the idea of detailing the study, it becomes possible to understand and appreciate the diversity and complex relationships of cells.
The characteristics of any tissue in the body are determined by its cells, and their specificity is determined by which genes are active in their DNA. What everything actually looks like is still unknown. Little is known about how cells communicate with each other.
The scientists also used another technique that analyzed the three-dimensional structure of DNA molecules in each cell to gain additional information about which DNA sequences were actively used. Information taken from the portal “Scientific Russia” (https://scientificrussia.ru/)
In an experiment on mice, more than 3 thousand brain cells were studied. The mouse brain consists of approximately 100 million cells. Each nerve cell is approximately 20 microns in diameter, and glial cells are 10 microns in diameter. For each cell, it was determined which of the 20 thousand genes was active. All mouse brain cells were divided into 47 types: specialized neurons, blood vessel cells and auxiliary cells of nervous tissue called glial cells. They provide removal of cellular waste, protection against infection, and supply of nutrients.
The resulting map of the brain allowed scientists to identify previously unknown cell types, such as six different types of oligodendrocytes, cells that form the electrically insulating myelin sheath around nerve cells.
A detailed map of mouse brain cells shows which genes give rise to specific cell types. This gives science the key to developing methods for effective diagnosis and treatment of many nervous diseases, such as multiple sclerosis.
Conclusion
What is happening to human science? Man as an object of nature is studied by many sciences and in some of the sciences impressive results have been obtained. In general, we can say that science knows very little about man. Biology is being introduced most intensively into the field of human science. But the object is so complex that even the principles of origin, evolution, development and functioning, conscious behavior are not completely clear.
The creation of atlases and mapping of cells has a real positive impact on the progress of research on living organisms and the brain, since the cell lies at the basis of life and possibly intelligence.
Literature
Molino BJ, Arlotta P, Menezes JR, McLees JD, Neuronal subtype specification in the cerebral cortex. Nat. Reverend Neuroski. 8 427–437 (2007).
Klausberger T, Somogyi P, Neuronal diversity and temporal dynamics: unity of hippocampal operations. The science 321 53–57 (2008).
Sugino K, Hempel SM, Miller MN, Hattox AM, Shapiro P, Wu K, Huang ZJ, Nelson SB, Molecular taxonomy of the major classes of neurons in the forebrain adult mouse. Nat. Neurology. 9 99–107 (2006).