Analysis of data skills in HH.ru vacancies
Hi all!
In this article I will tell you about a mini-project to analyze the skills that are listed in vacancies on HeadHunter by specialization:
Objective of the project
The main goal of the project is to develop a tool for reviewing and searching for vacancies based on the experience and skills of the applicant. Using the tool, the user can look at the skills in demand in vacancies, decide how to search for vacancies for his existing skills, and decide on areas that he sees in demand and needs to study them.
Project structure
The structure of the implementation work was divided into 3 steps:
Collection of vacancy data
Cleaning and preparing data for analysis
Data visualization – building a dashboard
Next, I will write out a summary of each step separately with links to the project repository and the final result in the form of a dashboard.
Collection of vacancy data
The source of data is the HeadHunter website, or to be more precise – their open REST API
The whole point of this step lies in 3 points:
get a list of vacancies for a specific API request with search parameters
region: Russia,
specialization: (BI analyst, data analyst; Data scientist; Product analyst)
period: first I uploaded for the entire time, then every day I took the last dayget detailed information for each vacancy from the list of received url vacancies at the previous step
write the received data to the database
You can find the logic for retrieving data and writing data to the Postgres database in the functions file in the repository.
According to the data model there are 3 tables, ddl scripts are here
url – a table for storing links to vacancies. needed to determine the increment, for which vacancies data has already been received, and for which ones still need to be obtained.
vacancy – a table with detailed data on the vacancy. 1 row in the table = 1 vacancy
skill – a table with the listed skills in vacancies. One vacancy can contain many skills, so the skills were moved to a separate entity.
The logical data model looks like this

I use Postgres as a database. I use Apache Airflow as an ETL orchestrator (doug's code to run the script every day). First, all job urls received from the request are recorded in the url table. The second task of the dag begins to parse those vacancies for which data has not yet been collected and record them in the database. There are several disadvantages of this scheme, which I will write about at the end of the article.
Cleaning and preparing data for analysis
Data preparation takes place in 2 stages
At the stage of preprocessing the received data and loading it into the database (main function for data transformation)
Building a data mart (showcase build script vacancy_dm)
In the showcase, the data is filtered again, the names of skills are standardized, and the average salary for the specified bracket is calculated. There is a lot of garbage in the names of skills, or the same skills are written differently, so a lot of CASE is used. You can wrap this up and put it in a separate function, or maybe even write it more briefly and effectively.
Data visualization

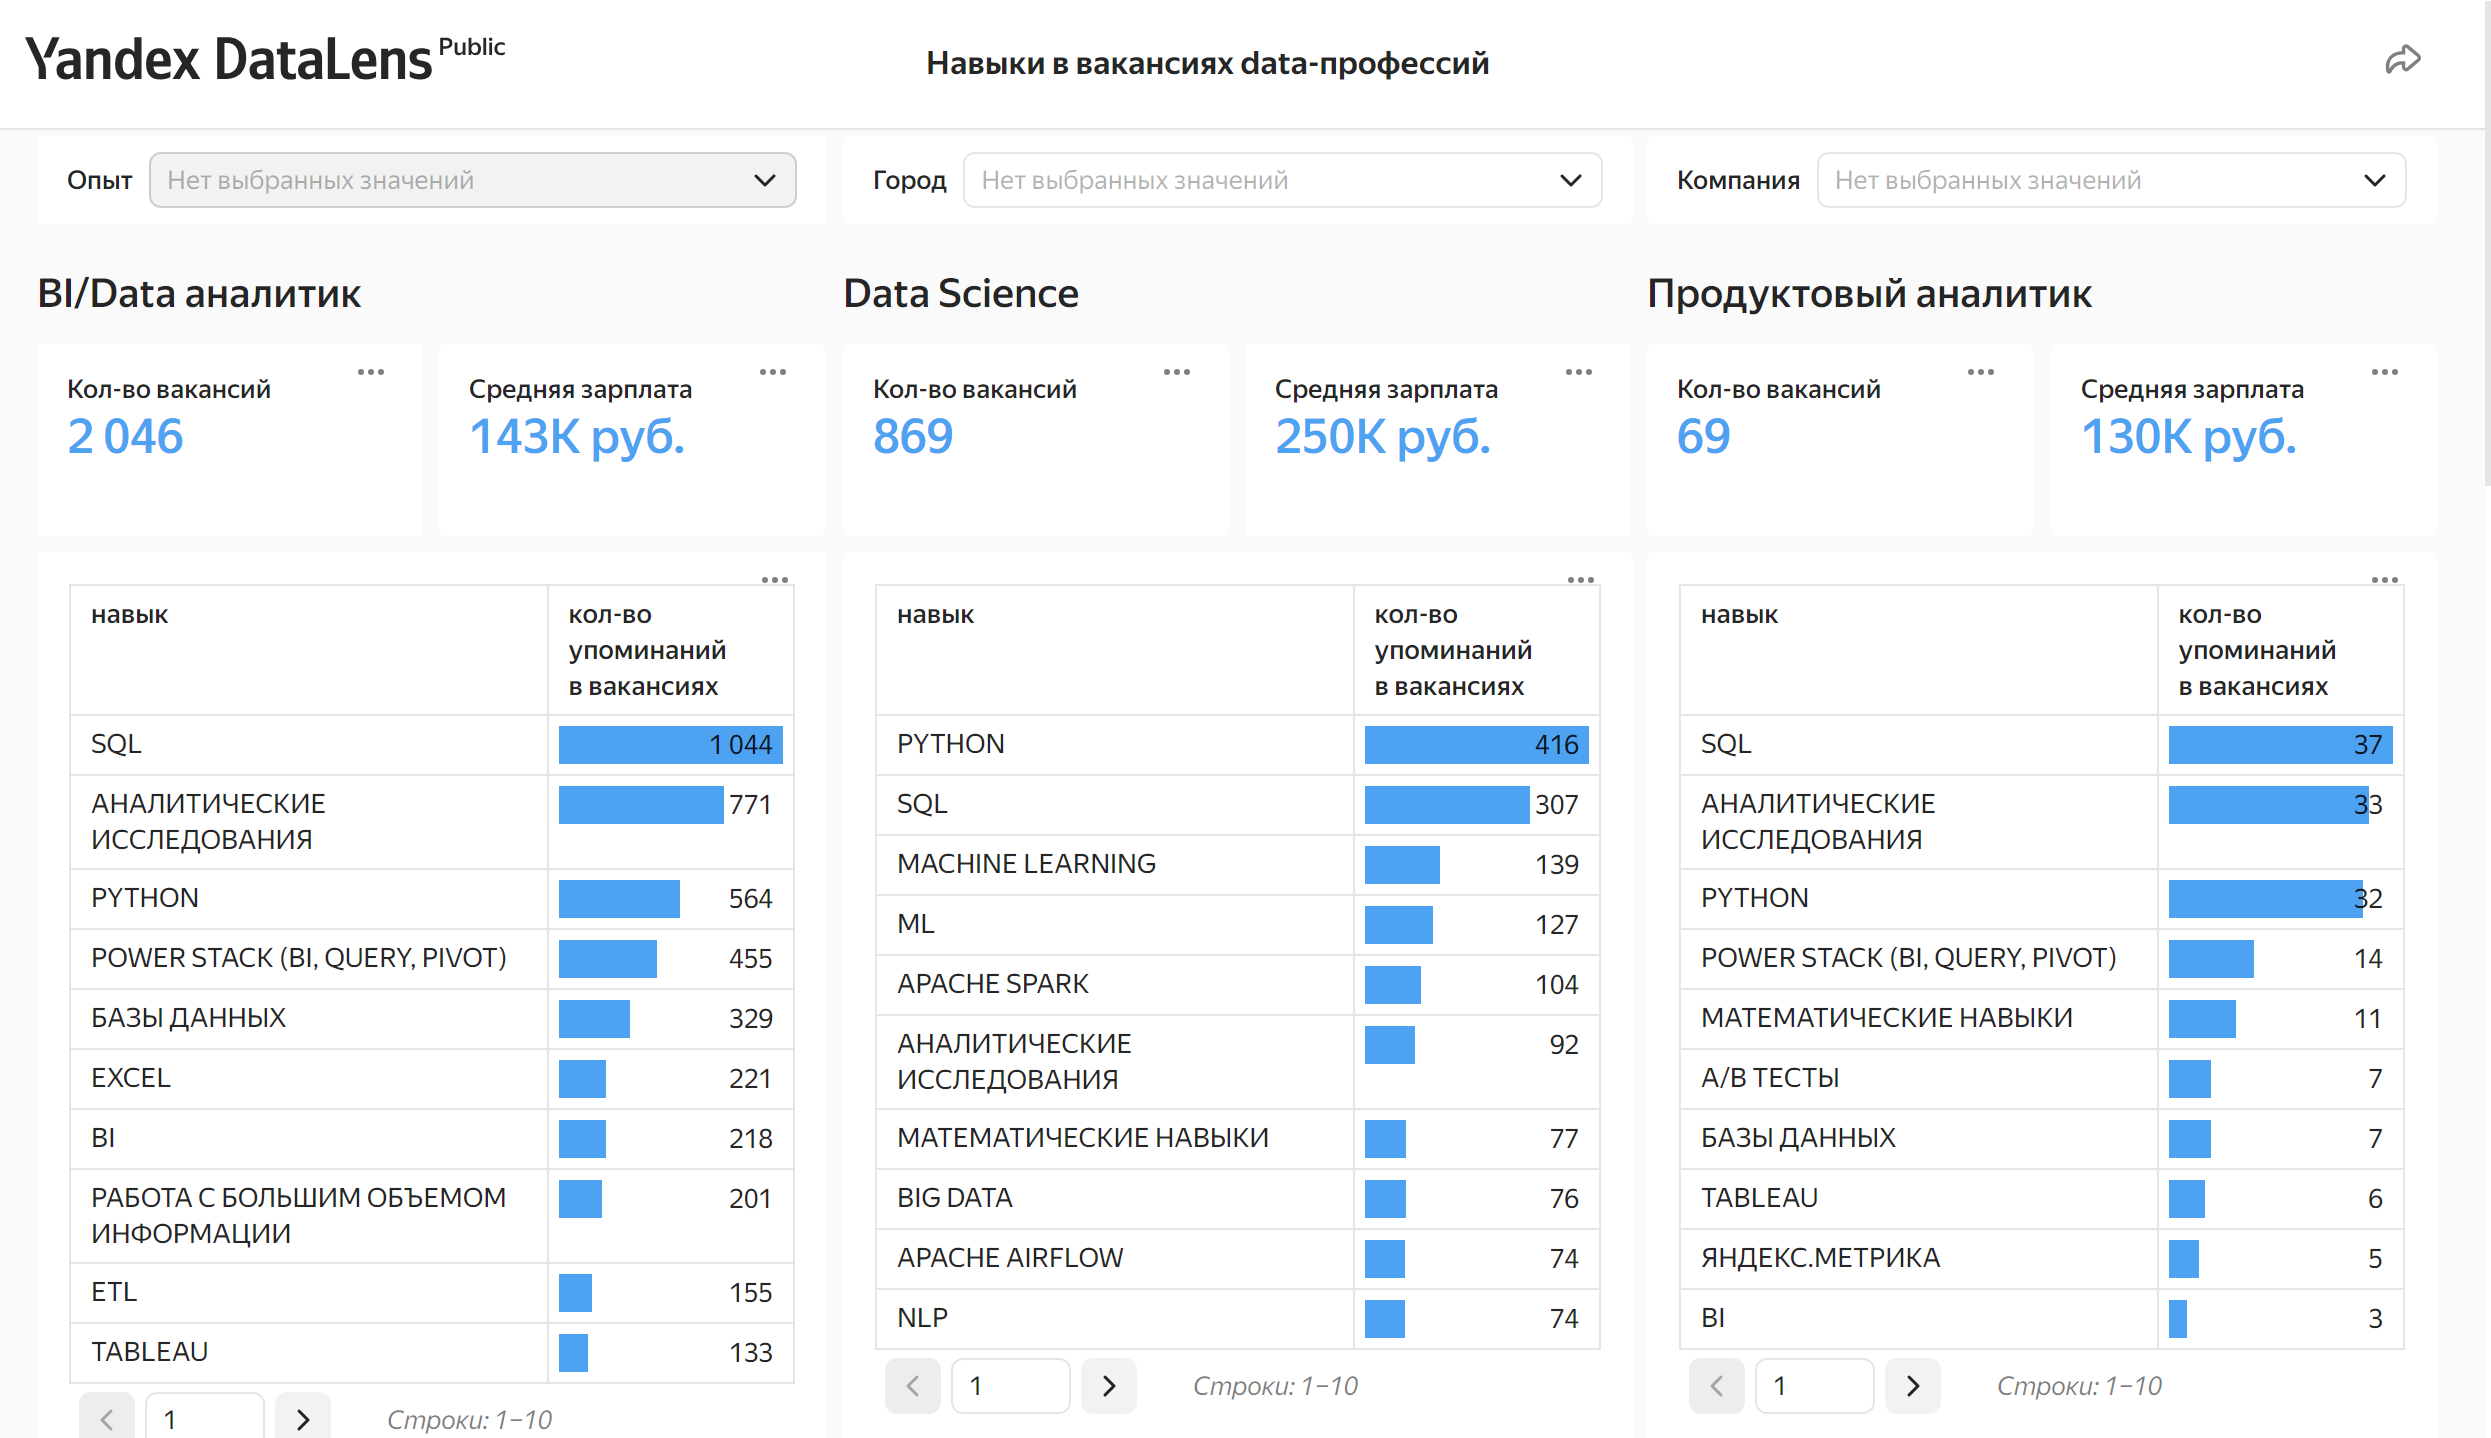
At the visualization stage, it was important to provide the user with a simple and understandable tool for comparing in-demand skills in different specializations depending on experience, region, and company.
The main metrics are:
– number of published vacancies
– average salary (according to the specified forks)
– top frequently mentioned skills in vacancies
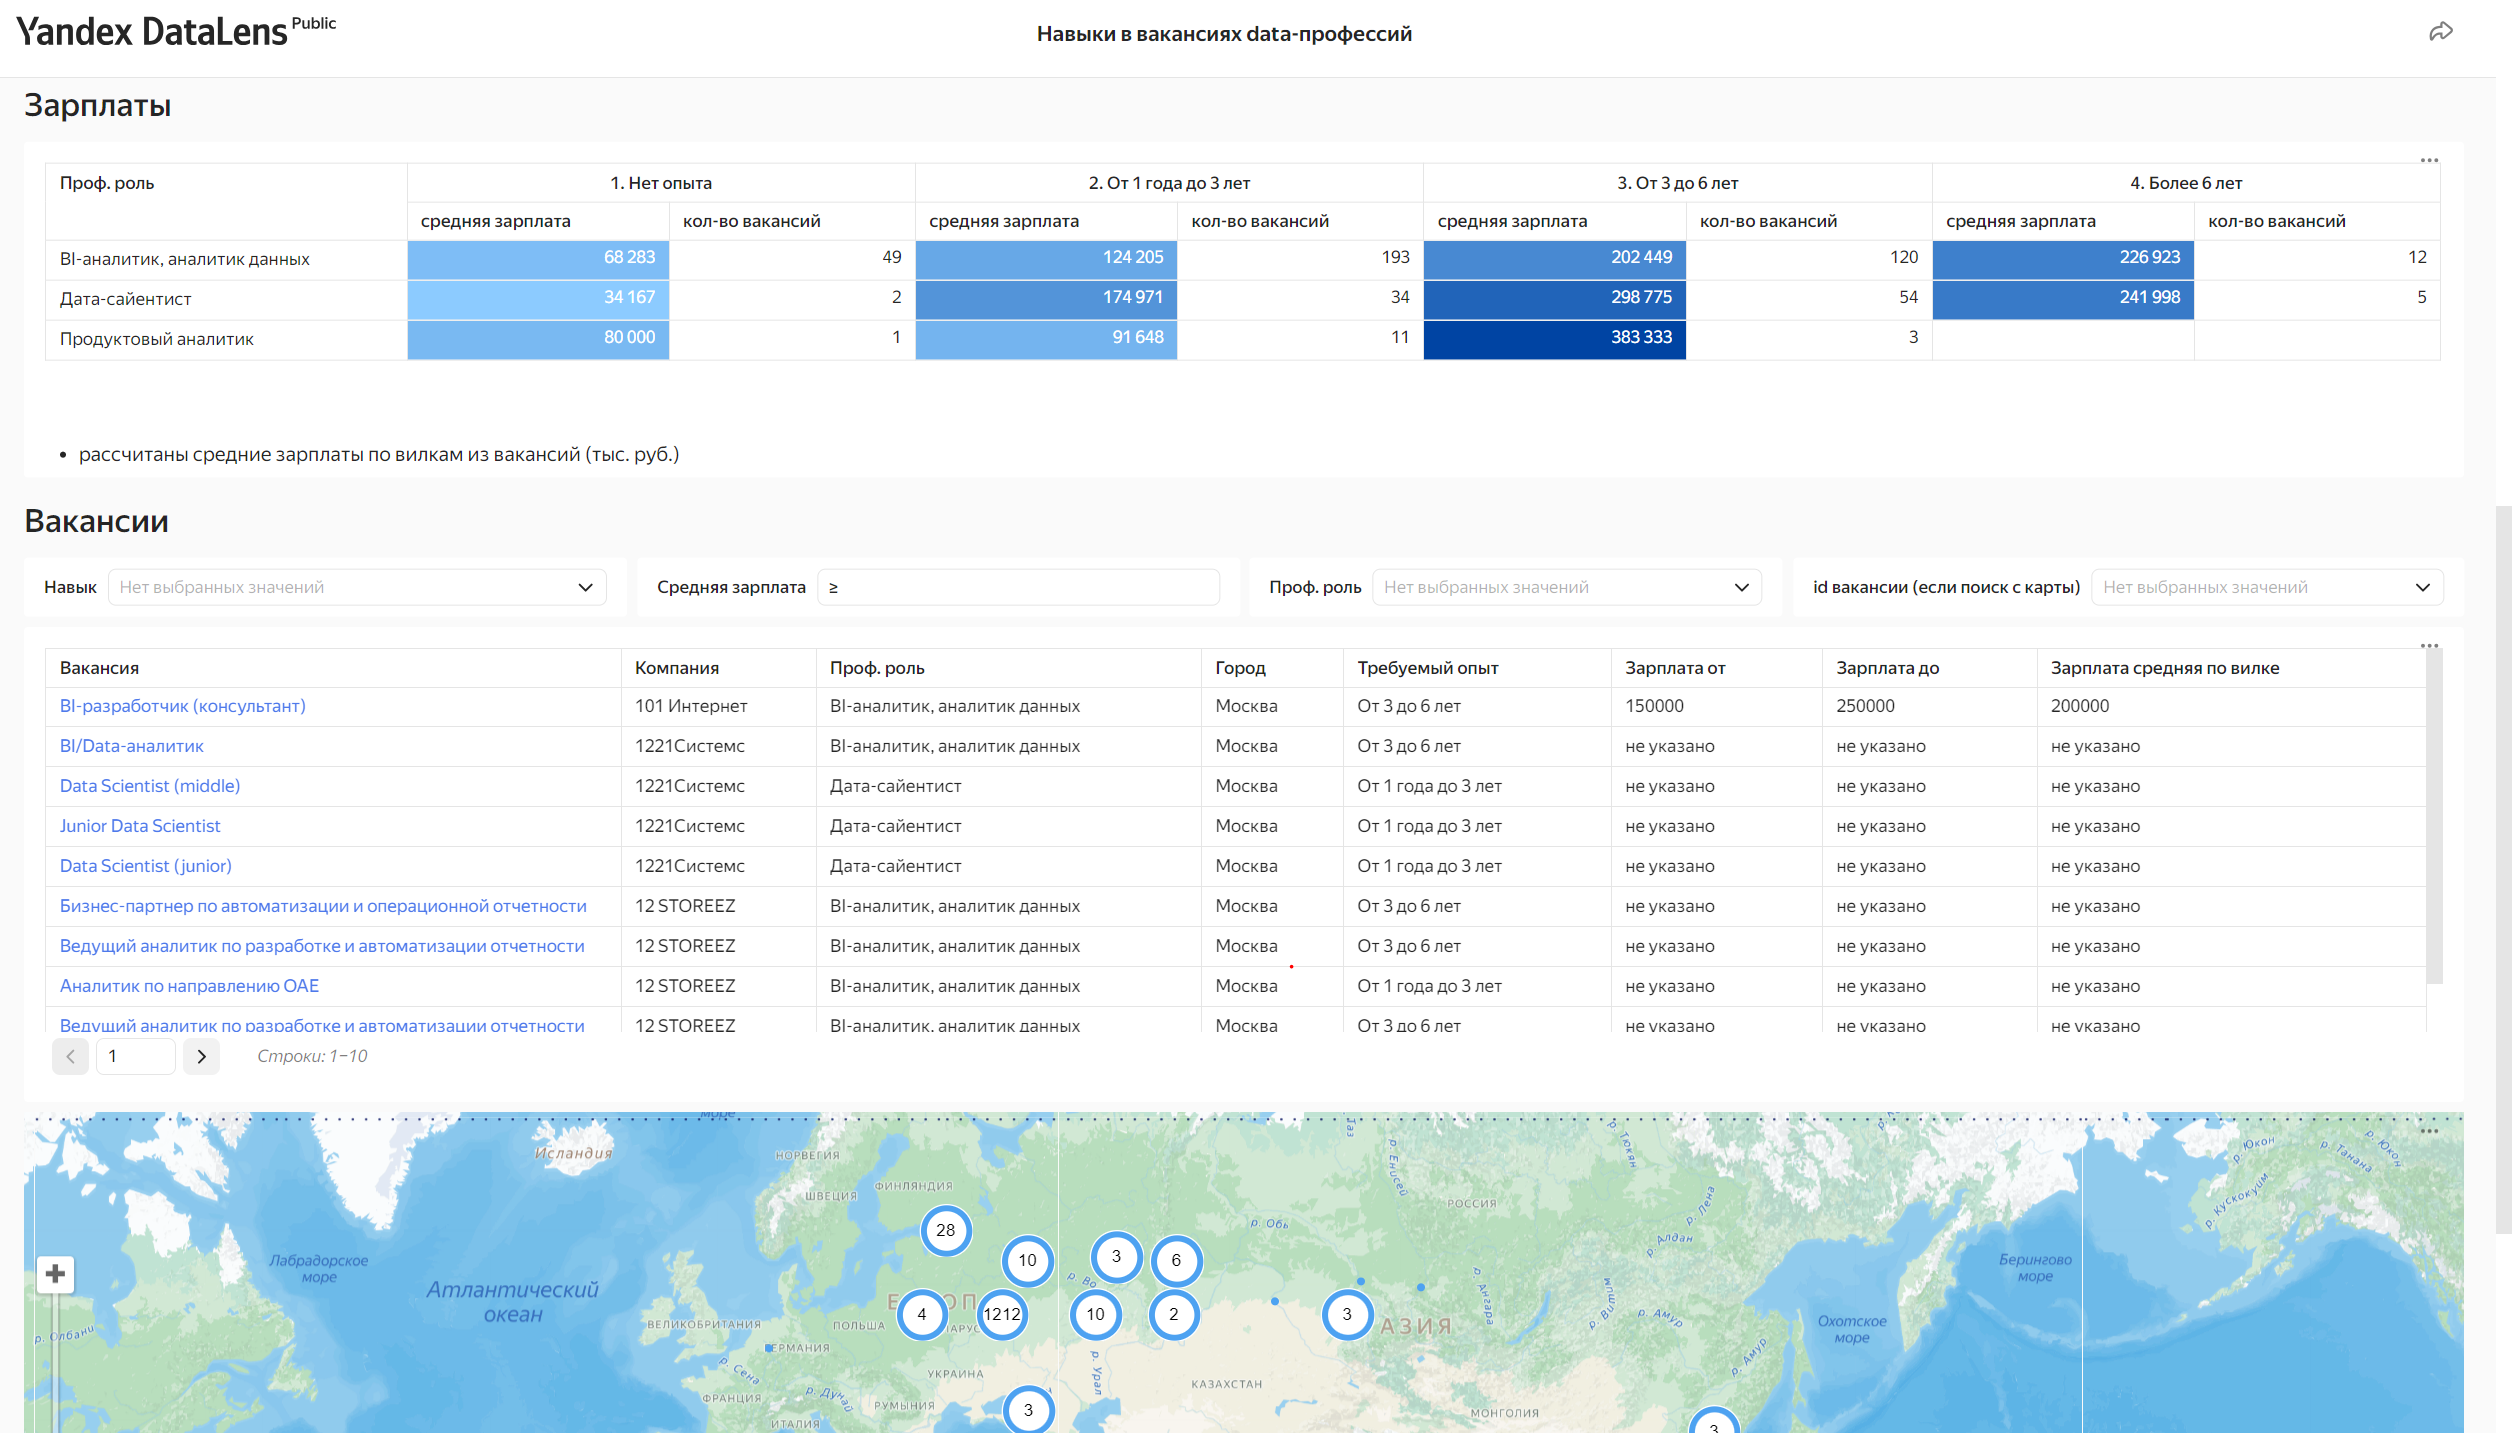
As an auxiliary part of the dashboard, a more detailed view of specific vacancies is available in a table, on a geographic map by specifying the necessary filters, including the average salary. An analysis of the average salary by specialization and required work experience is also available.

The dashboard is publicly available on Datalens. Below are links to 2 versions:
I hope that the dashboard will become your auxiliary tool for assessing your skills and the required skills in vacancies on the market)
Future improvements and limitations
The current implementation of the project has its own limitations and shortcomings that you can try to get rid of.
If a job is updated on HH, the update will not be collected into the project database.
Now the work with the increment is carried out in such a way that the id of vacancies are determined for which there is no information in the vacancy table. If a vacancy on the site is updated with the current id, these updates will not be processed.The analysis does not take into account the archiving status of vacancies.
If the vacancies are closed, the archiving status will not be indicated in the data (due to the limitation of the 1st point). Those. The dashboard is not suitable for a specific search for current vacancies and there may be cases where, when you click on a link, you will be redirected to an already closed vacancy. However, data from closed vacancies is still relevant for the main purpose of the dashboard – skills analysis.The skills analysis uses the job skills listed in a separate “Key Skills” field, and not all jobs have this field filled out with the entire list of skills actually required. Many of the actually required skills are written directly in the text of the job description, and not in a separate block. Analysis of the full text of the vacancy is currently not implemented.

The average salary is calculated according to the range from-to indicated in the vacancies. You should trust this indicator very roughly
I will be very glad if after reading the article you subscribe to my Data Study channelin which I publish a lot of useful materials about analytics and data engineering.
Daniil Dzheparov, data analyst and channel author Data Study


