when they can be useful and how to use them
Many teams are faced with the need to formalize their performance metrics to assess the quality of their work and identify possible problems. There are many metrics that are used to evaluate teams, create SLAs, KPIs, visualization dashboards and charts, and other tools.
For mature teams, these metrics help a lot:
notice periods of low team performance and lack of resources;
monitor indicators such as the overall buggy of the service, the response time to various events, the number of tasks that the team can simultaneously process, and other important points;
compare the performance of teams in the division ahead of the upcoming review period.
My name is Katya, I manage the Music and Bookmate testing services, and in this post I want to talk about the main metrics that we use in the Yandex Music testing team and discuss how to work with them correctly.

Service Level Agreement (SLA)
The time the ticket was taken for testing. It monitors the time for which the ticket is taken for testing after it is ready. Weekends, holidays and non-working hours are excluded. The metric shows how quickly the team responds to incoming tasks.
A big topic for a holivar: why is the time to complete the work (task testing) not taken into account? If you only monitor the response time, then what prevents the tester from quickly recruiting 100,500 tickets for work?
First, any metrics can be hacked. How you use metrics in your project is a matter of goal setting and team culture (more on that in the conclusion).
Secondly, we have a graph that shows the time spent by a task in a certain status. In the context of the Testing status, the graph is rather auxiliary. There are a number of tasks that can be tested fairly quickly, and there are those that can take a huge amount of time to test. Therefore, we did not try to derive a single maximum testing time for everyone.

Ticket response time, who arrived at the support. It is counted from the moment the ticket is transferred from the support to the testing or development team until the moment this ticket is taken into localization. The speed of the response of the testing team to the request transmitted from the user is monitored.
This is important for user satisfaction and prompt resolution of problems. It is important to note that the testing team is not the first line of response to user requests. We are talking only about those requests (for example, bugs or problems) that have passed through several support lines and require the intervention of developers or testers. The response speed here should depend on the priority of the call (can be determined by the number of calls per unit of time).

For these two targets, we build charts, plus there is automation that reports the penetration of targets. For example, when users apply in bulk on one topic, automatic replies come to chats.
Key Performance Indicators (KPIs)
The maximum number of tasks that are ready for testing at a time. This metric measures how well the team is keeping up with the current workload and how quickly they can switch between tasks.


Bug fixes metric. The ratio of introduced bugs to fixed bugs for each platform. This metric helps evaluate the effectiveness of the bug fixing process and determine if improvements need to be made to the development or testing process.

Bug metric
Automatic bug criticality
Criticality is almost always subjective. For a manager, a bug found within his beloved feature may seem critical, but in fact, if you look wider (within the entire service), then the criticality will be lower.
It becomes a little easier if there is some generally accepted (within the framework of the service) formal description of what is considered a blocker and critical. Therefore, before you start reviewing your backlog under a magnifying glass, try to make the process of setting criticality more transparent.
We entrusted this responsible task to an impartial robot. As a result, the criticality of the bug is set depending on its weight.
Vol 1. Determining the weight and criticality of a bug
Hereinafter, we will consider the work of the process for one of the platforms so as not to overload the post.
So, how to calculate the weight of a bug and determine its criticality:
Step 1: determine the minimum required set of parameters that will be taken into account when setting criticality (it is determined individually for each product or service).
Browser
Browser | Weight |
All | 1 |
Chrome | 0.8 |
FF | 0.2 |
safari | 0.1 |
Reproducibility factor
Reproducibility | Weight |
Always / Stably Playable | 1 |
Intermittent/unstable playback | 0.2 |
Stage
Stage | Weight |
Production | 0.8 |
testing | 1 |
Important: By testing we mean regression bugs. In this case, Testing has more weight than Production, because regression bugs block the rollout of the release, and they need to be fixed before rollout.
Impact on the user
Influence | Weight |
Blocks scripts | 1 |
Critical functionality broken | 0.8 |
Creates inconvenience | 0.4 |
Cosmetic defect / not affected by the user | 0.1 |
Number of hits from users
Users can complain about the problem. If you have a hit counter set up for a specific issue, it can also be used to determine the criticality of a bug. Now you just need to remember that this number is also important to keep – it will allow you to understand which bugs have the greatest impact on users, and concentrate efforts on fixing them.
Step 2: create a formula for calculating the weight of a bug (it can also differ for each product or service).
zbpWeight = platform_factor * reproduction_factor * stage_factor_music * impact_factor * 100 + complaintNumber * 0.35
Step 3: determine the weight range.
Trivial | 0-19 |
Minor | 20-39 |
Normal | 40-59 |
Critical | 60-79 |
blocker | 80-100 |
Using the knowledge gained, you can honestly determine the criticality of the bugs. Go ahead.
Vol 2. Automatic calculation
The above input parameters are filled in manually by the bug author. And here it would be possible to distribute a calculator to all testers. It would be very painful to calculate the weight of the bug manually each time, so it is better to automate this process. The selection of tools for automation depends on the binding you are using: for example, you can automate through scripts or triggers in the issue tracker.
The ticket author fills in four fields, and VZHUKH – the weight is calculated automatically, the criticality also automatically changes based on the received weight.
Vol 3. Body kits for the process (improvers)
What else happens within the framework of the existing process: we call and punish the author of the bug report and the QA on duty if the required fields were not filled in for the ticket.
Service bug
About charts. Graphs are like hundred dollar bills – everyone loves them!
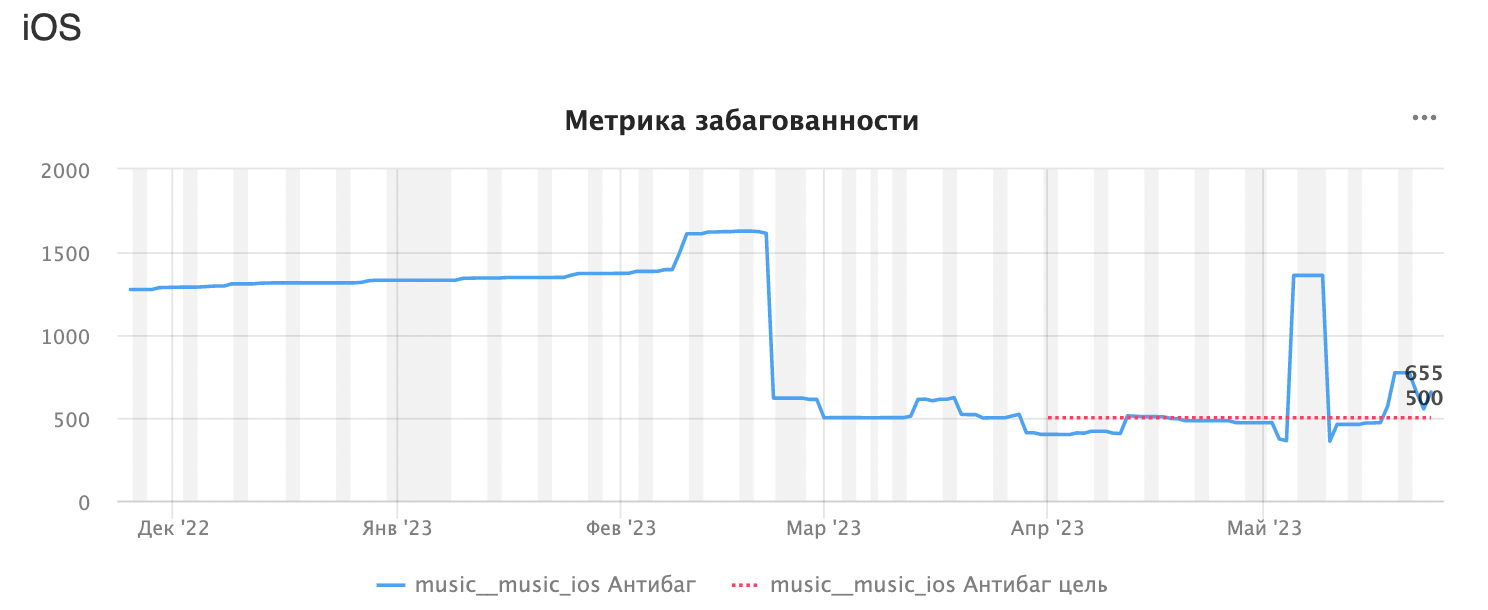
Seriously, we used to collect statistics on the total number of open bugs on each of the platforms. But on their own, these numbers mean nothing. It is conditionally possible to say whether there are many bugs or few, but this weakly correlates with the buggy of the service as a whole.
Therefore, we have acquired monitoring tools that make it possible to track:
general buggy of the service;
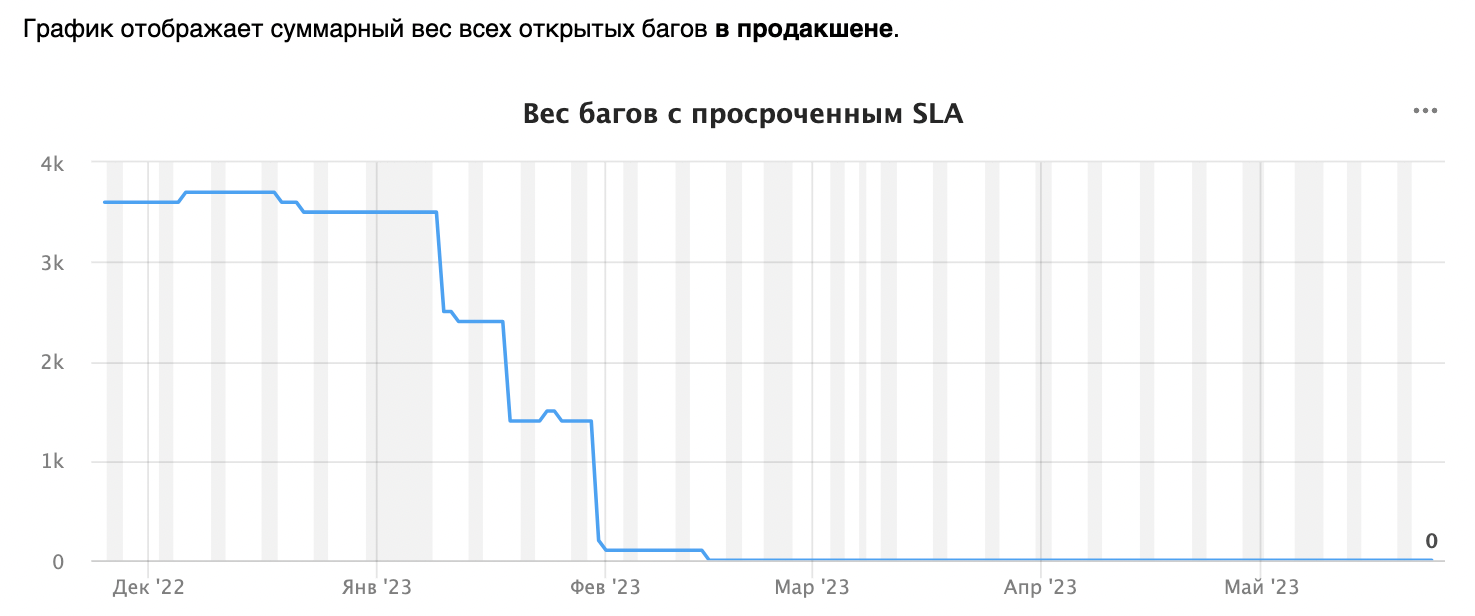
the appearance of blocking and critical bugs in the queues (and make sure that the time to solve them does not exceed the set SLA).

After weighing all the existing bugs, we found out that we not only have N unclosed bugs in queues, but also how priority they are, how they affect the overall picture of the service. Any new bug that affects the user and the Music will immediately show up on the chart. We can have dozens of open minors (their weight is small), which almost do not change the chart, or we can catch just one blocker, the weight of which significantly affects the chart, and it will be immediately noticeable.


When Metrics Might Not Be Enough
Creating an excessive number of SLAs and KPIs can result in a team focusing only on achieving the metrics, which can reduce motivation and engagement.
Evaluating team performance without context and comparison with other standards can be useless, as it does not provide an understanding of whether the results achieved are good or bad. Using metrics for monitoring is good. But in order to start pulling indicators on metrics or scolding employees, it’s bad.
If metrics are used only to evaluate the work of one department (for example, testing), this can lead to a lack of objectivity in the assessment and ignoring the relationship with other teams. Evaluating the work of one team in a vacuum does not give anything. It’s good when there is something to compare with, as well as an understanding of what you want to come to.
Metrics can be tweaked, so they should be used as a monitoring tool, not as absolute goals to be achieved no matter the circumstances. If you think of it as a tool invented by testing, implemented by testing, and used to evaluate the work of the test team, then it is better not to use it.
What is the result
Returning to the title of the article, I would like to answer two questions:
When can QA metrics be useful?
The need to implement and use any metrics should be determined by each specific team in each specific case. I would rather talk about usefulness. It is useful to use metrics because it allows you to notice deviations from the expected behavior in terms of such parameters as speed, quality, performance. And then take any actions that lead to process improvement.
How to use QA metrics?
Deteriorating indicators can signal, for example, that there is a lack of resources (then the team’s forces can be redistributed or hire more employees) or that current processes need to be reviewed (for example, the planning process for fixing bugs or introducing additional quality-gates).
The article lists the metrics that we use in our work. They were born from the needs, pains and ideas of our team. For each individual project, you can choose your own, but when choosing and implementing metrics, it is important to consider the context and limitations of each team. It is important to use metrics as a tool for identifying problems and opportunities for improvement, rather than as absolute measures of success.


