read the sensor readings and program the “Time Cube” in Node-RED
Hello again! In the last lesson, we looked at the Weather Station project for a smartphone. Today we will do a more complex project: “Time Cube”. This is a time management device that will help you keep a log of your own activities and know how much time you spend on work, study, reading, sports, games and other activities, as well as plan your day. An interesting gadget and a good example for teaching programming.
As we work on the project, we will start writing our own programs in Node-RED, explore the capabilities of Termux (a Linux emulator for smartphones) in more detail, and program a script that uses the smartphone’s sensors!

This lesson is part of the course Galaxy Upcycling – new life for an old smartphonewhose practice-oriented stories show how, within the framework of the Upcycling concept, to turn old Android smartphones into interesting, non-banal, beautiful and useful devices.
The text is based on the video:
Node-RED Basics
First, a little introduction to the Node-RED visual programming environment that we installed in the last tutorial. Let’s start writing the simplest programs in it.
In Node-RED, a program is called a flow (flow) and consists of individual nodes (node). Nodes are connected to each other by dragging links between them. Through these links go messages (messages), which have names (topic) and payload (payload).
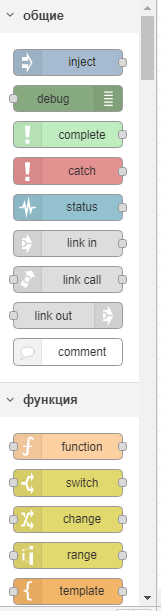
On the left is the nodes palette:
The most important node is the debug node. I recommend using it in any incomprehensible situation. If you pass a message to it, it will print to the debug console so you can find and fix the error.
Let’s make the simplest flow of two nodes: Inject (throw a message into the flow) and Debug (debugging).
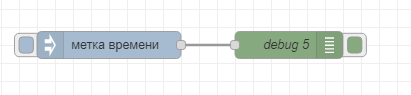
After we have placed and connected several nodes, the program needs to be deployed (deploy), after which its execution will begin.

By pressing the button on the “Time stamp” node, you can start the thread for execution. We see that in the debug console each time a message appears indicating the current time (Timestamp).
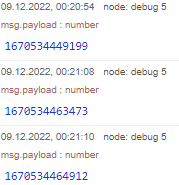
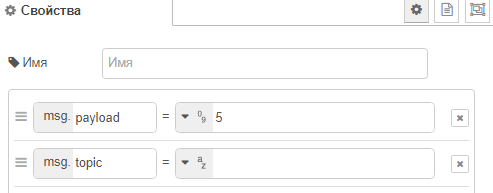
There can be any data, not necessarily time. You can force the node to send anything, for example the number 5, this is done in the node settings (double click).
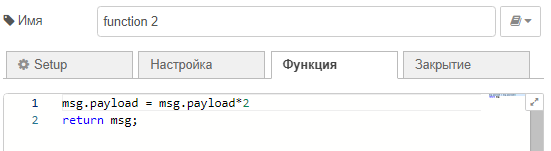
One of the most useful nodes is the function. You can write any JavaScript code in it.

For example, I can add the simplest code there, which multiplies by two everything that comes into the node, and then a dozen will come to the debug node, not a five.
The entire program written in Node-RED is JSON text, that is, one large text file. Therefore, to import a third-party program, just click on “Import” and paste its entire text. You can also easily export your program and share it.
In general, Node-RED is useful for teaching purposes as well as for rapid prototyping. For complex projects, visual programming is not very suitable; they usually write code in text format. But for smaller projects, Node-RED is a user friendly, simple and visually pleasing environment.
Access to smartphone peripherals via Termux-API
To move on, you must have Termux installed on your smartphone. If you don’t know how to do this, skip right now to the Weather Station lesson.
Install the additional software package Termux-API, it is downloaded from F-Droid: https://f-droid.org/en/packages/com.termux.api/. You need to give him all possible permissions. Also install the appropriate package in the Termux console:
apt install termux-apiEnter the termux-sensor -l command in the console and you will see an amazing list of sensors! It is very cool that the sensors have specific models, which means that you can learn more about each of them in the official documentation from the manufacturer. The list on different smartphones will be different, depending on the hardware of each specific device.

To display the readings of a specific sensor, use the command with the -s switch and enter the name of the sensor. In my example, I display the accelerometer readings:
termux-sensor -s "LSM6DSO Accelerometer"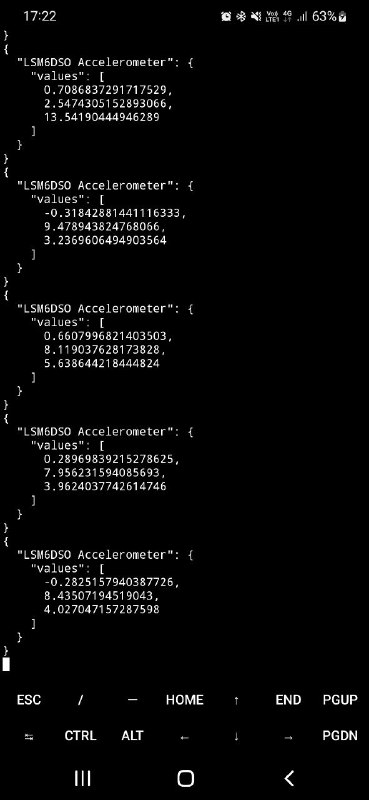
It can be seen that they are in the well-known JSON data format, which means that they are easy to parse and select only the value of interest to us. You can stop the process, as in regular Linux, with the CTRL-C command.
To get a single value, you can run the command with the -n switch set to 1:
termux-sensor -s "LSM6DSO Accelerometer" -n 1Displaying sensor readings in Node-RED
Back to Node-RED development! We put in it a package of nodes for working with Termux-API: https://flows.nodered.org/node/node-red-contrib-termux-api
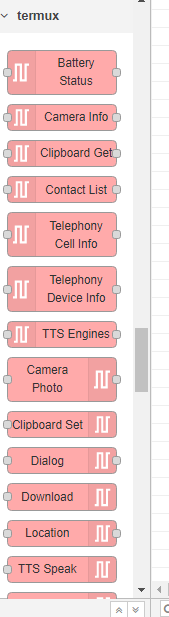
New nodes related to the functionality of the smartphone will appear in the left panel.
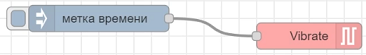
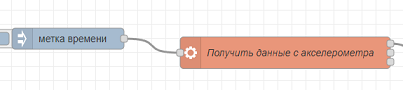
For example, let’s see how the vibrate node works – turning on the phone’s vibration motor. Let’s put a timestamp and from it a transition to the vibrate node. As soon as we click on the timestamp node, we will see that the phone vibrated.
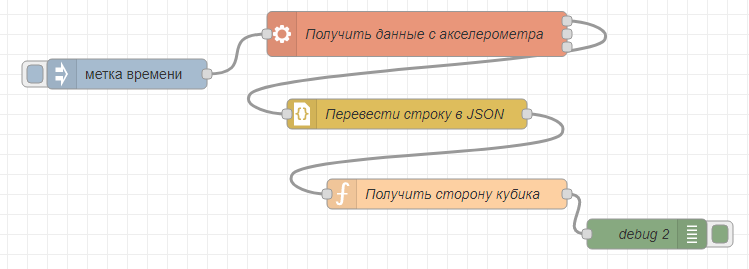
Now let’s make our sensor readings appear in Node-RED.
Any console command can be run through the node exec and get the result. Select such a node on the left and drag it to the program panel. Connect the output of the exec node to the debug node. Here’s what it will look like:
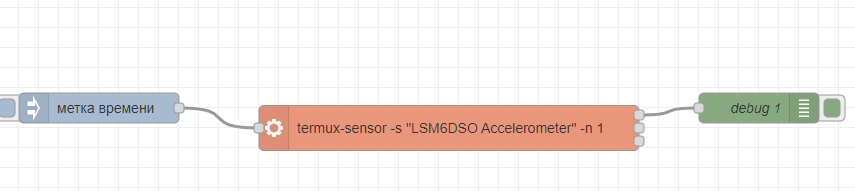
Now in the window on the right you will see the sensor readings:
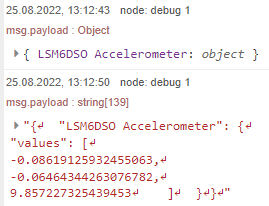
You can see that in the debug window, the output of the exec node contains a text string of three values: x, y, and z.
For convenience, I immediately renamed the node so that it was called “Get data from the accelerometer”. You can rename a node by opening the node parameters by double-clicking and changing the “Name” line.
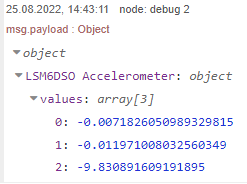
To work not with a string, but with an array of values, we will pass our string to the json function. This is a standard function that converts a JSON string into a JavaScript object.
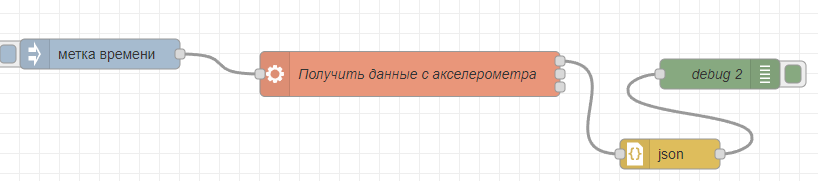
As a result of this, we will no longer have a text string on the debug node, but a JavaScript object:
Learn the edge of the cube from the readings of the accelerometer
Let’s write a simple function that, based on the obtained values of x, y and z, will show which of the six faces our cube stands on.
To do this, we will make a function node, in which we will begin to write our function.
To begin with, we will “pull out” the x, y, z values from the array. There is a slight subtlety. Since there is a space in the name of the sensor (“LSM6DSO Accelerometer”), an error will occur when trying to access it in the code. Therefore, it must always be quoted, for example: msg.payload[“LSM6DSO Accelerometer”]:
var accelerometer = msg.payload["LSM6DSO Accelerometer"];
var x = accelerometer.values[0];
var y = accelerometer.values[1];
var z = accelerometer.values[2];
Now I will use the ready-made code to calculate the side of the cube from the accelerometer readings. I did not come up with this code myself, but took it ready from video instructions on YouTube on how to make a “smart dice” from the Playful Technology channel. This code is very clear and understandable.
var accelerometer = msg.payload["LSM6DSO Accelerometer"];
var x = accelerometer.values[0];
var y = accelerometer.values[1];
var z = accelerometer.values[2];

var side=0;

if (Math.abs(x) > Math.abs(y) && Math.abs(x) > Math.abs(z)) {
    if (x > 0) {side = 0}
    else side = 1;
}

if (Math.abs(y) > Math.abs(x) && Math.abs(y) > Math.abs(z)) {
    if (y > 0) { side = 2 }
    else side = 3;
}

if (Math.abs(z) > Math.abs(x) && Math.abs(z) > Math.abs(y)) {
    if (z > 0) { side = 4 }
    else side = 5;
}

msg.payload = side;
return msg;
Running the code, we see that the face on which the cube stands will be printed to the console.
Now let’s make this program cyclic. Let it interrogate the smartphone in a cycle and display a message with the face of the cube, only if the face has changed.

I added a prev_side global variable and now I print the face of the cube and update the global variable only if the face has changed.
In Node-RED, you can display debugging information next to the node, for example, with this line:
node.status({fill:"red",shape:"dot",text:"red"})As a result, a red circle will be displayed along with the text, and this can be used as a visual indication.
In order not to overflow the debug console with text, I advise you to display the edge along the flow, next to the node where the edge is calculated.
Connect time tracker Toggl
The last step remains: let’s make a time tracking cube. For example, we want to track how much time per day we spend on reading, household chores, and playing sports. Let’s draw or write the names of these activities on the faces of the cube. We will rotate the cube every time we change the activity. Such a device is very useful for chronic procrastinators. By observing yourself with the help of this cube, you will understand where your main time goes.
How to account for the time spent on tasks? For this, there are ready-made solutions. I decided to use the free web service togglit already has the functions I need: setting and resetting the timer, assigning labels to timers, displaying statistics.

I will connect this service with Node-RED so that setting and resetting timers in Toggl is not done by pressing a button on the website or in the mobile application, but occurs as a reaction to the signal that the cube is turned over to the other side.
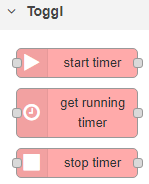
Node-RED has the node-red-contrib-toggl package, install it via Manage Palette. After installation, you will have new nodes in your environment.
In the parameters of the start timer node, you will see that you need to add a configuration file.
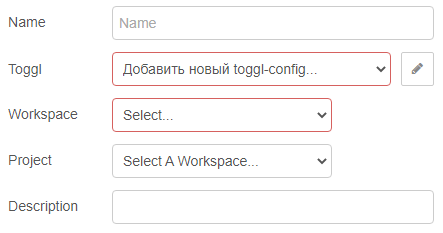
By clicking on the “pencil”, you will see that it is proposed to add a new API key.
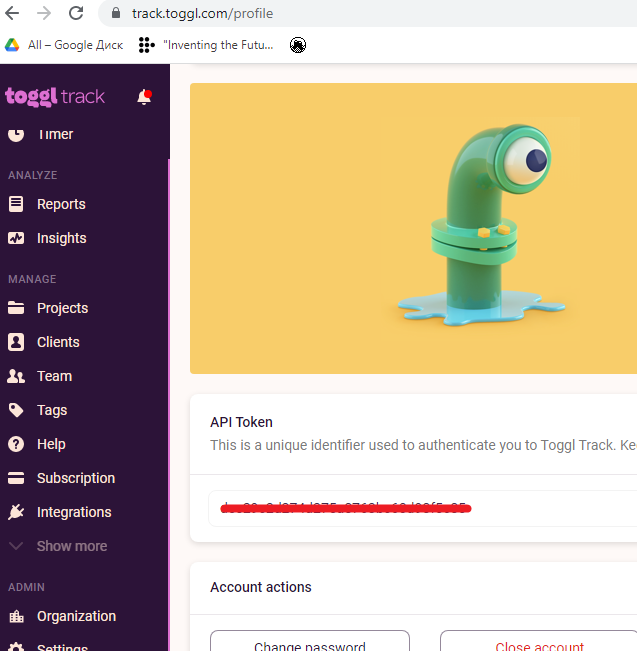
Where to get it: I go to the site toggl, I’m interested in the Toggl Track product. Registration is free. In my profile settings, I can see the API key, with which it is very easy to set up integration with a third-party service.
Write this API key in the settings of the Toggl node and then deploy the flow (ignore the error message) so that the Workspace selection appears in the Toggl node. Select your environment and the project that will run, for example “Reading”.
Everything is almost ready! Now it remains to implement the following logic: stop the existing timer, start a new timer. One face can be left without a timer – this will reset the cube (stop all running timers).
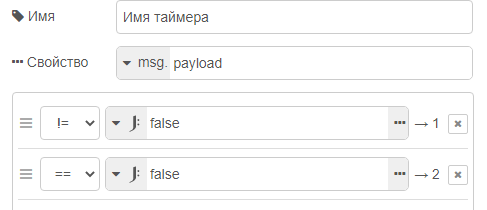
I put the node “Get running timer” and in the settings I check the box “send false if no running timer” so that an error message is not generated. In our case, the absence of a timer is not an error, but a completely regular situation. If the timer is running, then when changing the face of the cube, I reset it. Then I make a choice which new timer to start.
There is one not the easiest moment – this is when we add a conditional statement and see if the timer name is false. Here you need to compare exactly as an expression, and not as a string (by default).
Finally, let’s add feedback. You can add vibration so that the rotation of the cube is accompanied by feedback from the phone.
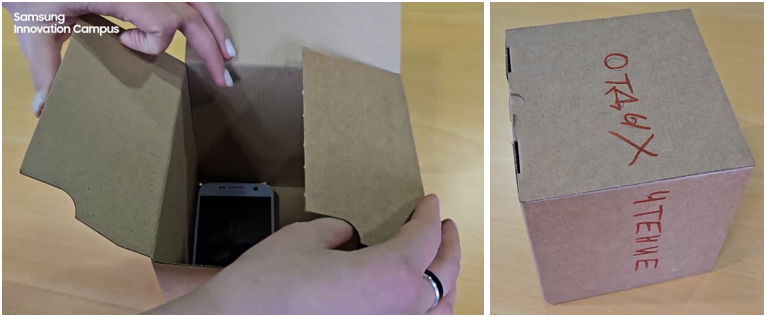
I made the case out of a cardboard box, wrote classes on the edges, glued the smartphone onto double-sided tape. This is suitable as the very first prototype. Then you can refine the cube further if you like the device.
You can download my code from this link: https://gist.github.com/tatyanavolkova/3b75d501fa0d67a62e2d4e1b11633abf
Conclusion
Here is such a cube of time I got, it will help you measure the costs of the most valuable and irreplaceable resource – time; planning your day will be easier.
It turns out that buying expensive single-board computers is not necessary if you want to test a hypothesis, test a simple code, or make an amateur project with a cyber-physical device. It turns out that for some of these tasks, a smartphone is enough. Now you can do very, very much, and our course Galaxy Upcycling will give you a lot of interesting ideas. Good luck!
Other articles in this series:

Tatyana Volkova
Leading Specialist of the Department for the Development of Technological Projects and Educational Programs at the Samsung Research Center in Russia