Predictive Analytics – everything you need to know (overview of key points)

Predictive Analytics – or in Russian, planned or predictive analytics, which is based on the answer to the question: “What can happen?”
Predictive Analytics – what is it and why does business need it?
What is this?
This type of analytics allows you to predict events in the future, for example, a sales forecast for 12 months or an analysis of the likelihood of a cash gap (whether it will happen in the near future, when exactly it can happen).
Simply put, planned analytics is a set of methods for collecting and subsequently analyzing data based on information about previously committed events. By studying the collected and analyzed indicators, the vector of future events is determined. Having an idea of what will happen in the future, you can navigate the search for optimal solutions to a particular situation.
It is worth considering that the result of a predictive analysis is not 100% accurate, that is, predicted events are provided with a certain degree of probability, and not in a format that will definitely happen.
Why business?
Let's look at a number of examples where a predictive analysis model is applicable and how it can help in business:
● manage risks in production, sales, finance…
For example,
in productionregarding downtime in product production, or possible breakdown of expensive equipment, through analysis of past events.
For example, when equipment maintenance and possible replacement of parts should be carried out to avoid failure of this equipment
in sales, when knowledge of the same seasonality or demand for certain goods, in the context of a temporary / weekly period, makes it possible to predict upcoming events in buyer behavior for the purchase of a product / service.
For example, knowing the seasonality and the corresponding demand for products, the retailer makes purchases in advance of the season in order to satisfy all the client’s needs on time
in finance, to build the most plausible financial model or more accurately calculate certain costs for specific needs in the future, based on market analysis of past years, having an idea of the dynamics of price growth, comparison with today's market indicators, taking into account indicators of previously made costs in the company for the same needs , or a simple example – the banking sector.
For example, when you need to understand that in front of you is a solvent client who needs to be issued a loan (having information about him through the analysis of his income – past and current (and their possible various sources), places of work (past and current), social networks (and means behavior, interests and possible expenses)) – it is possible to predict whether it is possible to issue a loan to a given client or not
● increase sales
For example, by constructing a model of buyer behavior based on a detailed analysis of past events (one product is in demand on an ongoing basis, which means that discounts may not be provided for it, while another product is in demand only on certain days, for example, alcoholic beverages on weekends, which means that discounts can be provided on a number of items during the week)
● ensure cybersecurity
● detect fraud optimize logistics
● improve procurement processes
● increase customer loyalty
● determine insurance payments
● assess demand / calculate supply
● determine the reasons for staff turnover
● identify risk factors for certain diseases
● …
The range of applications is very large and the list goes on and on. And there are a great many examples that can be given, and it would be better to do this in a separate article.
Hidden text
Thus, having forecast information, you always have an idea of what might happen tomorrow, which means you can promptly and effectively influence the course of events.
Application area
In view of the above, where the predictive model of data analysis is applicable, conditionally, can be divided into a number of main areas of activity.

As for which industries predictive analytics can be applied to, it will probably be easier to say in which it is NOT applicable.
Let's look at the most common ones.

The most active forecast analyzes are carried out in the following areas:
If we take the field of activity, then from the point of view of less demand we can single out marketing, since there are a lot of parameters, unknowns and variables that are influenced by many changing external factors that can change the course of events, which means that the likelihood of a forecast is significantly reduced. The costs are high, but the result is not what is expected, as a result of which it is worth carefully weighing whether it is worth spending resources on making forecasts or not?!
How does predictive analytics work?
Like any analytics, it requires data.
If we briefly consider the process of what predictive analytics consists of, there are 3 key stages:
Data collection
Exploratory analysis of collected data
Predictive Modeling
Data collection

What kind of data are we talking about?
For example, numbers, characteristics, the number of certain parameters, relationships between external and internal factors, time frames, user behavior, and so on.
What should you do before collecting information?
The first step is to determine all the values for which data will need to be collected in order to build a predictive model of future events.
How to collect data?
In order to predict something, a huge amount of data is required, which means it is virtually impossible to collect everything manually. To do this, you will need special software that will automate most of the processes of collecting and subsequent processing of information.
Exploratory analysis of collected data

Processing of the collected data, followed by withdrawal from the general pool of information, is possible using the following data systematization schemes:
linking one parameter to a specific group of similar indicators
determining the dependence of the result on the collected data
grouping objects according to specified parameters
identification of found patterns between events + determination of time frames – that is, the ability to get an answer – how long will the next event occur after the previous one
detection of a number of exceptions to the rules
After preliminary processing, due to their essentially systematization, the data can be interpreted.
Predictive Modeling

And so, having collected and processed the data, which is divided into classes, clusters, etc. — the stage of interpretation of the received information begins.
Before you interpret the data, ask yourself these questions:
What do you want to achieve as a result?
For what time period/until what time do you need a forecast?
For example,
When should equipment diagnostics be carried out?
profit calculation for 12 months
forecast of demand in winter for a particular product/service/line of activity
That is, set a specific task.
The following are the steps:
selection of statistical model
selection of indicators and parameters
studying and issuing prognostic data
The general diagram can be displayed as follows:
designation of goals and criteria
data collection
examination
treatment
selection of forecast algorithm
algorithm testing
monitoring
exploratory analysis
data interpretation stage
getting results
Predictive analytics in Russia today
Of course, the demand in Russia, in comparison with the world market, today is not so great, because, nevertheless, we do not have ready-made tools to work with large amounts of data. In view of this, for each, in fact, project, its own system is developed, which can only be based on ready-made tools. And this is long and expensive, as we all understand very well. We need resources.
However, large players (in the same Retail or Manufacturing) can no longer WITHOUT Predictive Analytics technology, since current realities dictate that it is easier to prevent something and find a solution than to then eliminate problems that have arisen that could have been avoided by drawing up forecasting events (elimination of problems can end up being tens of times more expensive).
For example, the purchase of goods in a larger volume than the demand for this product. The result is a loss of profit.
Downtime in an enterprise is a huge cost, while predictive analytics can reduce downtime by 30% (on average), which significantly reduces costs.
Or, let’s take healthcare, the structure of the ambulance service.
How to plan trips in such a way that specialists arrive on call as quickly as possible? Is this possible manually? Of course no.
There are a lot of different factors that influence the prognosis, BUT without them it is impossible to calculate even in advance how to ensure that help is provided promptly, because a person’s life and health are at stake.
Here, it is impossible to do without large-scale collection and analysis of data from past events, which need to be superimposed on current events, in order to resolve issues of readiness to provide truly EMERGENCY assistance.
This includes the presence of the required number of appropriate personnel (both for processing calls and for traveling on these calls), and the availability of vehicles in the required quantity (and their performance), which means the correct calculation of gasoline consumption and the need for technical inspection (this is all for calculating the same costs + time, so that there are always enough cars at these moments).
And we discussed only the key parameters, and there are many more.
In view of all of the above, predictive analytics is increasingly becoming part of almost every industry.
And in the near future it will most likely be everywhere.
Taking into account the interaction with AI, this is inevitable, because wherever long-term planning is required, the help of third-party resources is needed to analyze a huge flow of data, making forecasts for years to come, while there is a need to expand the same staff or increase other resources – no.
And yet, even in view of the rather rapid rise in popularity of the topic, due to its labor intensity, today not everyone, but only large-scale structures, can afford such a method of increasing the efficiency of an enterprise.
But this is only for now…
Our experience in implementing predictive analysis

The need for making forecasts is really growing, because it not only allows you to quickly respond to certain events, but do it with higher efficiency.
The more data is collected each year, the more accurate the required forecast will be.
Of course, before getting involved in predictive analytics software development, you want to get answers to key questions, right?
What economic effect will this implementation give me?
How much does implementation cost?
What are the implementation deadlines?
what is required of me?
What are the guarantees?
Before answering the first question, you need to understand whether the company has already built business processes. If not, then, unfortunately, the answer to the first question will be – at this stage, none, because always, to start work on making further forecasts of any events, a basis is required, and this is the data that needs to be collected. WITHOUT already built business processes, there can be no talk of any planned analytics if there is no basis for the collected data.
Briefly about the stages of work
Accordingly, we always start with an analysis of the client’s business processes and the business itself
We define the goals and criteria for data collection
Collecting statistical data
We display the form/model of the predictive (based on the previous steps)
We check the model and test it
Evaluating the solution
We are implementing
When will you get answers to your questions?
What economic effect will this implementation give me? — when we analyze your business and outline goals and criteria
How much does implementation cost? — at the stage of evaluating the solution
What are the implementation deadlines? — at the stage of evaluating the solution
what is required of me? — at the stage of starting the analysis of the business and your business processes
What are the guarantees? — at the stage of evaluating the solution
Our clients are usually agricultural production, woodworking, metalworking, industrial production, and electronics production.
Let's briefly consider an example of the implementation of Predictive Analytics in the livestock sector.
Input data
For example, pig farming.
In order for the animal to develop properly, it is necessary to strictly adhere to the norms of watering and feeding, depending on the age and weight of the animal.
In addition to feeding, it is worth considering when, for example, examinations of the animal are required, as well as an assessment of when the animal is ready for slaughter.
How can we constantly know the animal’s development indicators, for example, in order to correctly calculate the distribution of feed?
The answer is to measure and take into account the indicators daily, but you must remember that this is a labor-intensive process and stressful for the animal
! Stress can trigger weight loss.
OR Manually calculate the animal's growth rate
BUT…
In order for the indicators to be as reliable as possible, it is worth considering a number of factors:
A – climate and weather conditions and other external factors can affect the development of the animal
B – at different age periods, the growth of the animal varies
! The obtained indicators and growth curves are compared with the average development indicators of young animals, which makes it possible to determine growth patterns.
!! In order to derive average values, it is necessary to manually obtain weight data by age of the animal for different periods.
!!! DO NOT forget that in addition to weight growth, linear growth must also be taken into account.
However, you are still unlikely to be able to get reliable forecasts of future weights to plan feeding volumes in advance.
How to optimize the process of recording animal development indicators and feeding calculations?
Smart Pig is an automated system for recording those same indicators.
What is the essence of the system?
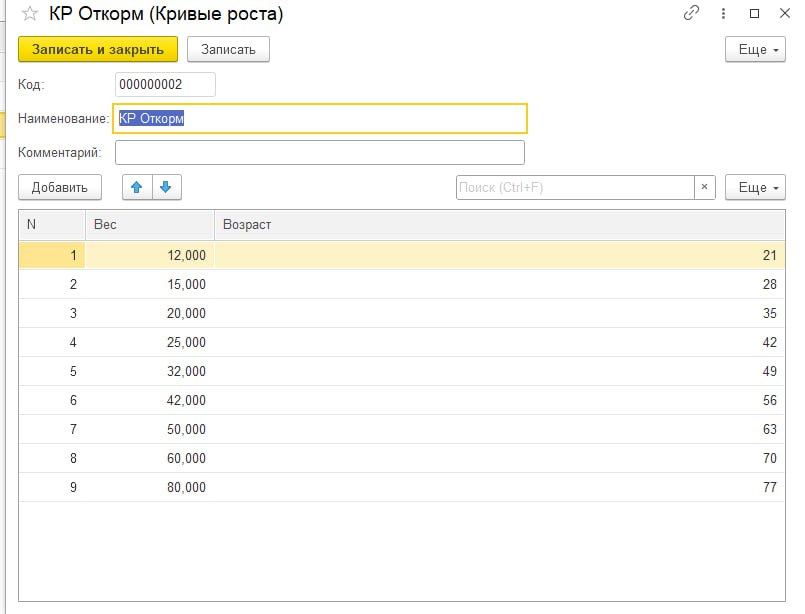
The main element of Predictive Analytics in the system we propose, in this case, is “growth curves”.
They compare the weight and age of animals (based on obtaining real data in the past, previously analyzed and interpreted).
Thanks to this data, the weight of the animal is predicted in the future at the nearest date.
Weight for more distant dates is calculated automatically based on growth curve data.
Thus, as a result, you receive a forecast about the weight of the animal on certain dates that interest you.
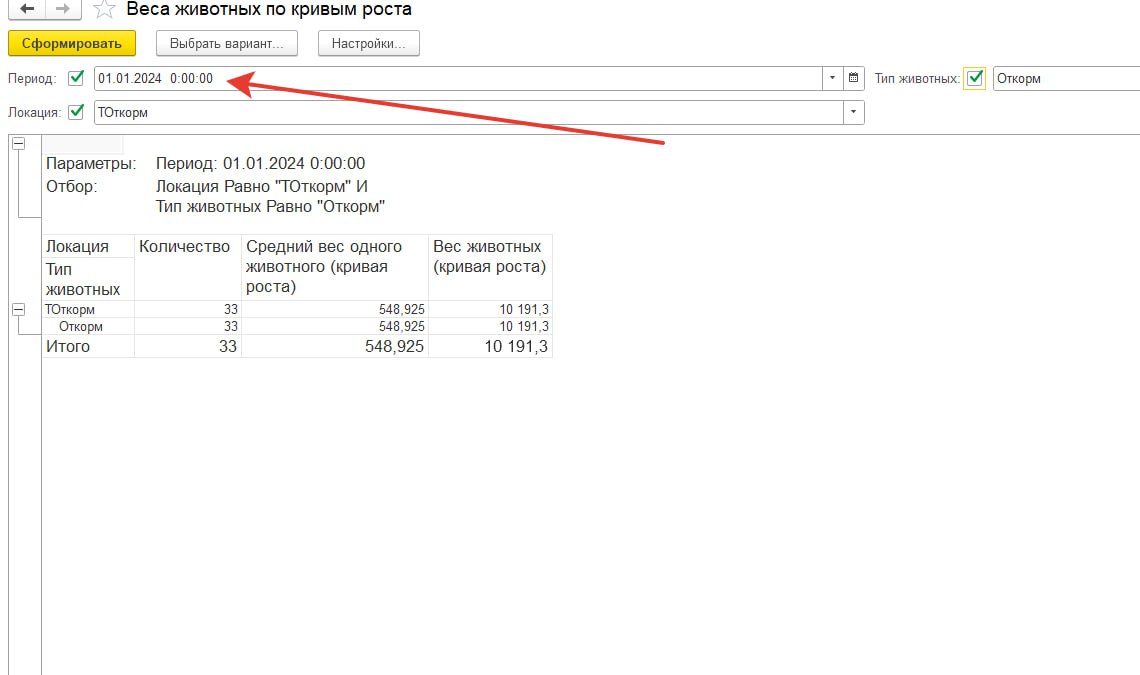
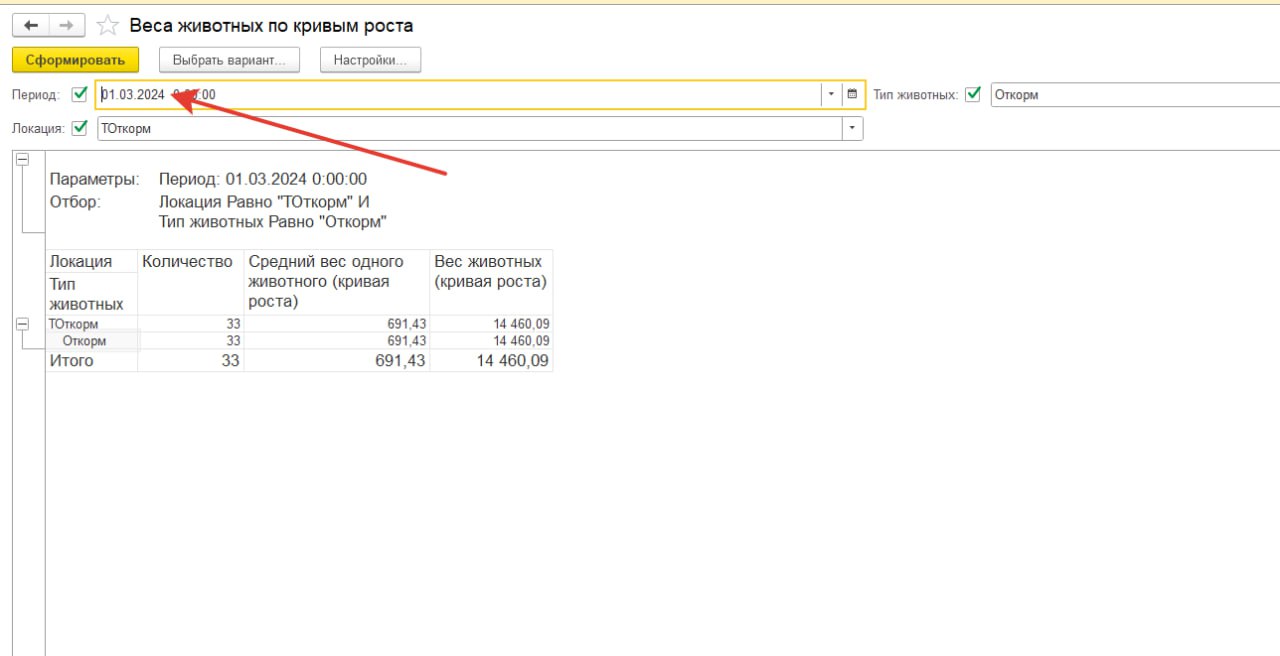
! Reporting can be provided in different versions (both tabular and graphical formats).
Who is this solution suitable for?
! The system is optimized for you.
Required to predict weight depending on the age of the animal
It is necessary to obtain the ability to standardize the yield of live body weight of individuals
Automated tracking of production efficiency is needed
If at least one of the points is yours? This solution will suit you.
So, let's summarize
If you decide, however, that you want to stay informed and not be reactive, but become as proactive as possible in order to be ready for any changes, as well as increasing the efficiency of your business at various levels, prepare for predictive analytics.
Key!
To build any forecast, the availability of data is required (that is, there must already be processes for which this data will be collected), i.e., the primary thing is the construction of processes. And only then:
– storage
– collection
– examination
– treatment
– check again
– analysis
– interpretation
The more detailed the forecast you need, the more data you should have (in terms of time period and variables)
What will you need?
Decide on business goals (answer the question – what do you want to get? exactly the final goal, and not what needs to be predicted)
Try to collect data that you already have (from all available sources)
Check all the collected data, whether everything is accurate and up to date
Analyze whether the data is generally collected correctly
Select a functional platform with forecasting tools to create a predictive analytics model
Check the implementation results for compliance with the metrics specified in the first step
! Checking for compliance will allow you to evaluate whether the implementation of predictive analytics will have the desired effect, the model of which will produce results under different scenarios, but in accordance with the specified parameters.