Parsing FIT files with training data

I became interested in analyzing my training data over the past few years, and I realized that the usual functionality of applications like Garmin Connect or the free version of Strava would not be enough. In this article, I’ll show you how to get your personal training data from Garmin devices and put it into a relational database using python libraries.
What is a FIT file and what can it contain
If you use wearable devices (fitness bracelets, watches, smartphones, bike computers) to record your activities or workouts, then most likely the information will be saved in FIT activity file is the most common format used by fitness apps to share detailed workout data.
For each individual activity, the file includes a set of required and optional messages. I figured out the mandatory ones: they include records of the date and time of the workout, its type of sport, lap data, GPS track, data from sensors (maybe a heart rate sensor, cadence / speed sensor, power meter, etc.). See the table below for details on the structure of each message.
Message Title | Description and content of the message |
File ID | Contains information about the manufacturer of the data collection device and the name of the device |
Activity | Includes date and time of activity, total time, number of sessions |
session | Generalized activity information (average and maximum speed, total time, total distance, total climb, type and sub-sport, average and maximum heart rate, and others) |
Lap | Displays summary information about laps or intervals within a single activity (lap number, total lap distance, maximum lap speed, and more). There can be multiple circles for one activity |
record | Contains data from all sensors at the time (coordinates, lap number, absolute height on the ground, date and time, heart rate, cadence, speed, power, air temperature, and others) |
How to access data
All personal training data collected using Garmin devices (in my case, several versions of watches and a bike computer) can be obtained upon request from official Garmin website. After the request, within 48 hours, a link to download the data package should be sent to your mail.
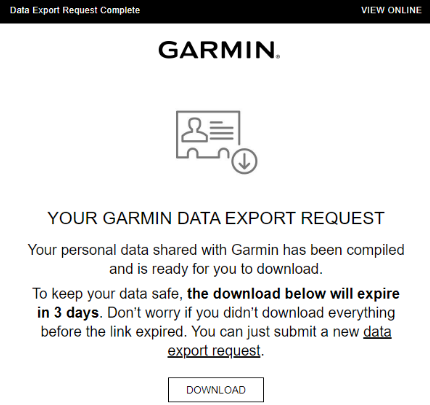
In the downloaded archive, the most valuable files in terms of activity data will be located in the folder DI_CONNECT\DI-Connect-Fitness-Uploaded-Files\UploadedFiles_0-_Part1. Each file contains information about one committed activity.
Data structure
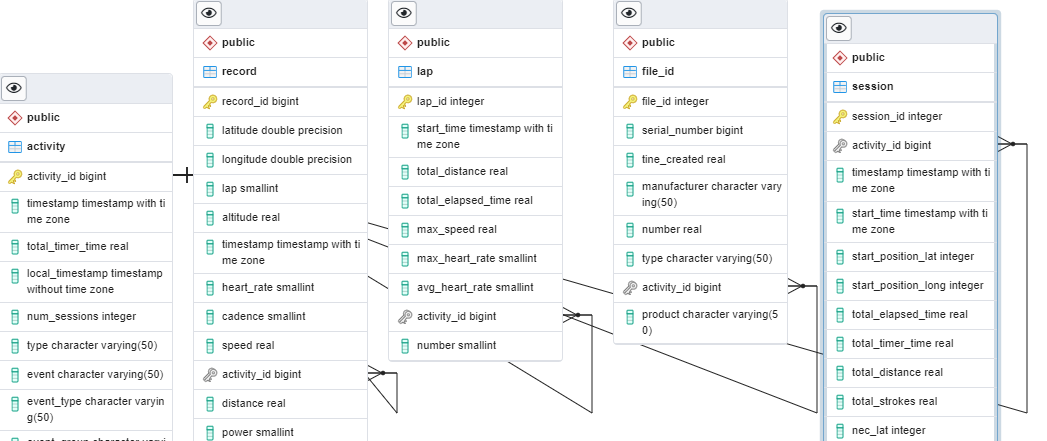
Based on PostgreSQL, I created five new tables that will match the messages from the FIT file – File Id, Activity, Session, Lap, Record. table Activity will contain the keyactivity_id) to each unique activity, all other tables will contain this key as foreign key. When parsing a file, the filling of tables will begin with the message Activity. The database schema generated in PostgreSQL ERD is shown below.
Code Description
To decode, read and load and validate activity data from FIT files into PostgreSQL tables, I used Jupiter Notebook and several python libraries, including os, pandas, psycopg2, fitdecode and matplotlib.
The code for each file from the above folder goes through the following steps:
Extract unique activity number and user ID from FIT file name
Reading, decoding and writing data to the dataframe for each of the five messages (File Id, Activity, Session, Lap, Record)
Loading dataframes into the appropriate PostgreSQL table
I prepared a data schema for each of the tables so that the code only looks for the data fields that I will need from each individual message. For example, from an Activity message, I need the following data:
activity = ['timestamp', 'total_timer_time', 'local_timestamp', 'num_sessions', 'type', 'event', 'event_type', 'event_group']Extract activity code and user ID
File names may vary in content, but always contain the user ID and activity number as the first two parameters, separated by the ‘_’ character. To retrieve these parameters, I used a simple function:
def get_user_activity_details(file):
    filename = os.path.basename(file)
    user_id, activity_id = filename.split('_')[0], filename.split('_')[1]
    if '.' in activity_id:
        activity_id = activity_id.split('.')[0]

    return user_id, activity_id
Reading, decoding and writing data to a dataframe
To parse the FIT file, a special fitdecode library was used. Here you can find the original documentation. Installing the library via PyPI:
pip install fitdecodeThe library allows you to create an object FitReader, which reads a FIT file and accesses every message (or frame) in that file. Each frame includes FitHeader, FitDefinitionMessage, FitDataMessage, FitCRC. We will only be interested FitDataMessage, since it contains activity data. IN this article described in more detail.
Example of extracting data from a message Activity in the dataframe below:
def get_fit_other_data(col, frame: fitdecode.records.FitDataMessage) -> Optional[Dict[str, Union[float, int, str, datetime]]]:

    data: Dict[str, Union[float, int, str, datetime]] = {}

    for field in col:
        if frame.has_field(field):
            data[field] = frame.get_value(field)
    return data


def get_dataframes(fname: str) -> Tuple[pd.DataFrame]:

    activity_data = []

    with fitdecode.FitReader(fname) as fit_file:
        for frame in fit_file:
            if isinstance(frame, fitdecode.records.FitDataMessage):
                if  frame.name == 'activity':
                    activity_data.append(get_fit_other_data(activity, frame))

     activity_df = pd.DataFrame(activity_data, columns = activity)
     df['activity_id'] = activity_id
    if activity_df.empty:
        activity_df = activity_df.append({'activity_id':activity_id}, ignore_index=True)

    return activity_df
Loading a dataframe into a database table
To connect and load data into PostgreSQL, I used the standard library psycopg2. Example of loading data from a dataframe Activity in the corresponding table below:
def load_dataframe_to_postgres(df, tabl):
    if not df.empty:
        df = df.fillna(0)
        cursor = conn.cursor()
        if tabl == 'activity':
            df = df.astype({'activity_id': 'int64','timestamp': 'datetime64[ns, UTC]', 'total_timer_time': 'float64', 'local_timestamp': 'datetime64[ns]', 'num_sessions': 'int64', 'type': 'object', 'event': 'object', 'event_type': 'object', 'event_group': 'object'})
            for index, row in df.iterrows():
                cursor.execute("""insert into activity(activity_id, timestamp, total_timer_time, local_timestamp, num_sessions, type, event, event_type, event_group)
                values (%s, %s, %s, %s, %s, %s, %s, %s, %s)""", [row.activity_id, row.timestamp, row.total_timer_time, row.local_timestamp, row.num_sessions, row.type, row.event, row.event_type, row.event_group])
        conn.commit()
        cursor.close()
Checking received data
To check the adequacy of the data obtained, I tried to visualize the number of minutes spent on the type of activity by month for the entire available period of time (from April 2014 to February 2022).
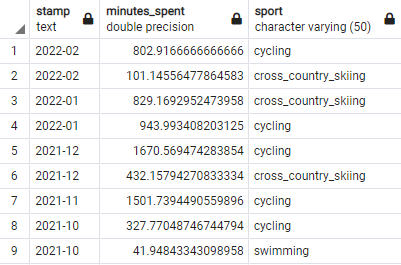
I had enough generalized data from the table session – I used fields with data on the date of activity, its duration and type (timestamp, total_timer_time, sport). The summary data is grouped by month and type of activity.
# get session data summary with sport split
conn = psycopg2.connect(host="localhost", database="garmin_data", user="postgres", password="afande")
df = pd.read_sql_query("""select to_char(timestamp, 'YYYY-MM') as stamp, sum(total_timer_time / 60) as minutes_spent, sport
                        from session
                        group by to_char(timestamp, 'YYYY-MM'), sport
                        having sum(total_timer_time / 60) > 0
                        order by to_char(timestamp, 'YYYY-MM') desc""", conn)
Additionally, a dataframe was created with all the months to display them on the chart even with a zero value (when there was not a single completed activity). For this, the earliest and latest months that are in the table were determined. After that, a range is created with a step per month and these months as boundary values.
# get min and max dates from the dataframe
min_date = datetime.strptime(min(df.stamp), '%Y-%m')
max_date = datetime.strptime(max(df.stamp), '%Y-%m')
n_max_date = max_date + pd.DateOffset(months=1)

# create a table with all months from min to max date
data = pd.DataFrame()
data['Dates'] = pd.date_range(start=min_date, end=n_max_date, freq='M')
data['Dates'] = data['Dates'].dt.strftime('%Y-%m')

# merge datasets
df_main = pd.merge(data, df, left_on='Dates', right_on='stamp', how='left', indicator=True)
df_main = df_main[['Dates', 'minutes_spent','sport']]
df_main = df_main.fillna(0)
A pivot table was used to build the graph stacked bar from the library matplotlib. An additional breakdown by years in the form of vertical dividing lines has been added to the chart.
# pivot table
df_pivot = pd.pivot_table(df_main, index='Dates', columns="sport", values="minutes_spent").reset_index()
df_pivot = df_pivot.fillna(0)
df_pivot = df_pivot[['Dates', 'cross_country_skiing', 'cycling', 'running', 'swimming', 'walking']]

# create stacked bar chart for monthly sports
df_pivot.plot(x='Dates', kind='bar', stacked=True, color=['r', 'y', 'g', 'b', 'k'])

# labels for x & y axis
plt.xlabel('Months', fontsize=20)
plt.ylabel('Minutes Spent', fontsize=20)
plt.legend(loc="upper left", fontsize=20)

for num in [69, 57, 45, 33, 21, 9]:
    plt.axvline(linewidth=2, x=num, linestyle=":", color="grey")

# title of plot
plt.title('Minutes spent by Sport', fontsize=20)
plt.rcParams['figure.figsize'] = [24, 10]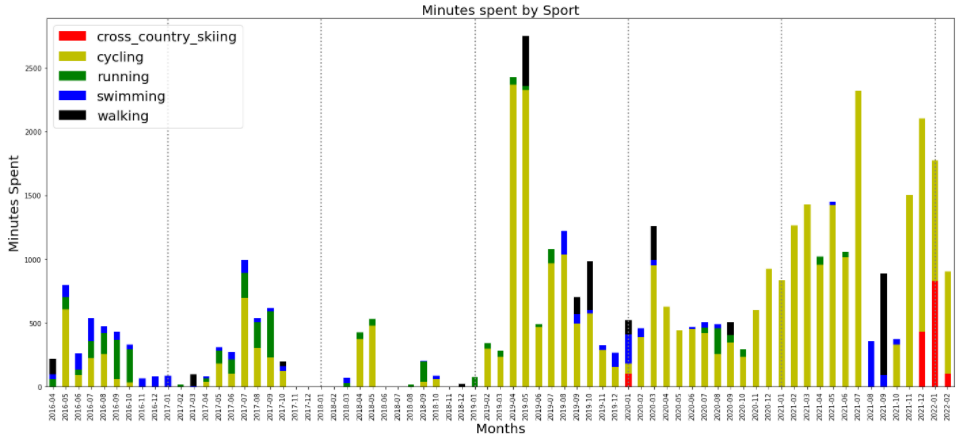
The resulting graph plausibly reflects the number of minutes spent on types of activities – for example, the maximum minutes on a bike in April-May 2019 corresponds to a bike tour in Scandinavia, the lack of cycling in August-September 2021 due to injury and their replacement with swimming and hiking classes, the advent of ski training from December 2021 corresponds to the running in of a new pair of skis.
Results
In total, I got access to 5,300 FIT files, among which only one turned out to be broken and did not give access to data. The complete code for loading data from all FIT file master messages into PostgreSQL DB tables can be found here.
This method allows you to access all historical data at the same time and conduct further analysis in a convenient environment.
It is worth noting that there is a way to get data through Activity APIit is more aimed at application developers who need constant access to up-to-date data.


