Monitoring in the data center: how we changed the old BMS to a new one. Part 3
New interface
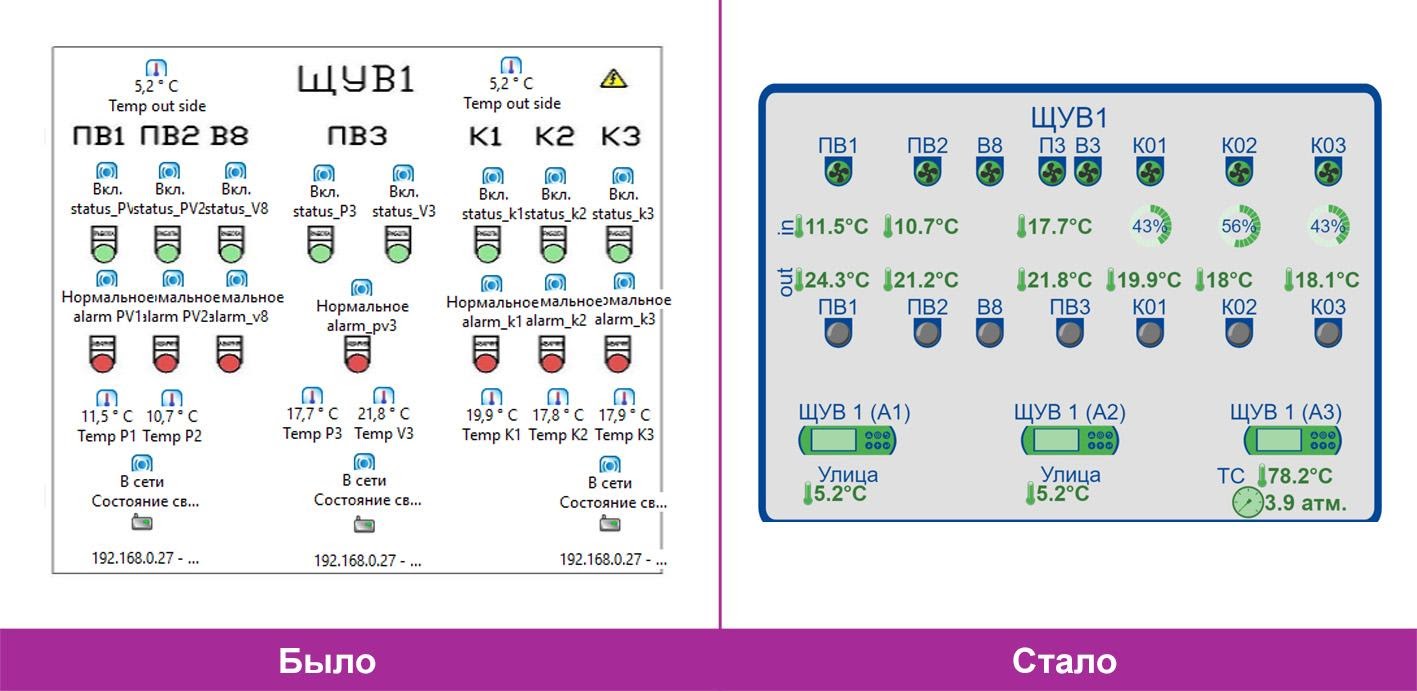
Here, as they say, it is better to see once.
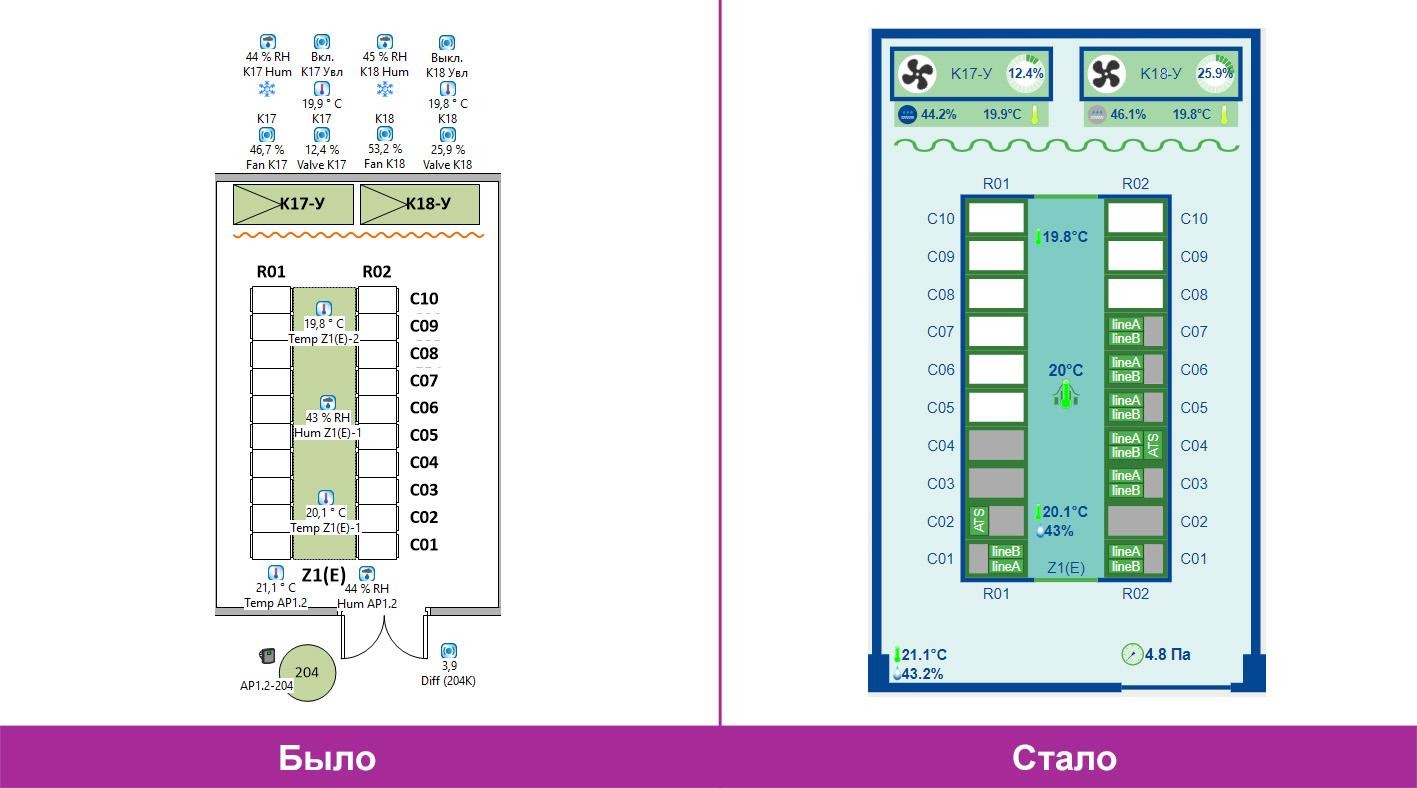
 Racks.
Let’s analyze the differences.
- The first is beautiful conveniently. Note how easy it has become to track the load on the modules (“Banks” or just “Banks”) of the PDU and the sum of the parallel loads of the paired modules. On the rack model from the new BMS, we immediately see that the lower paired PDUs are overloaded (the total current above the permissible 16A is a “blue” notification), and the upper ones are underloaded. If one of the inputs is disconnected, the entire load will transfer to the second, and the lower module remaining energized will be disconnected due to overload. In this case, the data center support service will send the client a recommendation on how to redistribute the load.
- Simple addition of equipment. In the new BMS, virtual sensors for the sum of module currents and rack power have already been added to the model rack templates and are created automatically after adding a PDU to the rack. In the old BMS, they had to be created manually and then dragged onto the map, which increased the likelihood of an error due to the “human factor”.
- Unlimited scope for creativity. Now we have no restrictions when creating virtual sensors. You can build absolutely any mathematical model of any variable. This means that we have the opportunity to create complex virtual sensors (previously you could only add up values) and better analyze the statistics and trends of engineering systems. This improves the quality of decisions made on tuning systems, replacing equipment, and managing resources.
- Intuitive interface. In the new interface there are no heaps of icons, fans spin, switches “click”. And the most convenient is the ability to indicate the status of the PDU Line A / B inside the racks. We tried to do something similar in the old BMS, but the number of merging icons per square centimeter of the card forced us to abandon it.
Now the eye is pleased to watch:
Server
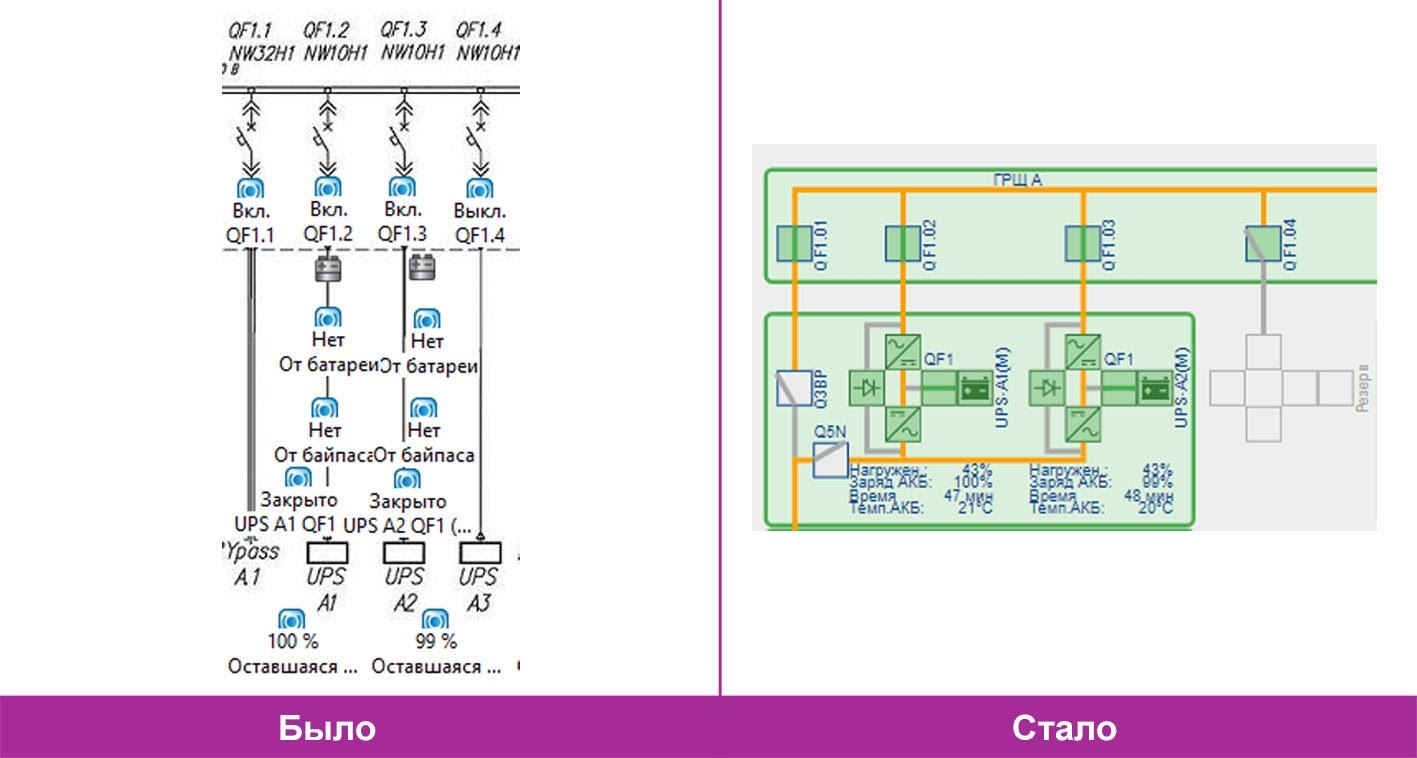
Fragment of main switchboard.
Ventilation control panel.
And you can decorate the new BMS for the New Year 🙂
One page – Understanding and Without TK
For a very long time we wanted to implement another “trick” in BMS: to compose on one page the main parameters of the data center, so that one glance at the screen would be enough to assess the status of the main systems. However, we did not fully understand how it should look.
Even before the development of the new BMS began, we visited dozens of data centers in the Netherlands with excursions. One of the goals was to see examples of the implementation of such a page.
And they weren’t shown to us in any data center – somewhere it wasn’t, somewhere “it was being developed right now”, somewhere it was a “big trade secret”. Therefore, in our ToR for the creation of a new BMS, an exact description of this page, which is very important for us, was missing.
As a result, we came up with it literally “on the go.” Just at that moment, I had to remotely consult colleagues in the data center. It was very inconvenient to leaf through the BMS pages in the phone in search of disparate data, and in fact the first version was scribbled on a napkin One page. It was implemented by the developers of the photo.
Following the example of cautious Dutch colleagues, we will not demonstrate the final version of our main page, especially since each data center is unique and it makes no sense to copy. But we describe two main principles of its formation:
- This is a table designed for the format of a vertically located smartphone screen (or monitor, but with the vertical arrangement), with the output of all important information on one screen. Above the table is a summary of active incidents, so placing them together most conveniently turned out to be in a vertical format.
- The location of the cells in the table follows the architecture of the data center (physical or logical). We refused to arrange the systems in alphabetical order, as we would like at first glance. The sequence reflects the visual associations of the data center personnel – as if they physically monitor all rooms and systems. This makes finding information easier.
In fact, now absolutely all the key characteristics of the data center are grouped and presented on the same screen of the smartphone / monitor by the responsible engineer and manager, while the connection to the physical and logical topography of the data center is implemented.
Here is a photo of the very first draft, although, of course, then this version was rethought and finalized.

Acknowledgment and summary of incidents
Let’s talk about another new concept for us, which appeared as a result of the project to update the monitoring system.
Acknowledgment is a rather rare term that the developer of the new BMS proposed to use. It means confirmation that the operator saw the incident, confirmed it and assumed the responsibility for eliminating it.
The word has taken root, and now we “acknowledge” the incidents.
The algorithm laid down in the basic version of the new BMS did not suit us. In fact, these were comments on the event log, that is, the resolved incidents did not disappear from the journal, and the received (“acknowledged”) messages were not sorted from new ones.
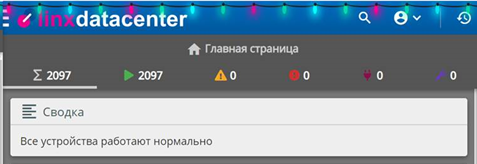
As a result, a window was developed under the name “summary”, in which:
- Only active incidents and devices are displayed in service mode (without commercial “blue” notifications).
- The NEW and ACCEPTED incidents are clearly separated.
- It is indicated who accepted the incident.
The duty algorithm in the new BMS is as follows:
- New incidents are reported and await acknowledgment. They cannot be in this section for a long time, the equipment officer on duty should immediately take the incident upon himself.
- The employee accepts the incident by clicking on the checkmark on the right. Since all employees are under unique accounts, it automatically displays who accepted the incident. If necessary, leave a comment.
- The incident moves to the “Acknowledged” section, the rest of the attendants and the manager understand that the responsible officer is involved in the incident.
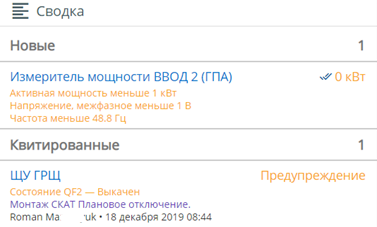
An example of a summary window with a new and already acknowledged message.
By combining the summary window with the One page table, we get a full main screen BMS systems, on which you can immediately see:
- the state of the main data center systems;
- the presence of new unprocessed incidents;
- the presence of accepted incidents and data on who specifically eliminates them.
Access via browser and pop-up alerts on the phone
The web interface, accessible from any device from anywhere in the world, is a stark contrast to the “fat” client, completely closed to outside users.
The old approach dragged on a set of inconveniences, from problems in organizing the remote work of monitoring service employees to the need to install “thick” clients from distributions to staff jobs in the data center.
Now any page in BMS has a unique address, which allows you to share not only the direct address of the page or device, but also links to unique graphs / reports.
Access to the system is now provided through LDAP authentication through Active Directory, which enhances its level of security.
Mobility today is a key factor in the quality work of duty engineers. In addition to monitoring monitoring in the duty shift room, engineers make detours, perform routine work outside the “duty room” and, thanks to the BMS main screen optimized for the mobile screen, do not lose control of what is happening in the rooms for a second.
The quality of control is enhanced by the functionality of work chats. They accelerate workflows, allowing you to “link” the correspondence of duty engineers to BMS. For example, we use the Teams application, which allows you to conduct internal correspondence and receive all messages from BMS on the phone in the form of pop-up Push notifications, which eliminates the duty of the duty officer from constantly looking at the phone screen.

Push notification on smartphone screen.

And so the notifications look in the Teams application.
At the same time, pop-up notifications are configured only for messages about incidents, thereby minimizing the distraction, staff know that if Teams Push-notification appears on the smartphone’s screen, you need to go to the BMS page and accept the incident. Corrective action messages are already tracked on the BMS page.
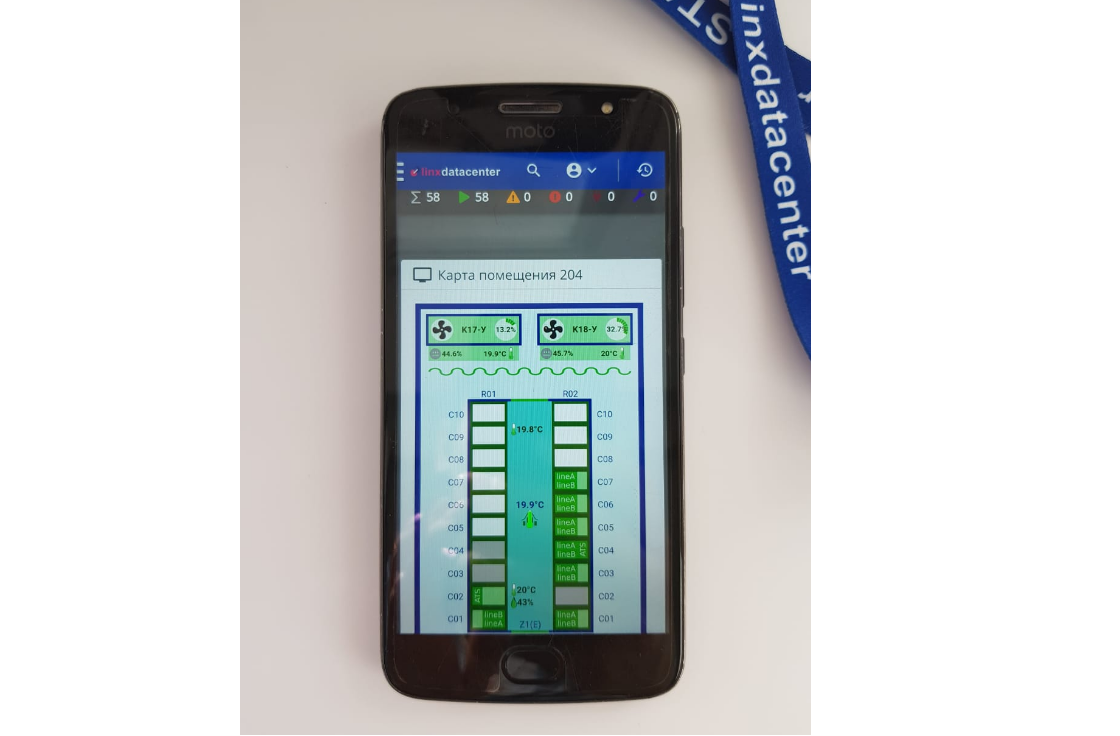
In the photo, the BMS interface in the smartphone.
Summarizing
With the cost of updating BMS from our old vendor, comparable to developing a new system from scratch (about $ 100,000), the difference in the functionality of the products turned out to be enormous. We received a flexible system optimized for our business tasks and processes. We also achieved significant savings in running costs for maintaining and updating the system.
But, of course, there were difficulties.
- Firstly, we underestimated the amount of changes that were required to be made in the basic version of the new BMS, and did not meet the agreed deadlines. This was not a critical problem for us, since we insured and worked on the old system until the very end, and the process was creative, complex and therefore it sometimes went slower than expected. In addition, we have always seen that our developer makes every effort to achieve the best result. But in fact, the story turned out to be very long, and our key specialists spent much more time and effort on it than we planned.
- Secondly, it took us several stages of testing to debug the backup algorithm of virtual machines and communication channels. Initially, the failures were on the side of the BMS system, and on the side of configuring virtual machines and the network. This debugging also took some time. Fortunately, the contractor was provided with a test site in the form of a cloud service, where all settings and innovations were initially tested.
- Third, the resulting system was more difficult to edit by the end user. If the map used to be a substrate (graphic file) and icons, which were easy to change or move, now it is a complex graphic interface with animation that requires certain editing skills.
The radical update of our BMS system today can be called the most important project of the past year, which will seriously affect the quality of operational management of our sites in the future.
Of course, we did not throw out the old iron server, but “made it easier”: we cleaned thousands of “commercial” virtual sensors and PDUs and left only a few dozen of the most critical devices in it, such as diesel generator sets, UPSs, air conditioners, pumps, leakage sensors, and temperatures. In this mode, it returned to its former speed, and it can be a “reserve reserve.” By the way, after removing the PDU from the old BMS, about 1000 now unnecessary licenses have been freed, do you happen to know what to do with them?