Jmix 2.2 released
We have released a new version of Jmix 2.2.
We remind you that Jmix is an open source platform for the rapid development of B2B web applications in Java. It is built on the technological core of Spring Boot, includes tools for productive development of full-stack applications based on IntelliJ IDEA Community Edition, a visual BPMN modeler and ready-made plug-ins. The platform helps in the development of both standard CRUD applications and large-scale corporate information systems. You can get to know Jmix better on the website https://www.jmix.ru.
What's new in version 2.2?
The most important thing is that Jmix Studio has become free for small projects. If the number of entities and roles in the project does not exceed 10, there is no large data model and high security requirements, then the premium RAD functions of the platform can be used for free. Explore, experiment, create pet projects or even small-scale commercial applications!
Full details of the changes are available on the documentation page What's new.
This article provides an overview of the main features of the new version.
Charts Add-on
Perhaps the most notable new functionality in Jmix 2.2 is the long-awaited addition of Charts. It integrates Apache ECharts, an open source JavaScript charting library in Jmix UI. Now you can harness the power of ECharts by customizing them via XML or Java in your Jmix application, and easily connect your charts to server-side data, just like other UI components.
For example, for an entity VehicleCountwhich stores the number of different vehicles by year in attributes cars, motorcycles, bicycles And yearyou can set up a chart to visualize your data like this:
<data>
    <collection id="vehiclesDc"
                class="com.company.demo.entity.VehicleCount">
        <fetchPlan extends="_local"/>
        <loader id="vehiclesDl" readOnly="true">
            <query>
                <![CDATA[select e from VehicleCount e order by e.year]]>
            </query>
        </loader>
    </collection>
</data>
<layout>
	<charts:chart id="chart">
	    <charts:dataSet>
	        <charts:source dataContainer="vehiclesDc"
	                       categoryField="year"
	                       valueFields="cars motorcycles bicycles"/>
	    </charts:dataSet>
	    <charts:series>
	        <charts:bar name="Cars"/>
	        <charts:bar name="Motorcycles" stack="stack"/>
	        <charts:bar name="Bicycles" stack="stack"/>
	    </charts:series>
	    <charts:xAxes>
	        <charts:xAxis/>
	    </charts:xAxes>
	    <charts:yAxes>
	        <charts:yAxis>
	            <charts:axisLabel formatter="{value}"/>
	        </charts:yAxis>
	    </charts:yAxes>
		<charts:title text="Vehicles" subtext="By Year"/>
		<charts:legend/>
	</charts:chart>
As you can see, the chart is connected to the data container using the element source and defines how to display data in the element series. The resulting diagram is shown below:
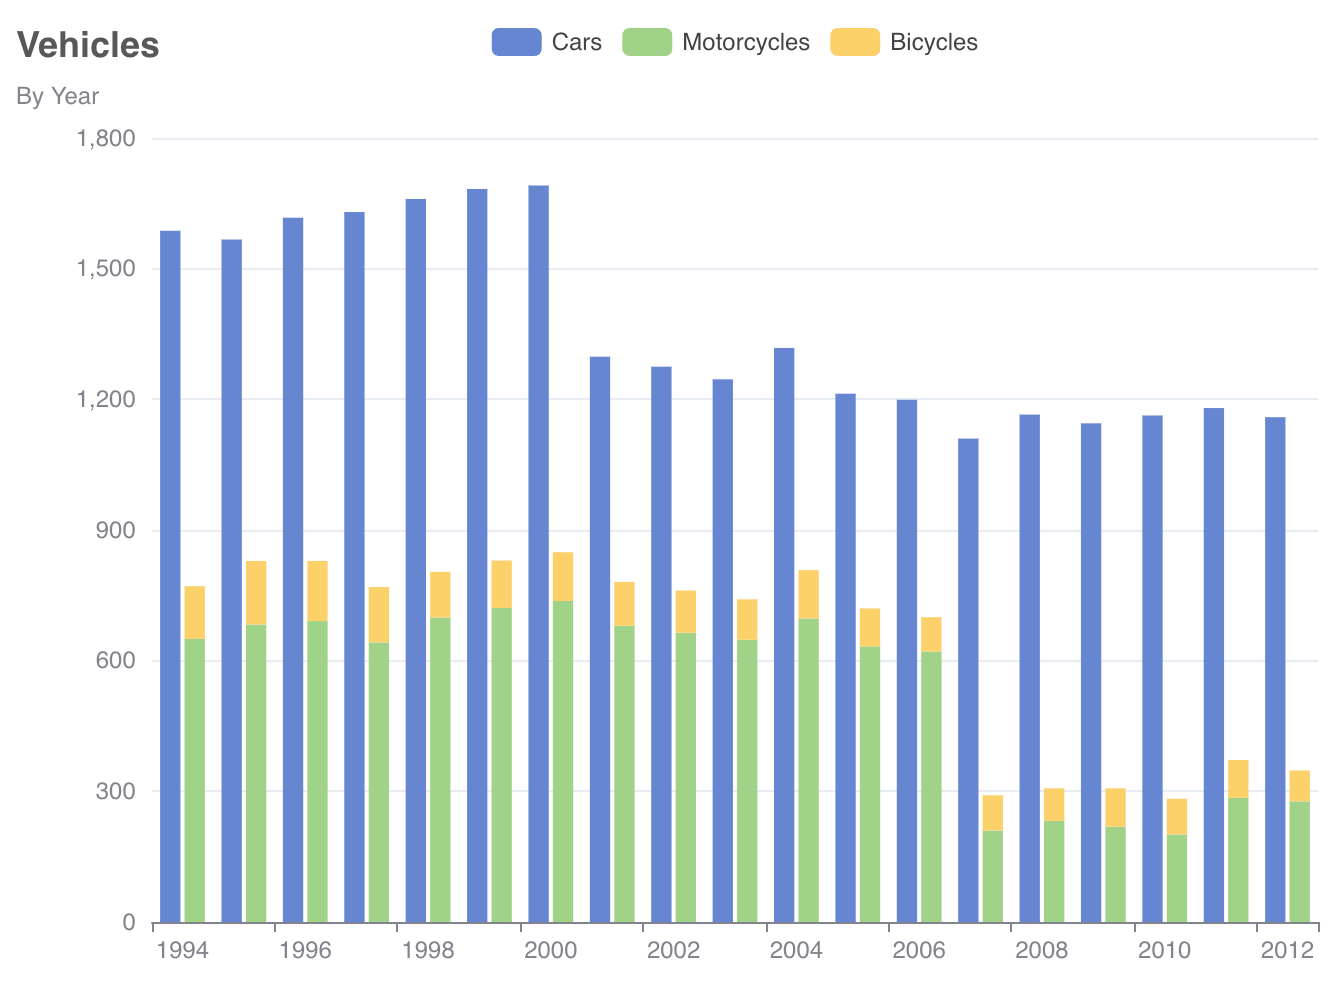
We tried to make the XML and Java API of charts as close as possible to the native JavaScript API of the ECharts library, which makes it easy to customize a chart in Jmix by referring to the comprehensive ECharts documentation.
The Charts add-on is freely available at Marketplace and can be used in any project based on Jmix 2.2.
Improvements to the Maps add-on
The Maps add-on has received new important features: the ability to display MultiPoint, MultiLine and MultiPolygon, a heat map layer and clustering.
A MultiPolygon is simply a collection of polygons in the same geometry. In the example below we create a MultiPolygon consisting of two rectangles:
It will be shown on the map as follows:

The clustering function allows you to display a large number of markers on the map by combining them. In the following example, the map shows the most famous cities founded by the Romans:

This is achieved by simply wrapping the vector data source in an element cluster in screen XML:
<maps:geoMap>
    <maps:layers>
        <maps:tile>
            <maps:osmSource/>
        </maps:tile>
        <maps:vector id="cityLayer">
            <maps:cluster distance="30">
                <maps:dataVectorSource dataContainer="citiesDc" property="point"/>
            </maps:cluster>
        </maps:vector>
    </maps:layers>
    <maps:mapView centerY="41.9" centerX="12.48" zoom="4.5"/>
</maps:geoMap>
The same data can be visualized as a heat map, where values are represented by color:

The heat map is configured with a special layer heatmap with its own data source connected to the same data container:
<maps:geoMap>
    <maps:layers>
        <maps:tile>
            <maps:osmSource/>
        </maps:tile>
        <maps:heatmap radius="15">
            <maps:heatmapDataVectorSource dataContainer="citiesDc" property="point"/>
        </maps:heatmap>
    </maps:layers>
    <maps:mapView centerY="41.9" centerX="12.48" zoom="4.5"/>
</maps:geoMap>
BPM improvements
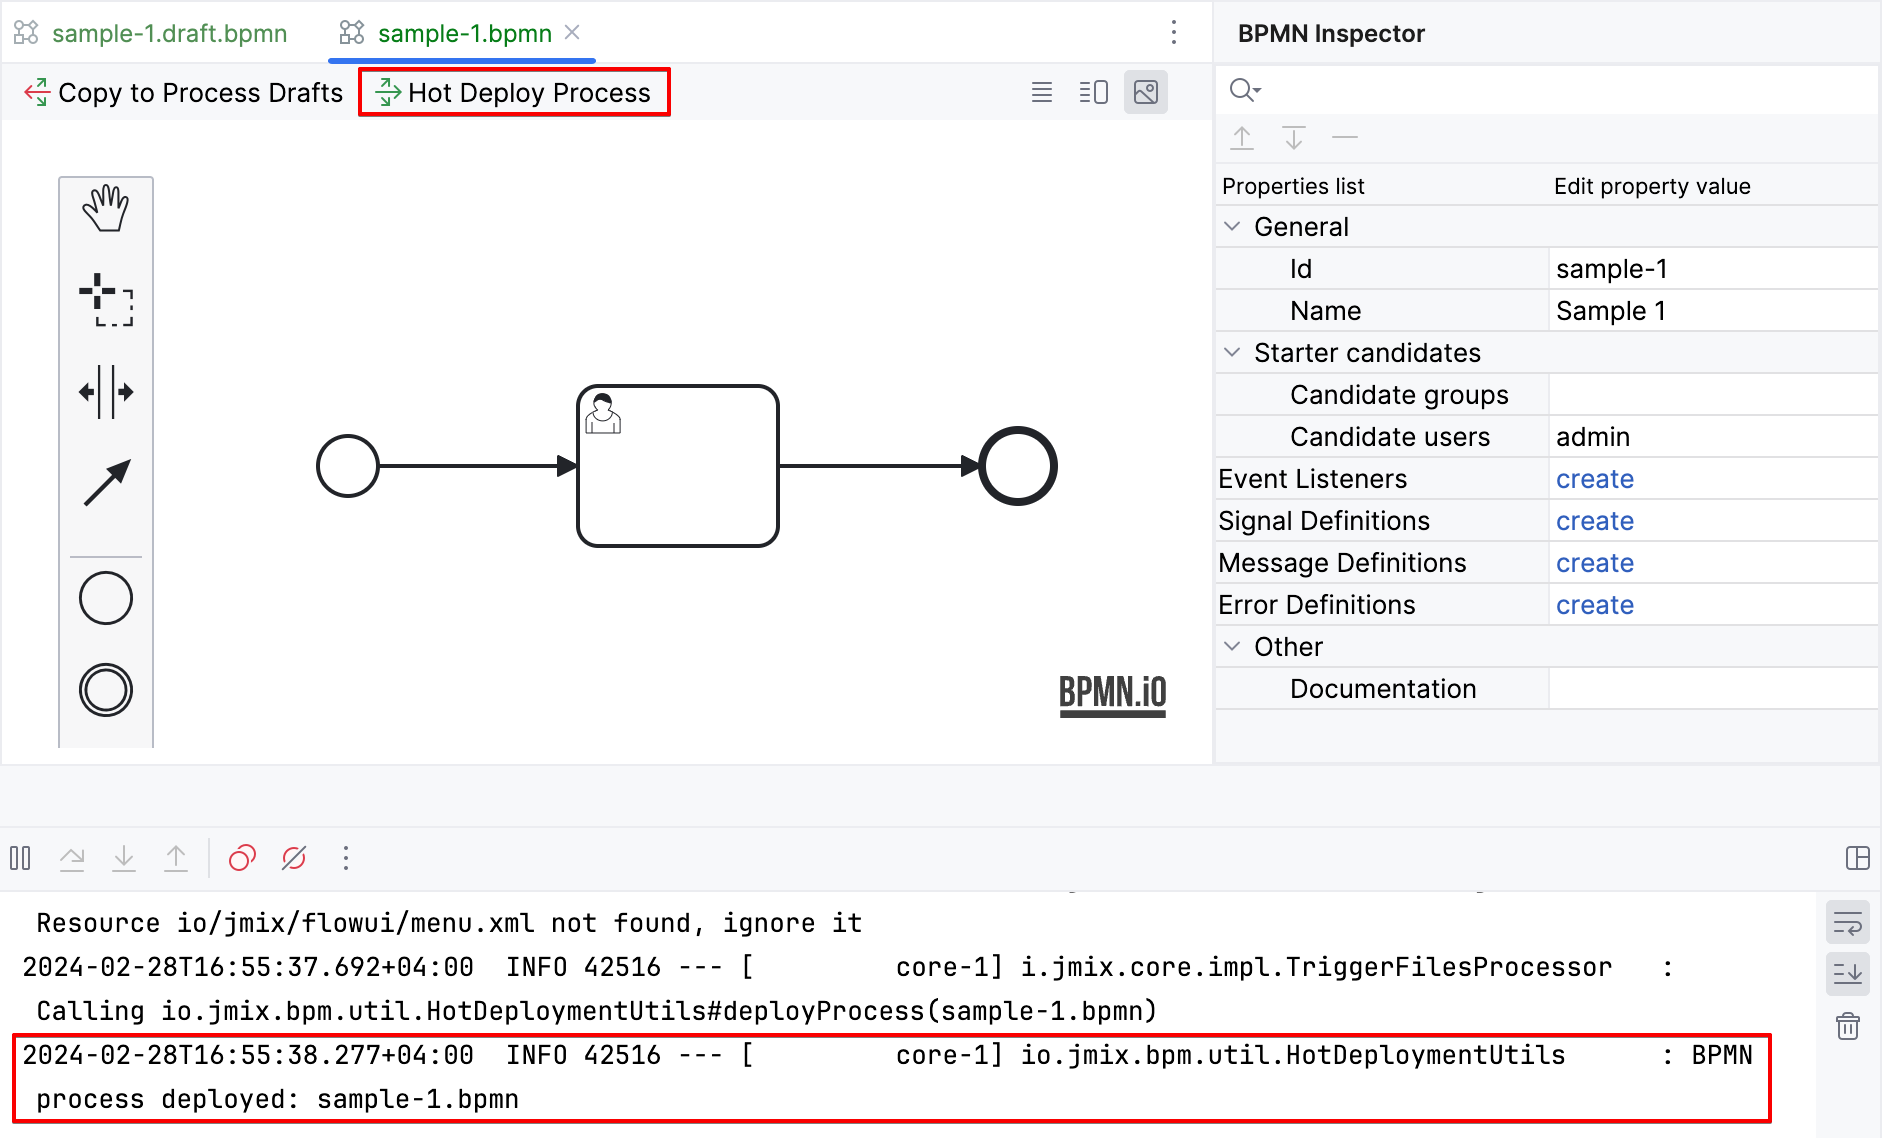
To shorten the feedback loop when developing processes in Studio, we've implemented hot deployment of process definitions into the running application. You can see the button Hot Deploy Process in the top panel of the BPMN designer. The application prints a message to the log when the process is successfully deployed:
The Process Form Wizard in Studio can now generate a form for the start event. This form will contain a button Start processwhich calls the process engine API.
This wizard also contains a new item Process form for entity instance in the dropdown list Form template. If you select this option, the wizard will allow you to select or create a variable of type Entity. The result will be a process form containing a data container and a field for editing the selected entity.
RichTextEditor Component
New component richTextEditorbased on a JavaScript library Quillallows you to edit text with formatting and save it as HTML:

The component supports working with data and can be easily connected to your data model:
<richTextEditor id="descriptionField" width="100%"
                dataContainer="stepDc" property="description"/>
Home screen improvements
New component menuFilterField Allows users to filter main menu items.
All you need to do is place the filter field on the screen and connect it to listMenu:
<menuFilterField menu="menu"
                 placeholder="Search..." classNames="ms-s me-s"/>
<nav id="navigation" classNames="jmix-main-view-navigation" ariaLabel="msg://navigation.ariaLabel">
    <listMenu id="menu"/>
</nav>
Menu filtering in action:

The next Home screen improvement is the ability to declaratively define content when there are no child screens open. Use the element for this initialLayout component appLayout:
<appLayout>
    <navigationBar .../>
    <drawerLayout .../>
    <initialLayout>
        <h2 text="Hello world!"/>
    </initialLayout>
</appLayout>
Then the application will look like this:

And probably the most anticipated improvement in this area is the horizontal main menu:

It is implemented using the component horizontalMenuwhich gets the menu structure from the same handle menu.xml. So you can easily replace the standard vertical listMenu to the top horizontal menu at any time in your project. The easiest way to do this is to click New → View and select a template Main view with top menu. If you select the checkbox Use as default main view in the second step of the wizard, Studio will set the new main screen to the application property jmix.ui.main-view-id and into the attribute layout annotations @Route for all existing screens, for example:
@Route(value = "users", layout = MainViewTopMenu.class)As a result, the new main screen with a horizontal menu will work immediately after launching the application.
DataGrid improvements
Double-clicking a data table row now opens the details screen or, when searching through the list screen, completes the selection. This will be very convenient for desktop users because you no longer have to first select a row and then click a button or menu item.
We've also finalized the filter on the column headers so that it can now be reflected in the URL to create a deep link and save screen state when navigating to and from the detail view. Use a new element for this dataGridFilter facet urlQueryParameters.
Another useful feature is the new component gridColumnVisibilitywhich allows users to hide and show table columns:

Collection properties in a universal filter
Previously, to filter an entity by its collection attribute using the component genericFilterit was necessary to define a JPQL condition with join And where-expressions. Obviously, this was something difficult to achieve for the end user.
Filtering for “to-many” links and their nested attributes is now as easy as for “to-one” links: they are displayed in the dialog Add condition general filter, and the necessary JPQL conditions are generated automatically by the framework.
The following example filters a list of users by attribute completedDate linked collection steps:


Reduced assembly time
While hot deploy technology provides an opportunity to shorten the feedback loop in UI development, it does not apply to business logic development. Therefore, quickly restarting the application remains important.
In Jmix 2.2, the entity bytecode modification step (enhancing), which takes a significant amount of time during the build, is performed only if the data model has changed since the last build. Therefore, if you work on Spring beans without modifying entities, the build and restart process is now significantly faster, especially in projects with large data models.
New code snippets
If your project includes the Reports, Email sending, BPM, or Notifications add-ons, you can take advantage of the new snippets associated with the APIs of these add-ons.
For example, if you need to run a report when the user clicks a button, you can generate a button click listener method and then drag the snippet Run report using UiReportRunner into the listener code. Studio will prompt you to specify the report you want to run and generate the appropriate code:

The generated code will work immediately and can be a starting point for further customization.
Adding Components Using Wizards
As the collection of UI components expands, it becomes increasingly difficult for beginners to find the right component for a specific task.
Therefore, we decided to provide additional, even more declarative way to create screens. Instead of selecting a component from the palette Add Component the developer can run a wizard that prompts a series of questions. The wizard then generates an entire fragment containing preconfigured data components and visual components.
In fact, Studio already included such wizards for DataGrids and data containers, but these wizards were launched only when the corresponding component was explicitly selected from the palette. Now the developer may not be aware of the existence of a particular component and simply select a wizard that, judging by its name, corresponds to the task.
In the next video the master Edit entity attributes creates formLayout with fields connected to the data container:

This feature is currently experimental and we plan to expand it in the future by adding more wizards and making them more useful in different use cases.
Test generation
When you open a project in a new Studio, you will see a new item Tests in the Jmix tool window. Double clicking on this element will take you to the tool window Project to the catalog src/test/java.
Actions New → Advanced → Integration Test And UI Integration Test allow you to quickly create templates for business logic tests and UI integration tests.
Free Studio for small projects
Last but not least, Studio's premium RAD features are now available for free for small projects with up to 10 entities and roles. This means you get access to all of Studio's visual tools to explore, experiment with, and create your own projects or commercial applications without the need for an active commercial or trial subscription. The only limitation is that these projects should not contain a large data and security model.
We expect that free tools will make it easier for developers to learn and adopt the technology, thereby making Jmix accessible to a wider audience.
Conclusion
In the next feature release in June 2024, we plan to implement integration with Apache Supersetthe leading open source data visualization platform.
On the Studio side we are going to provide an approach to aggregating Liquibase changelogs and actions to quickly transform similar UI components such as entityPicker And entityComboBox.
As always, we're going to spend significant time fixing bugs, adding small features, and improving performance.
Our detailed roadmap for future versions is available as project on GitHub. Patches for the current version 2.2 will be released approximately once a month.
We will be glad to see your feedback on our forum!
Thanks to everyone who sent us PRs, shared their ideas, suggestions and bug reports!