how we analyze the reasons for interventions at self-service checkouts with a weighing platform

Hello! My name is Dasha, I work at CSI in a team that is developing the self-service area. Over 10 years, we have installed more than 10 thousand self-checkouts in retail chain stores – and we have a self-service checkout of our own design, called CSI K. You have definitely seen it at least once in a store.
Let's first figure out what it is intervention. In the context of self-checkouts, this is a situation where the normal self-checkout process is interrupted by the intervention of an assistant on the self-checkout “island.” This is bad for everyone: for the buyer (longer purchase) and for the retailer (increased purchase time and costs for assistants). Therefore, the task of our team is to reduce the number of such interventions.
A couple of years ago, we developed a new module for our self-service checkout – a checkweighing platform (KVP). It monitors the weight of the scanned product placed by the buyer on the platform and compares it with what is in the checkout database. This allows you to prevent both fraud on the part of the buyer and simple mistakes. Our checkpoint has already staffed more than 2,000 CSI K cash desks, but we continue to improve its work.
In the article I will tell you how we solved the issue of collecting data from our clients’ KVP – the data that allows us to analyze the operation of the platform, accurately identify the causes of errors and eliminate them. My colleague Roman helped me with technical issues, so he is also invisibly present here 🙂
So, the ultimate goal is to ensure that customers have to see a screen like this with that very intervention as rarely as possible:

Checkweigh platform

Here is our cash register. Note the metal console. In the center, the retailer can install scales so that the buyer can weigh a branch of bananas right at the checkout. The shelves on the sides are elements of the KVP.

Take the item from the cart, scan it, and move it to the other side. Under the shelf there are sensitive scales. The platform verifies the weight of the goods.
Where does the weight in the database come from? The platform trains itself. During the first scan, the cash register remembers the weight of each item sold in the store. If next time it doesn’t match, you understand what will happen: the same intervention. The assistant confirms or rejects the weight of the product, thereby retraining the KVP, setting new weight limits for the product. Of course, the module specifies permissible weight deviations, and in general there are a lot of flexible settings for different categories of goods, designed to avoid unnecessary interventions. In practice, it is very important that the consultant always acts correctly – then the platform is retrained. Without knowing the correct weight, the cash register will stop the purchase every time and infuriate customers.
So, the overall goal is to reduce the number of interventions to the minimum required (age confirmation, for example) and completely remove errors associated with the weighing platform. To do this, the retailer and I need to quickly and objectively assess: what causes interventions at its checkouts, how many there are, what products the platform “swears” at, where the real problem is in the checkout, and where the staff reacts incorrectly.
How to get this data?
Let me remind you that we developed the KVP module from scratch. At first, due to the small number of installations, we could obtain the necessary data from the platform logs manually. But there were more stores, the process was more labor-intensive and longer (after all, you need to provide access, connect to each cash register and analyze the logs, selecting problematic products and the assistant’s reactions). Clients themselves are not always ready to provide data for analysis, especially in the case of floating errors.
A technological solution was required. I offer you a description of it along with interesting live examples of analytics below.
Our solution: tools and process – step by step
What you need is to receive events from the cash register and send them for analysis.
What we use for collection and analysis is the ELK stack for parsing log files from the cash register.
We will deploy the ELK stack on our server – this will be the entry point for cash registers of different clients, and we will reduce traffic as much as possible so that we can connect more cash registers.
What events do we need – messages about errors in the operation of the weighing control service, non-confirmation of the weight of the goods, the action of the assistant at the checkout.
What we want to get as a result are dashboards for problematic products and for checkouts where there are problems with controlling the weight of the goods.

Step 1. Install filebeat data collection service on the checkout
The cash register runs under the Linux ubuntu 22.04 operating system, so we will download the deb package for installation. As a rule, cash registers on the client’s network are denied access to external repositories for security reasons. Therefore, we will download the package in advance and copy it to the checkout. (one line)
curl -L -O https://artifacts.elastic.co/downloads/beats/filebeat/filebeat-8.12.1-amd64.debWe will write an installer for installation, so that later it will be convenient to automate the delivery process and launch it at the checkouts.
sudo dpkg -i ./filebeat-8.12.1-amd64.deb
sudo systemctl enable filebeat
sudo service filebeat restart
Let's add copying of our yml file to the script, be sure to change the rights to the file, otherwise there will be an error when starting.
sudo cp -f ./filebeat.yml /etc/filebeat/
sudo chown root:root /etc/filebeat/filebeat.yml
sudo chmod 600 /etc/filebeat/filebeat.yml
Let's restart filebeat again so that our configuration is applied
sudo service filebeat restartThat's it, now the cash register sends events. Next, we will analyze the configuration for our tasks.
Step 2. Setting up receiving data about events from the cash register
In our case, the cash register records events in a separate log for each product whose weight does not correspond to that recorded in the cash register database. We will report such events to ELK.
Let's add the following rule to filebeat.yml:
– type: log enabled: true paths: – /home/tc/storage/crystal-cash/reports/logWrongItem.csv scan_frequency: 10s include_lines: – '^\d{2}\.\d{2}\.\d{4};\d{2}:\d{2}:\d{2};\d{7,14};\ d{1,5};.*$' processors: – dissect: field: message tokenizer: '%{datetime};%{+datetime};%{barcode};%{weight};%{item}' target_prefix: wrongitem – add_fields: target: event fields: error: “The weight of the product does not match the specified” |
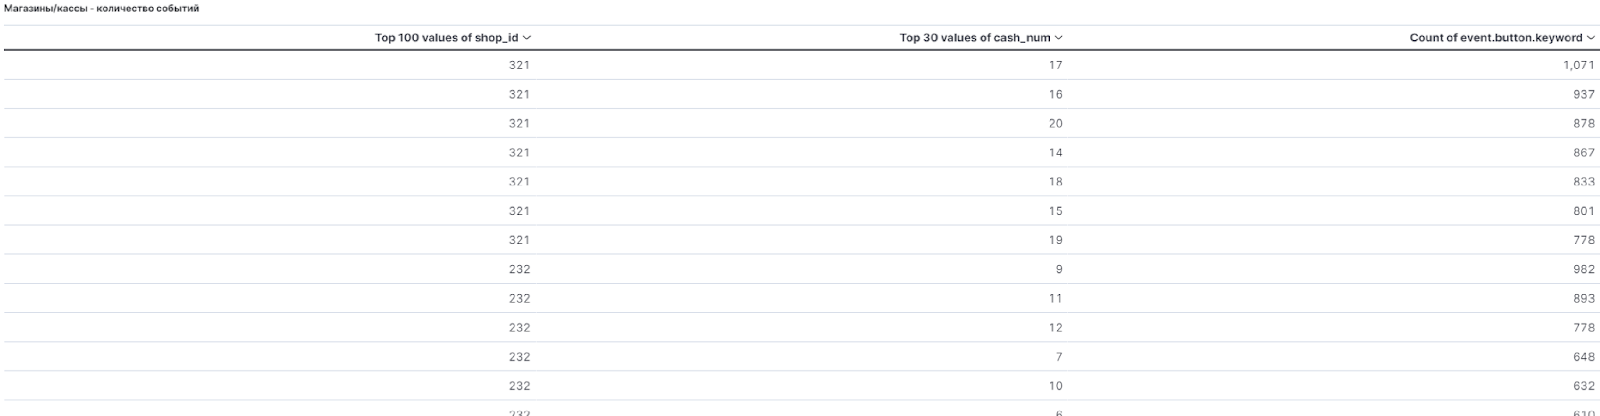
From this data it is possible identify the top 100 most problematic products within one store or the entire retail chain and then deal with each product in more detail.
Salad in a pot, pollock, bananas and water – what's wrong?
I’ll jump ahead a little and show a graph and conclusions that will explain the value of the data obtained for the retailer.

For example, we found out that this list often includes products with inconsistent weight.
The leader in this particular case is salad in a pot. It is sold individually, and its weight varies within 100 grams, and this does not correspond to the specified accuracy parameters of the control and weighing service and the base of product weights. For other products, the tolerances are much smaller, only a few grams.
Also in the top problematic products hits fresh frozen pollock. Why? Here the difference (and therefore the need to confirm the weight) arises from the fact that glaze or ice may accumulate on the fish, which does not affect the price if the fish is weighed in advance, but makes it necessary to confirm that the product corresponds to what is indicated on the barcode, because the weight has increased from – for the ice.
Water container 5 liters When installed on a checkweighing platform, it may take a long time to stabilize because the water pumps and affects the load cell in the platform.
Bananas refer to goods that are purchased very often, they generally have more weighings and they can also fall apart in the bag, if there are several of them, when placed on the platform – this affects the time of weight stabilization, that is, the bananas are still swinging, and the platform has already counted the weight and it does not correspond to what is indicated in the Shk.
But the list also includes goods with apparently unchanged weight, for example pasta weighing 450 g. For such goods there may be significant deviations shouldn't. Most likely, an incorrect weight was saved for the product and now the KVP is constantly “swearing” at this product. In this case, the assistant must maintain the new correct weight for him. The problem is that the assistant on the island often has no time to read the cash register messages and even items with incorrect weights are skipped.
We want to know what the assistant does if he sees a similar situation
To do this, we will “pull out” events from the cash register log, which will show us how he reacted. It has 3 options:
retrain the cash register (Remember the new weight of the goods),
add an item to the receipt without retraining (Skip),
cancel adding the item to the receipt.

We also want to know whether the assistant checks the contents of the receipt after such an error or is negligent in his duties, allowing the store to lose money.
Let's add rules to filebeat.xml for these events:
– type: log enabled: true paths: – /home/tc/storage/crystal-cash/logs/visualization.log scan_frequency: 10s include_lines: – INFO +\[visualization\].+mouseReleased.+Remember new weight – INFO +\[visualization\].+mouseReleased.+Skip – INFO +\[visualization\].+mouseReleased.+Remove item from receipt – INFO +\[visualization\].+mouseReleased.+These errors have been fixed – 'INFO +\[visualization\] Clicking the button: Check product list' – 'DEBUG +\[visualization\] Pressing a button: Taring checkweighers' – 'INFO +\[visualization\] Pressing a button: Taring checkweighers' processors: – add_fields: when.regexp.message: “Remember new weight” target: event fields: button: 'Remember new weight for product' – add_fields: when.regexp.message: “Skip” target: event fields: button: 'Skip item with incorrect weight' – add_fields: when.regexp.message: “Remove item from receipt” target: event fields: button: 'Remove item from receipt' – add_fields: when.regexp.message: “These errors have been fixed” target: event fields: button: 'These errors have been fixed' error: 'Return the product to the platform' – add_fields: when.regexp.message: “Check product list” target: event fields: button: 'Check product list' error: 'Return the product to the platform' – add_fields: when.regexp.message: “Tare check scales” target: event fields: button: 'Tare check scales' |
Step 3. Turn the data into dashboards. How we build graphs from logs
Having created the rules to obtain the necessary data, we can create dashboards. Click Create Visualization, select the desired graph type and go to the settings screen. On the left is a list of fields that can be used; dragging them to the right creates a graph.

For example, if we move the @timestamp field to the main window, the total number of records by time interval will be displayed along the vertical axis and the visualization will change as follows:

For data in reports, you can display summing values for the period, median, average, desired percentile, and so on, that is, all the necessary tools for working with data for an analyst.
At this stage, we are not adding filters for chains/stores/cash registers; we will put them on the finished dashboard so that the data can be filtered by all graphs at once (for this it is necessary that the data be pulled from one source).
After creating the necessary graphs, add them to the dashboard.
During our experiments with the clarity of graphs, we got the following result:

The number of purchase interruptions due to events related to the operation of the checkpoint – when the checkweighing platform does not expect the weight to change: for example, the buyer shifts purchases on the platform, puts an unscanned product on the platform, and when there is a discrepancy between the actual weight of the product and what is recorded in the weighing platform base.
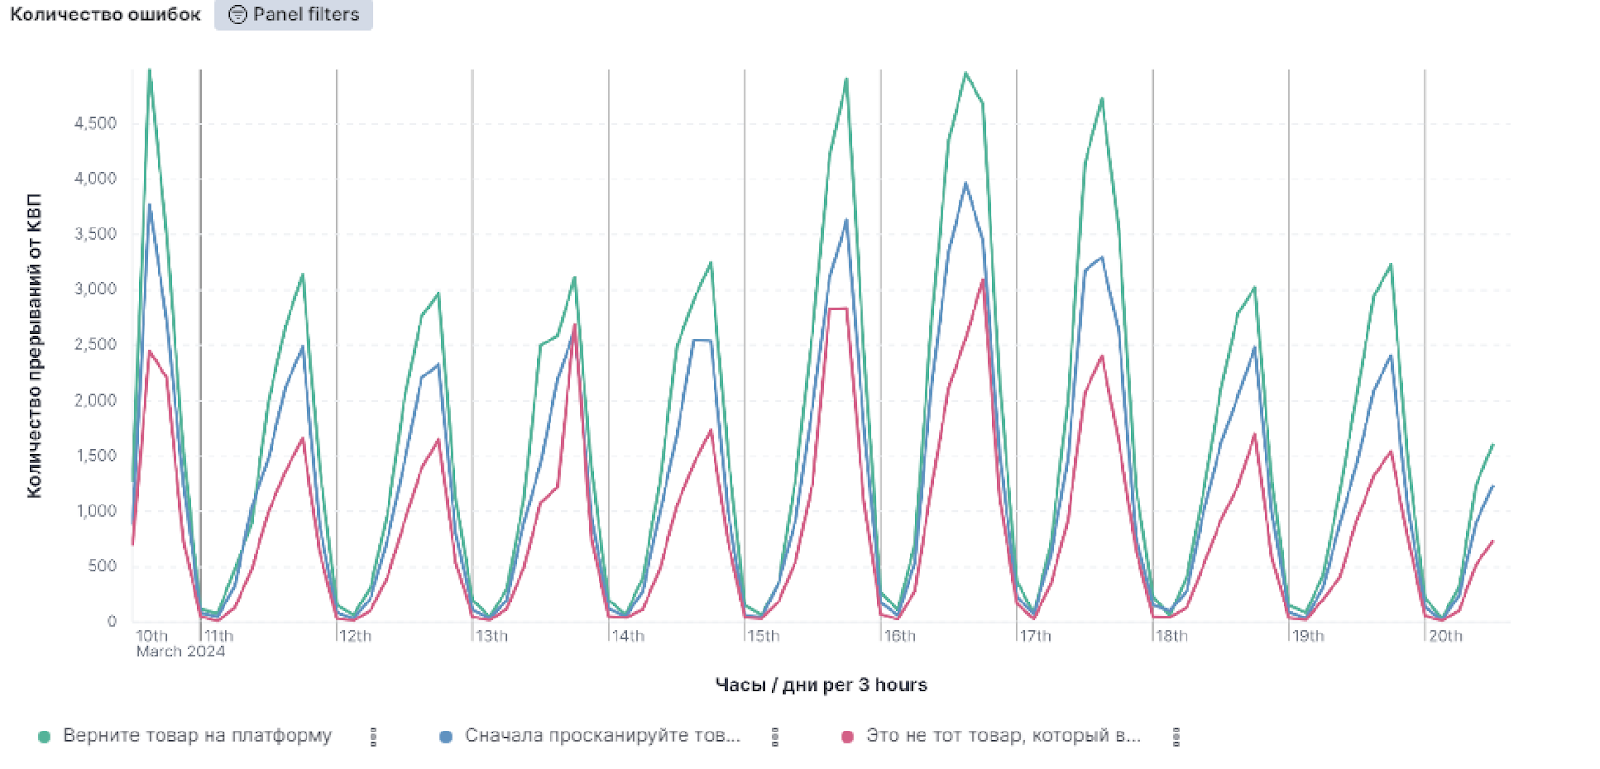
The same purchase interruptions for events related to the operation of the KVP, but displayed in total quantity, to assess their distribution during the week. In most stores, the number of purchases increases on weekends, and therefore the number of events received as a result of the operation of the cash registers. In the total number it is easier to see the correlation with the days of the week.


Distribution of how much weight was actually placed on the staircase. It is more convenient to use when studying a specific problematic product.

TOP problematic products by code, and not by name (for the convenience of searching for a specific product in the weight database, for example).

And one last sign in which you can see which stores and ticket offices currently have events. This is useful because it happens that cash registers are updated or some significant changes are made to the settings, and data stops coming from the cash registers.
In the top panel, above the dashboard, you can filter data by chain/store/checkout and specify the required data sampling period. There is one more feature – now, when connecting a new store, all available data is not distributed according to the actual time of the event, but is recorded by the time the store connected to the service, which distorts the data for analytics.
The main graph that we use to understand problematic goods is presented below (only goods whose weight does not match what is in the weight base of the KVP are included there). And when choosing, for example, a specific product that is repeated most often, you can see what weight was placed on the KVP and how many times this happened during the selected period.

For example, by selecting “Milk, 900 ml”, we will see with what weight the product was placed on the checkpoint and, accordingly, what weight the checkpoint was not satisfied with:

We see that the largest number of repetitions was with a weight of 940 grams, then 960 grams – taking into account possible deviations, these are normal values, the KVP should not give an error for them. And then comes the weight of 1880 grams – obviously, at that moment two goods were placed on the checkpoint instead of one, that is, this is not an error in the operation of the checkpoint. Using the item's code from another chart, we can look in the database at what weight this item is currently stored. And by looking at the last panel of the dashboard, we will find out in which stores and at which checkouts there were errors for this product.
The following graph shows which days the errors occurred. After March 2, there were no events for this product, because the weight in the database was adjusted by the assistant at the checkout or the range automatically expanded due to a large number of repetitions:

We can check whether the weight in the database is correct for the current date, and not include the product in the list for weight retraining (in this case, a manual verification process is described, in fact, the selection of goods for retraining is done using a script, and ELK is mostly used for general assessment “before and after”).
How do we relate product data to intervention data?
At the same time, we compare the receipt data and the number of assistant interventions with what we see in ELK. For example, when receiving a large number of interventions (more than 1 assistant approach per 5 purchases in the presence of KVP), we look at this graph:

In this case, we see a high cancellation rate (7.73%), meaning customers often abandon their cart unpaid and leave. Either something is unclear to customers, or the customer’s age needs to be confirmed to complete the purchase, and there is no assistant on the self-service island, so customers don’t wait. There are also “These errors have been fixed” events (28.89%). The percentage of “Skip item with incorrect weight” events is 16.82% – a significant value, but let's look at an example from another store.

Here, for example, the skipping of goods with the wrong weight is 27.44% – that is, the assistant much more often ignores the discrepancy between the weight in the database and on the checkpoint. Ideally, this should happen mainly in the case of water bottles and goods with variable weights (eggs, baked goods, fruits) that have been drunk on the sales floor. Conclusion: This store needs to retrain on product weights because the assistants not only saved the incorrect weight for the product, but also constantly miss this error without correcting it.
Usually, to compare indicators, we use a full calendar week without holidays, but to understand the dynamics after making updates (for example, retraining for goods), a few days are enough.
The checkweighing service settings are designed in such a way that light-weight goods must be entered in a separate list. This was done due to the technical limitations of the KVP; it cannot measure the exact weight of goods less than 5 grams. Therefore, for example, when a plastic bag or packaging of spices falls on the schedule of problematic goods, we understand that the client’s work with lightweight goods is not fully debugged and this will be an additional reason for the assistant’s interventions. Lightweight goods should not fall into the category of problematic ones; such monitoring allows such situations to be quickly identified and recommendations for adjusting settings are given to the client.
Step 4. Draw conclusions – and reduce the number of interventions
The main thing we get as a result is that we can accurately and quickly identify for the retailer the cause of failures in the operation of the control point. Let's localize the problem. We understand where the human factor is and where the difficulties with a specific product are.
If it’s a product, we make an individual setting for it (different from the general mass of settings), wait, and then take the statistics again. As a result of such retraining of the CVP and retraining of assistants in the correct reaction, the number of interventions is reduced to a minimum.
Using the example of a self-service cash register, we showed only one use case, but in general, ELK is used in our company as a means of collecting statistical information about the behavior of cash registers, the speed of operations, the number of unplanned freezes and other non-functional properties of the cash register that are important for our clients. If you are interested, we will talk about this in more detail in future articles.
We wish everyone only pleasant and quick shopping! If you have any questions, write.
One more thing…
PS While we were preparing the material for this article, our team’s experience was supported by other product areas of the CSI team, because almost every product has something to measure and improve using statistical analysis.
Below are examples from the guys from the cash department, where the described approach is used to measure key cash register performance metrics for each retailer.
speed of adding scanned products
speed of customer authorization when using a discount card or entering a phone number
discount calculation speed


We plan to further develop this tool to obtain important information about the operation of our solutions.