how to identify problems and improve performance

Why measure performance?
This applies not only to React Native, but also to any other technologies. Performance testing is a way to find problem areas, improve application performance and make them more user-friendly.
What metrics are there?
FPS. Frame rate per second. I would like users to constantly see 60 frames per second, and we will strive for this ideal.
Processor resources. It is important to monitor this metric because using them excessively will lead to overheating of the device and increased power consumption. The device heats up, which means the battery runs out faster, and we don’t want the user to leave the application with a hot and discharged phone.
Energy consumption. This metric is strongly tied to processor resource consumption, but also depends on other factors. We'll talk about them in more detail later in the article.
Memory consumption. If you do not monitor it, sooner or later the application may begin to consume too much memory, which will slow it down, and in the worst case, lead to a crash with an Out Of Memory error.
Consumption of network resources. A metric that we should be aware of, but we can only influence it to a limited extent. For the most part, it depends on how our backend works, as well as network bandwidth.
What should you do before profiling?
Obviously, the application will work better on the iPhone 15 than on some old Android. We will choose the second one for profiling:
firstly, our application will be available not only to users who own powerful devices, and so we will take care of their user experience in advance;
secondly, it is on weak devices that it is easier to catch performance problems.

I recommend disabling Dev Mode before profiling. This removes the responsibility from the processor to do the work of checking certain types (for example, prop types). We also relieve the application of the need to prepare convenient logs and warnings for us. This brings our experience closer to that of a real user.
What is important to remember during the profiling process?
1. All tests must be performed several times – this way we will get a more or less objective result. For example, if you simply scroll the list at normal speed, you may not notice problems at first, but if you scroll the same list twice as fast, the likelihood of noticing glitches, lags and other problems increases.
2. Average measurement results. For example, we conduct a list scrolling test and do it 5 times to get an objective result and get FPS values - 50, 56, 52, 50, 58. But working with several values at the same time is extremely inconvenient, so we just take the arithmetic average and work with the FPS value = 54.
3. Between measurements it is necessary to save one state of the deviceto obtain the most deterministic result. If we measure performance when we have no processes in the background and when N more processes are running, with a high degree of probability we will get different results.
4. If possible, automate the profiling process. In some cases, it is recommended to carry out measurements from 100 to infinity times, and in order not to run the instrument 100 times manually, this matter can and should be automated. One of the tools we’ll talk about next can be automated using adb.
#1 Perf Monitor
Let's move on to the tools. The first one is RN perf Monitorbuilt into Flipper.
What are its advantages? RN perf Monitor is a kind of LightHouse for React Native applications and it is quite easy to connect. Here we see three main metrics:
average FPS JS stream;
average FPS UI stream;
the so-called JS threadlock, that is, the time when the JS thread was “blocked” – doing some work and could not take up more resources.
I suppose this is the fastest way to evaluate a performance at a high level. The result will depend on the device used.
Target values. What should you strive for? | |
JS FPS | always > 0 |
UI FPS | as close as possible to 60 |
JS Threadlock | was aiming for zero |
Final assessment of the performance | 100 points* |
*The authors of the plugin write in the documentation that you can get 100 points only if you run a clean application. As soon as you start adding or correcting something, you will never see 100 points. The score drops simply because some logic appears in the application that loads the processor. Everyone decides for themselves which indicator is “sufficient”; first of all, it is suitable for tracking progress – if it was 60 and became 65, it means it has become better, and vice versa 🙂 | |
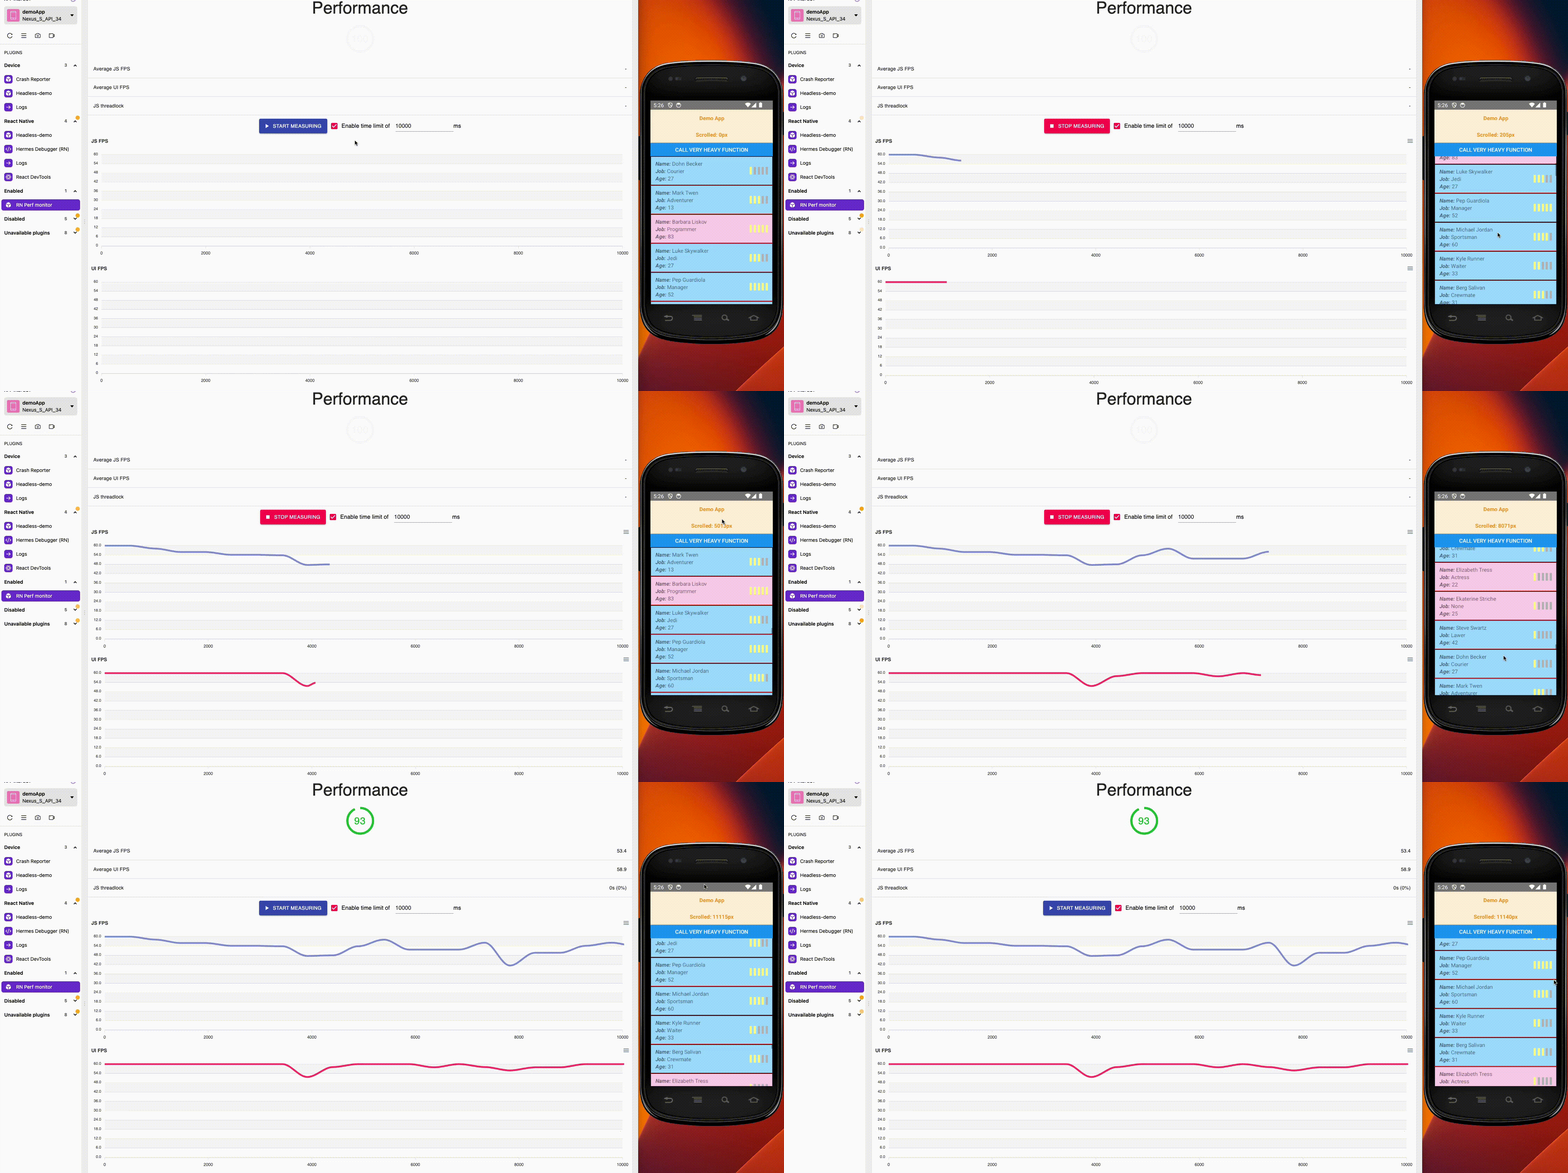
Let's look at how the RN perf monitor works using an example:
We specify the amount of time in milliseconds that the recording will last.
We press start and perform the actions whose performance we want to measure, for example, measuring a non-optimized list with non-memoized items.
Let's start recording and start scrolling the list. We see live how JS FPS and UI FPS behave. At the end we get 75 points.

It can be seen that the average JS FPS was 45. Let's say that the result of 75 points does not satisfy us, improvements are needed. We memoize the item sheet and try to take the same measurements.

From the graphs you can see that the application behaves much better. At the end we get 93 points.
Eventually: The tool performs the task of high-level performance assessment and allows us to understand whether the optimizations we applied had any effect.
#2 React DevTools
The next tool is familiar to everyone React DevTools. Its main advantage is its popularity. It is familiar to the vast majority of React developers. In addition, it can be used immediately: it is built into Flipper and also covers a significant number of UI-related cases. Finally, it is as informative as possible – it has a very user-friendly UI.
React DevTools has two main tabs: Сomponents And Profiler. In the first, you can see the tree of elements, namely, how individual elements are represented in it.

This tab can be used to find problem areas. However, for the initial analysis we are more interested in the profiler tab.
By the way, before using this tool in the settings, I recommend checking the box next to “Show why did component renders”. This way you can see why a particular component was rendered during a given commit.
At the top right you can see a list of commits that were recorded in this session. Commit is the phase in which React groups all view changes and sends them to the native thread for rendering. You can switch between these commits and see in which commit specific changes occurred.
All elements in React DevTools are presented in the form of strips, so-called “bars”, of different widths and colors:
Width tells how long the last render of the component took in the process of the last commit relative to other elements.
Color The bar tells you how long it took to render during the selected commit.
Grey indicates that the component was not rendered at all during the commit process.
Yellow — the component in this commit is quite heavy compared to the others.
Green — the rendering was pretty easy.
But my favorite tab is Ranked: Here the components are sorted from heaviest to lightest, so it is very easy to find where problems arise.
In the example below, the “problematic” component is the Virtualized List, which takes the longest and is yellow in the tab Flamegraph. In Ranked it also appeared at the very top, which suggests that it was the heaviest component.

Let's go back to the non-memoized list example. The graphs show which components are rendered. You can notice an unpleasant dark green stripe, it even has yellow squares. This suggests that many components in the process of this commit were not very light.
In fact, this list is small – there are not many items, and they are all quite simple. Your application will likely contain lists with more complex items. Even these seemingly not the heaviest elements take, as you can see on the Ranked tab, 7-8 milliseconds of rendering.
Now let's memoize the list elements and see what changes.

Now only list cells are rendered, and the cell content itself is rendered only once. In the Ranked tab you can see that all our components are green. In fact, they have not become lighter – it’s just that now the heavy cell content is not re-rendered at all and therefore does not appear in this tab, since it only displays those components that were rendered during the selected commit.
Eventually: The tool is great for finding problematic components.
#3 Android Studio Profiler + Hermes Debugger
The next couple of tools are Android Studio Profiler And Hermes Debugger. I consider them in conjunction:
Android Studio Profiler has quite wide functionality. Its connection does not require any special manipulations, since it is already built into Android Studio. However, it gives little information about what is happening in the js thread.
To go deeper into this, we have Hermes Debuggerwhich perfectly complements Android Studio in this regard.
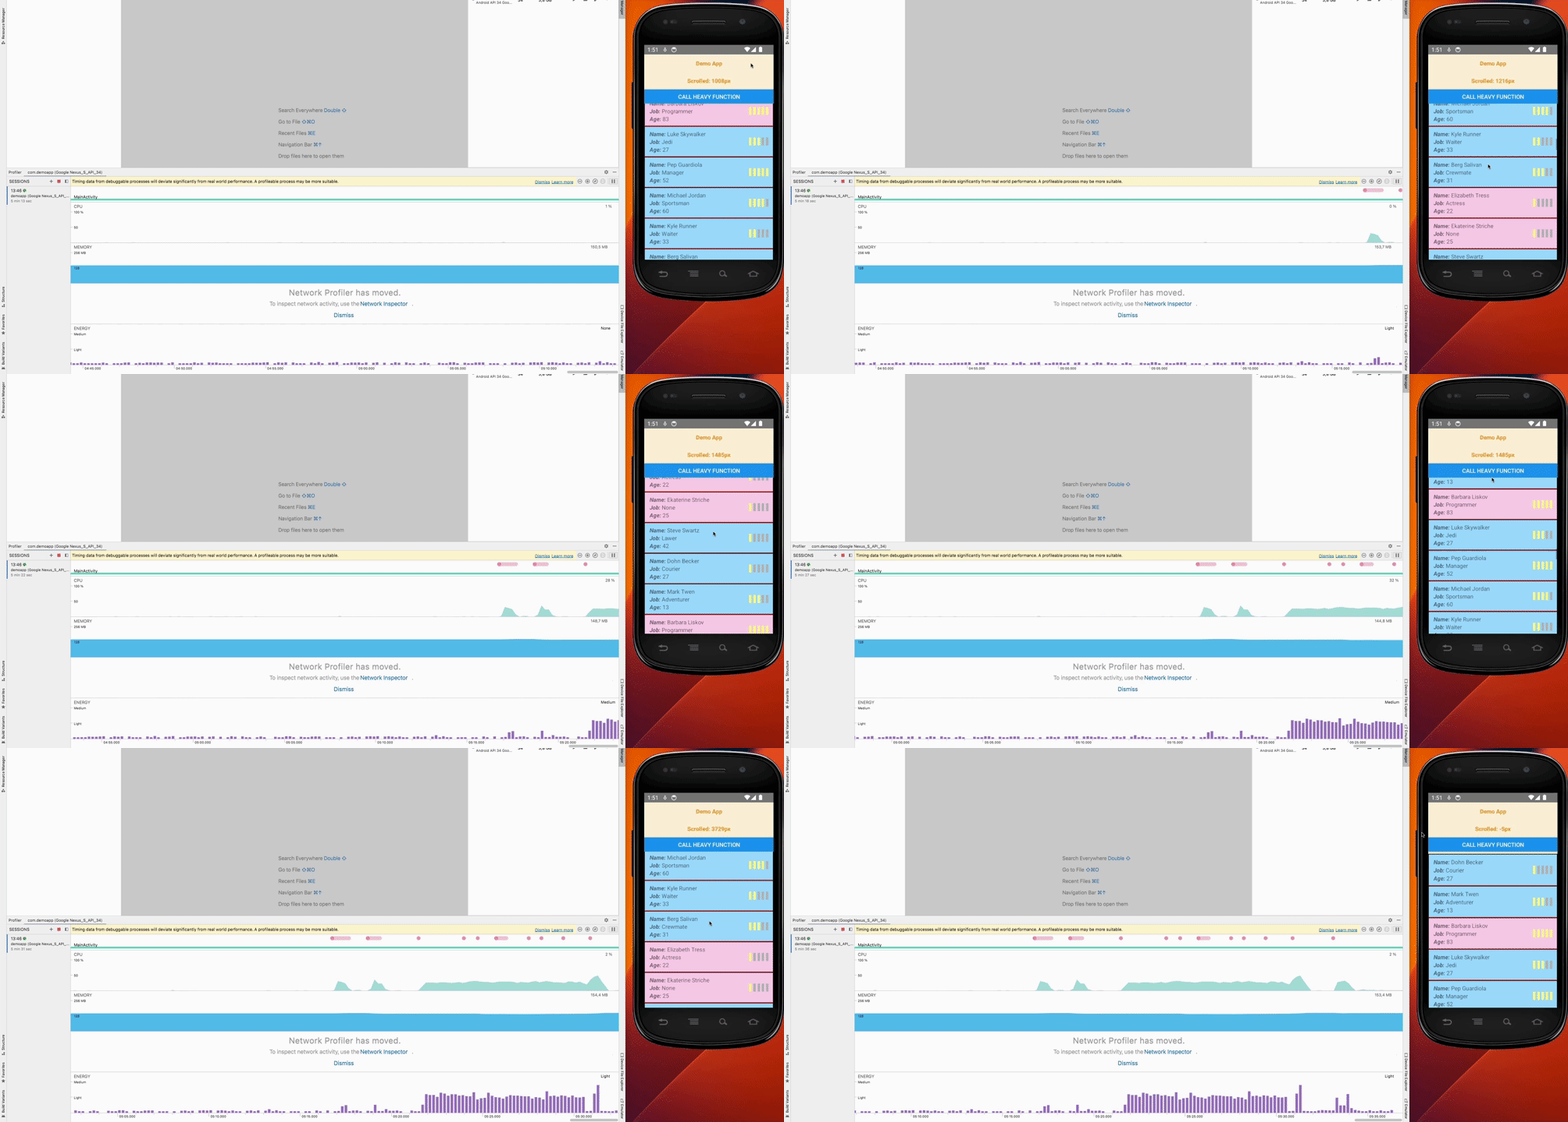
Here is an example of measurements of how the processor behaves in Android Studio Profiler. On the right is an open emulator with a demo application. You can see the scroll and the value of the pixels scrolled from the beginning of the list. There is also a Call Heavy Function button, which calls some heavy function. There is a CPU section that shows the load on the processor. Pink dots will appear above it, indicating that some user event has occurred.
I start scrolling the list, and those same events appear.

We press the button and see that the load on the processor has increased, and the value of the pixels when scrolling now does not change. We understand that with a high degree of probability the problem is in the js stream, since we write in RN and first of all pay attention to exactly what happens where our logic lies, and in our case this is JS code. To verify this, let’s open the CPU section and see which thread has been busy with work all this time. It can be seen that the mqt JS stream (this is our JS stream) was very busy with something for 8.5 seconds. The hypothesis was confirmed.

It would seem that everything else is simple. We can go into the code and see exactly which function is called when processing the button click event. In our case, this is veryHeavyFunction, which calculates the factorial 200 thousand times. But finding the source of the problem is not always so easy 🙂
Typically, a handler does not directly call any heavy function. But it can call some service, which, in turn, can call another service and so on an infinite number of times.

To help us fall down this rabbit hole, we turn to Hermes Debugger for help.
So, let's go to Hermes Debugger and record the same session there. Click on the “Call very Heavy function” button. Next, we sort all called functions by total time and see that, for example, 57% of our total time was spent on executing the factorial function. This makes sense because it was implemented using recursion and called itself. Case solved! Next we can do something with this function to lighten the load on the processor.
Energy consumption
As promised, let’s take a closer look at this metric. In addition to the load on the processor, energy consumption can be influenced by other factors that are not always obvious. Among them:
Wake lock – a mechanism that forces the processor or screen to work at those moments when the user, it would seem, is no longer using the application. This often applies to applications that show videos – after all, a user launching a two-hour video hardly wants the phone screen to lock after a minute and the video to stop.
Alarms — allow you to run any background tasks outside the application context.
Jobs – a mechanism that allows you to perform any actions when the state changes (for example, the disappearance and appearance of a network).
Calls to the GPS sensor to determine geoposition.

This is what the expanded power consumption section looks like in the Android Studio profiler. By pointing at any area, you can see what the energy consumption consists of at a particular point in time.
For example, I selected an area and see: at the moment, energy consumption is at an average level and you can see what it consists of:
average processor load (the main reason for this level of power consumption);
low load on the network and no load on the location.
Wake Locks: 1 – indicates that one Wake Lock is active at the moment (indicated by a red stripe below) and has a direct impact on energy consumption.
Alarms & Jobs: 0 and Location: 0 – indicates that there are no jobs or calls to the GPS sensor at the moment.
Memory Analysis
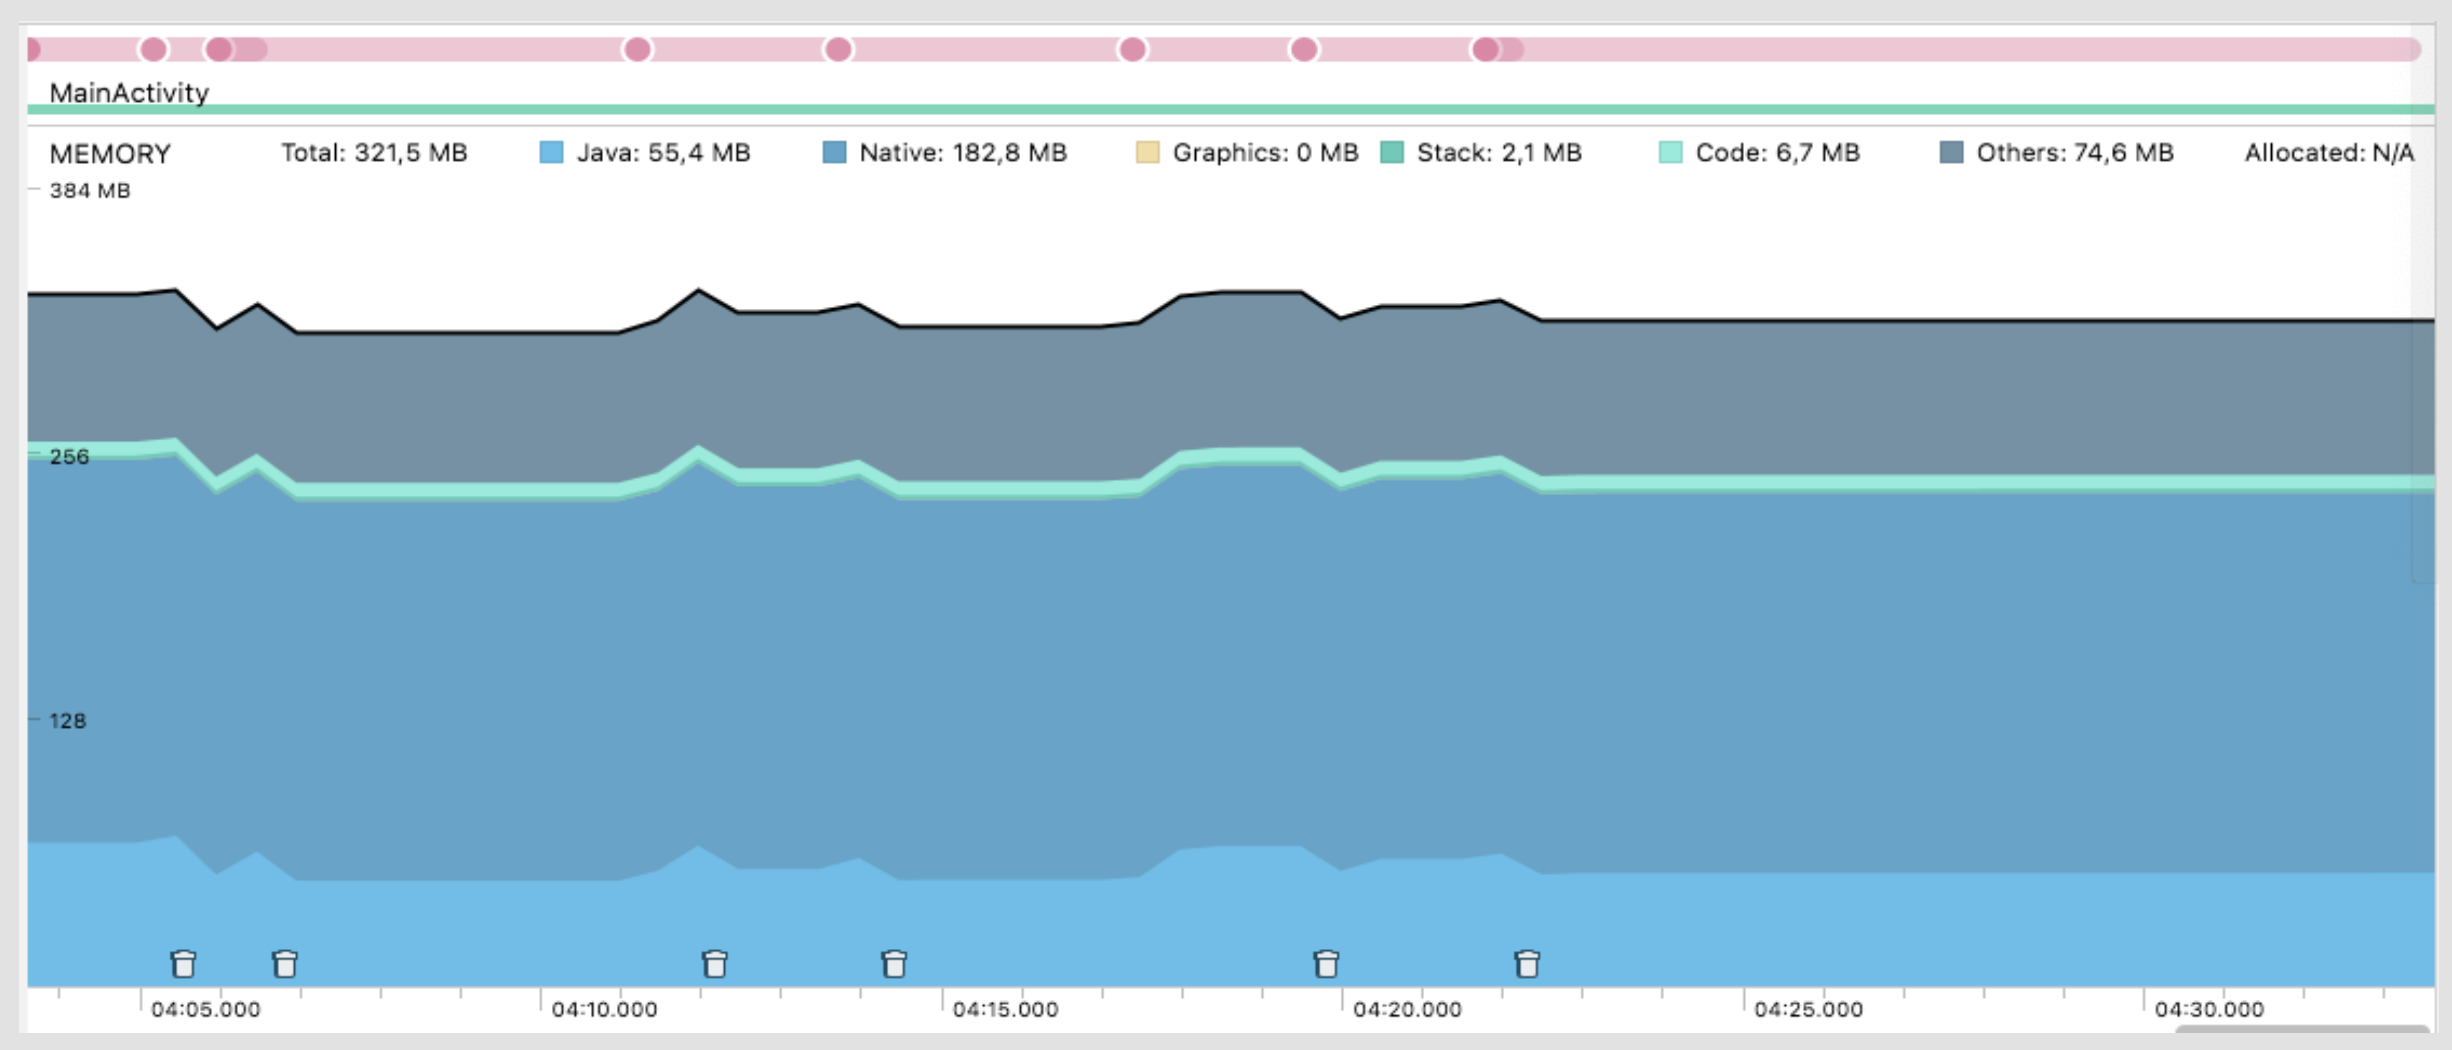
Finally, let's talk about memory analysis. This is what an expanded memory section looks like in the Android Studio profiler. From the top you can see what memory consumption consists of, for example, native code, stack, etc. But we're interested in the others section because that's where our JavaScript is located.

Let's return to our example, but now we have a Fill Memory button, each click on which creates a large JS object and adds it to an array, the length of which we constantly monitor, thereby preventing the garbage collector from removing it from memory. This way we artificially fill the memory with JS objects. In the video, Objects created shows the number of objects created. With each click of the button, the graph grows linearly.

This is not a normal situation. Our others section is growing, that is, exactly the section that shows the memory consumption of the JS code.
Considering that the code is written in react native, the first thing we would think is that the problem is in JS. Apparently, we are creating too many heavy objects somewhere and not cleaning them up. To verify this, go to Hermes Debugger.

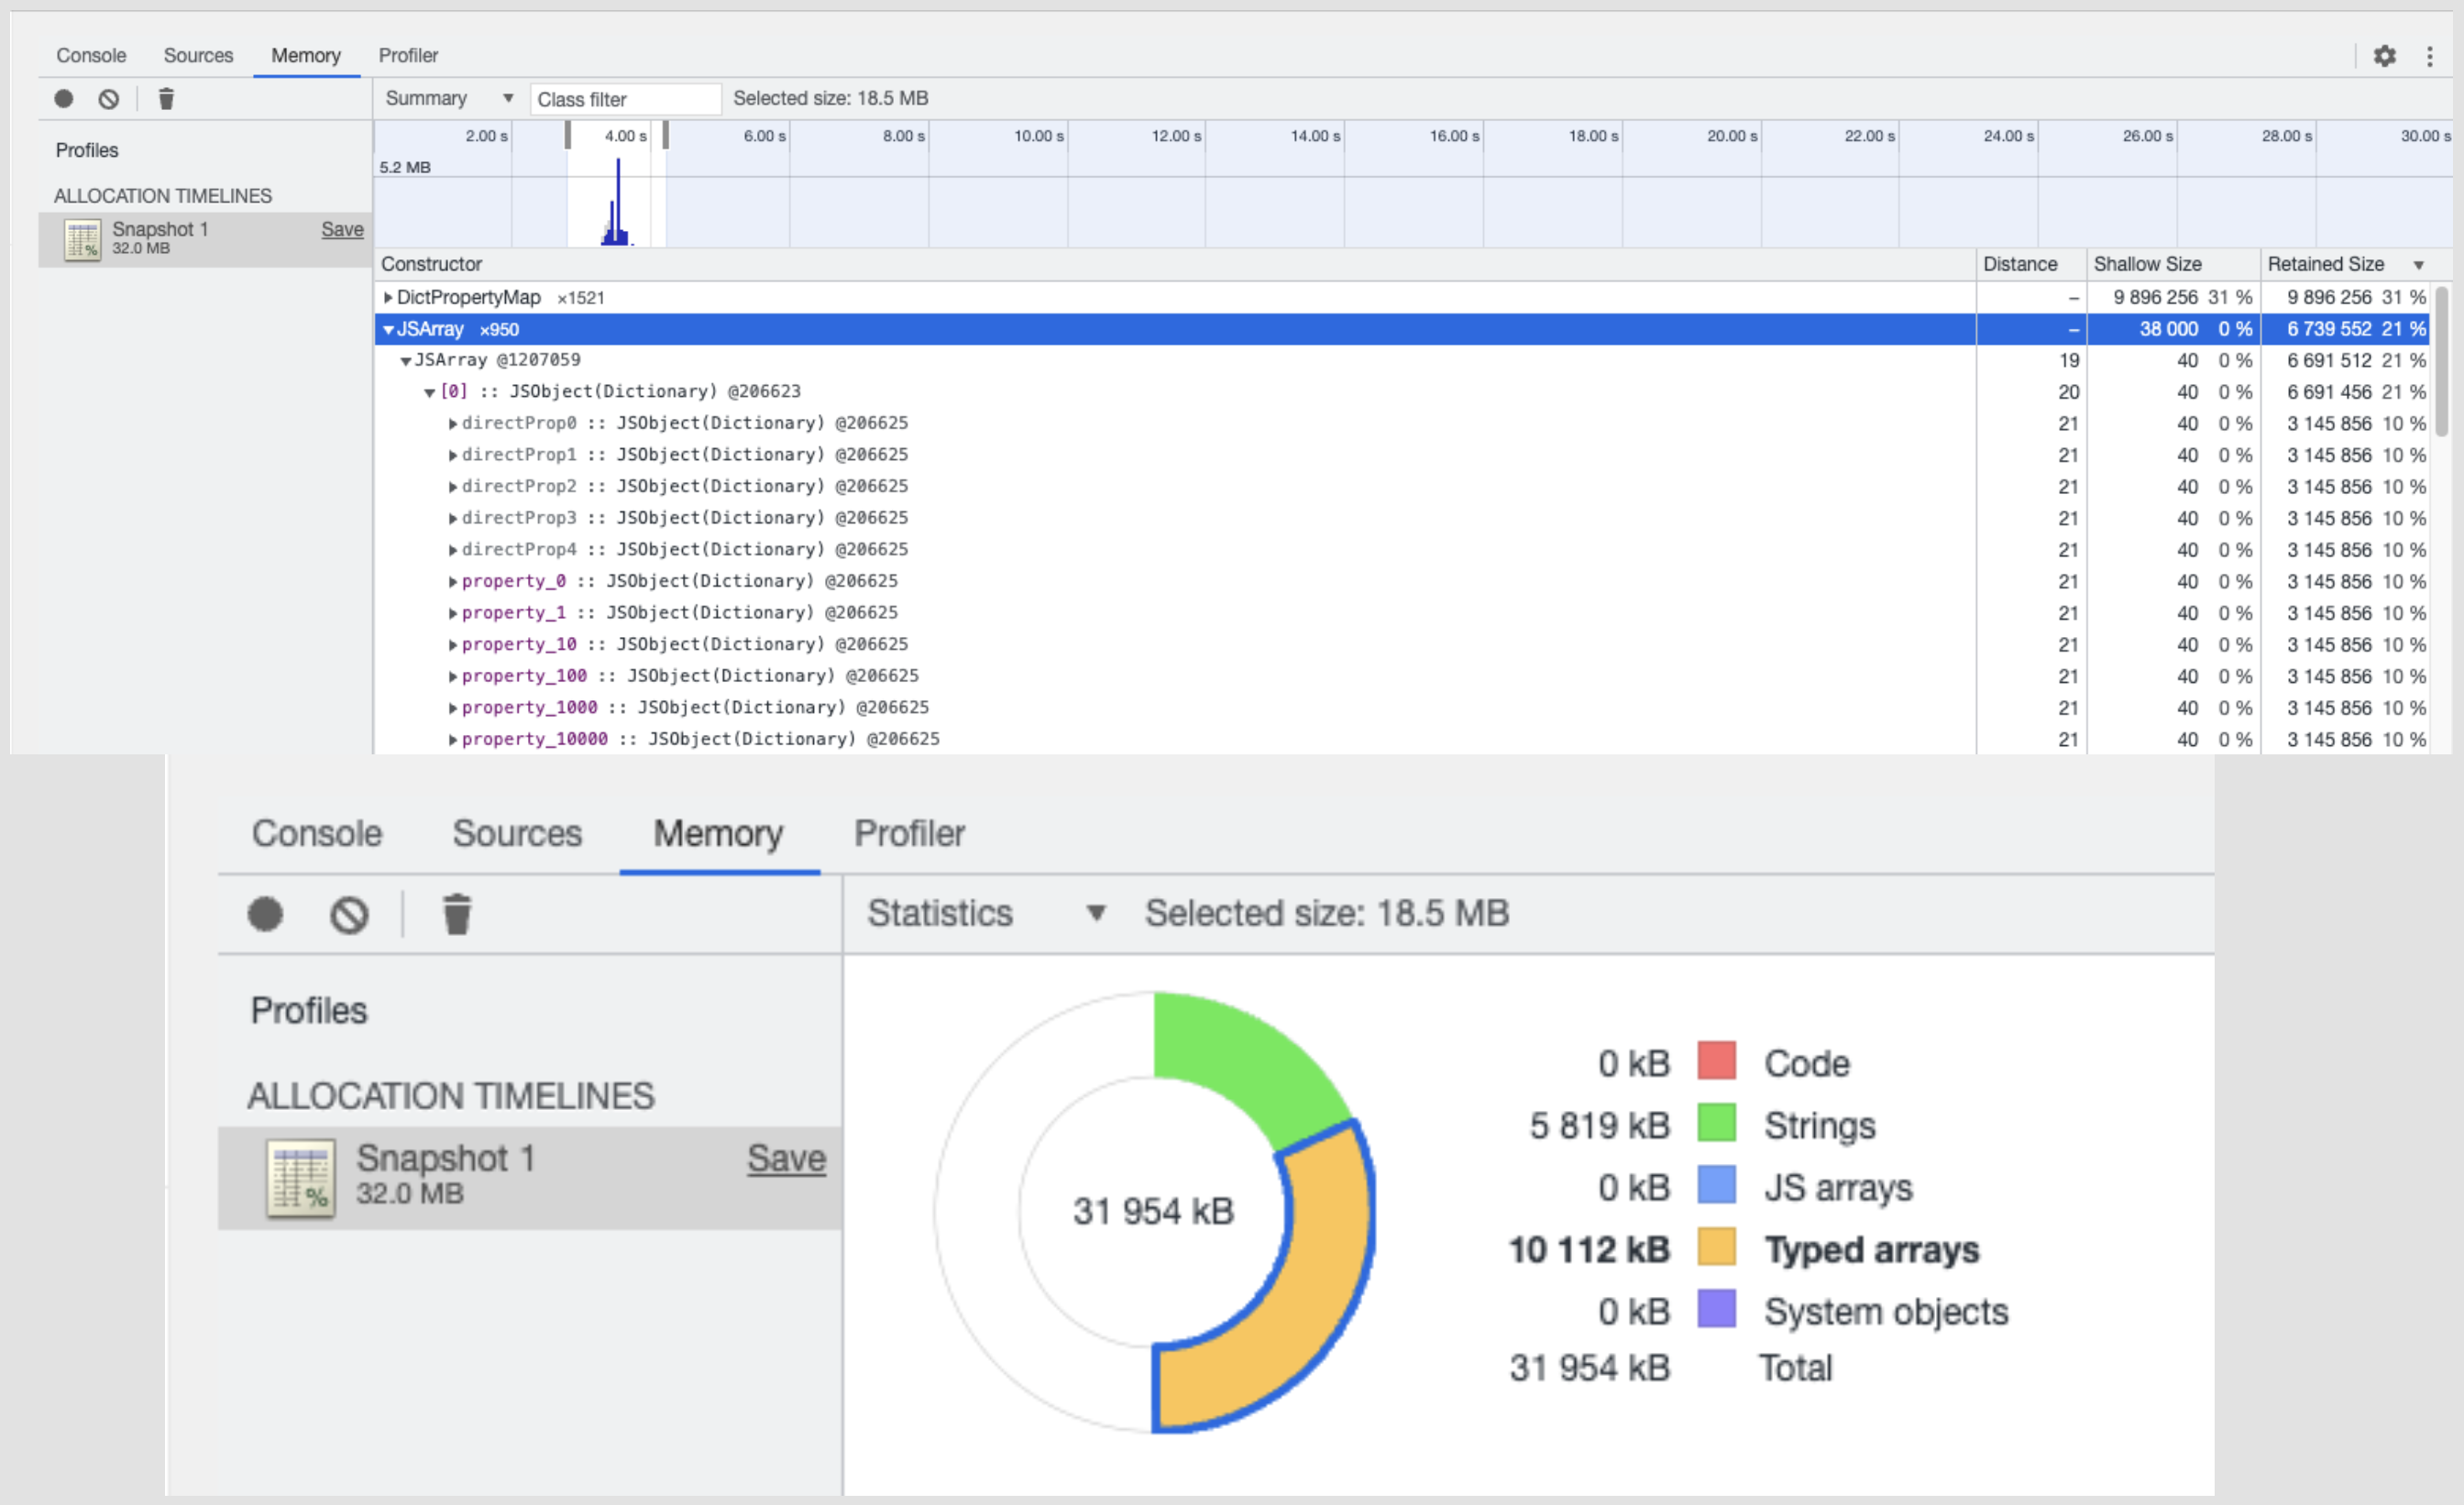
In the tab Memory you can record the same session that we conducted in the Android Studio profiler. Upon completion of the recording, we see the result in the “statistics” tab. This way, during a recorded session, you can see what the total memory consumption consists of. It can be seen that quite a large amount of memory is occupied by arrays.
The easiest way is to sort objects by Ritained Size or Shallow Size:
Shallow Size is the size of the object itself. It does not take into account the sizes of the objects that the object refers to.
Ritained Size — the size of the object itself and all objects to which it refers.
It can be seen that the JS array takes up the largest amount of memory. Having opened it, it becomes clear that it consists of objects that have properties. From them it will already be possible to determine what is the source of the problem. If you see, for example, an object with the Order Number field, then it is clear that a lot of memory is occupied by the object of some order, and you can already work with this. Thus, we found an object that filled the entire memory and was not removed from memory throughout the recorded session.
conclusions
In fact, there is always room for improvement, and performance is no exception. Don’t stop at the tools I’ve reviewed—look for new ones and use them in conjunction. I discovered a combination of Android Studio Profiler and Hermes Debugger, which, in my opinion, complement each other perfectly.
You can watch the report Alexandra Moura is one of the creators of the RN perf monitor. This is a fairly useful tool that allows you to evaluate performance at the highest level and immediately see whether something has improved after some manipulations or not.
Also look towards XCode instruments. This is an analogue of the Android Studio profiler, but for iOS. In this article, we only looked at Android, because it is better to choose a weak Android device for profiling. However, bugs specific to iOS may arise – this is where the XCode instrument can come in handy.
Thank you for your attention. I will be glad to answer your questions in the comments!
SberMarket's tech team manages social networks with news and announcements. If you want to know what's under the hood of high-load e-commerce, follow us on Telegram and on YouTube. And also listen podcast “For tech and these” from our it managers.


