How is it that with an extra build step, my Zig application speeds up 10 times
For several months now I have been interested in two technologies: the Zig programming language and the Ethereum cryptocurrency. To explore both in more detail, I wrote on Zig bytecode interpreter for the Ethereum virtual machine.
The Zig language is great for optimizing performance and also provides granular control over memory and workflow. To make it even more interesting, I put down checkpoints by which I compared my Ethereum implementation with the official implementation in Go.

Recently I tinkered a little with my script and, as it seemed to me, did a simple refactoring in it – but the performance of my application fell off. As far as I could determine, it was all about the change, which can be seen in the difference between these two commands:
$ echo '60016000526001601ff3' | xxd -r -p | zig build run -Doptimize=ReleaseFast
execution time:  58.808µs
$ echo '60016000526001601ff3' | xxd -r -p | ./zig-out/bin/eth-zvm
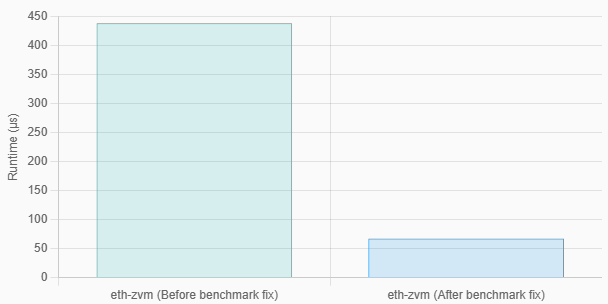
execution time:  438.059µs
zig build run is simply a shortcut that allows you to compile and execute a binary file. It should be equivalent to the following two commands:
zig build
./zig-out/bin/eth-zvm
How does an extra build step allow this program to run almost 10 times faster? faster?
Minimum configuration to reproduce this phenomenon
To debug this performance oddity, I tried to simplify my application until the program went from being a bytecode interpreter to an application that simply counted the number of bytes and read them from stdin:
// src/main.zig

const std = @import("std");

pub fn countBytes(reader: anytype) !u32 {
    var count: u32 = 0;
    while (true) {
        _ = reader.readByte() catch |err| switch (err) {
            error.EndOfStream => {
                return count;
            },
            else => {
                return err;
            },
        };
        count += 1;
    }
}

pub fn main() !void {
    var reader = std.io.getStdIn().reader();

    var timer = try std.time.Timer.start();
    const start = timer.lap();
    const count = try countBytes(&reader);
    const end = timer.read();
    const elapsed_micros = @as(f64, @floatFromInt(end - start)) / std.time.ns_per_us;

    const output = std.io.getStdOut().writer();
    try output.print("bytes:           {}\n", .{count});
    try output.print("execution time:  {d:.3}µs\n", .{elapsed_micros});
}
Using this simplified application as an example, the difference in performance is clearly visible. When I start the byte counter with the command zig build runit runs in 13 microseconds:
$ echo '00010203040506070809' | xxd -r -p | zig build run -Doptimize=ReleaseFast
bytes:           10
execution time:  13.549µs
When I try to directly execute the compiled binary, it takes 12 times longer to run, namely 162 microseconds:
$ echo '00010203040506070809' | xxd -r -p | ./zig-out/bin/count-bytes
bytes:           10
execution time:  162.195µs
I made a test of three commands combined into a bash pipeline:
1. echo outputs a sequence of ten bytes in hexadecimal encoding (0x00, 0x01, …).
2. xxd converts echo bytes (hex) to binary bytes
3. zig build run compiles and runs my byte counter program, counting how many binary bytes it produces xxd.
All the difference between zig build run And ./zig-out/bin/count-bytes is that the second command runs an already compiled application, and the first one first recompiles this application.
I was stunned again.
How is it possible that with an additional compilation step the program turns out faster? Maybe the Zig app runs faster when it's hot?
How I turned to the Zig community for help
This is where I'm stuck. I re-read my source code again and again – and could not understand how the application runs faster when “compiled to run” than when lifted from a ready-made compiled binary.
Zig is still a fairly new language, so it’s logical that I might misunderstand something in it. I decided that if I showed my code to experienced Zig programmers, they would immediately find my error.
I posted my question on Ziggit, this is a discussion forum for Zig. The first few responses suggested that I was having problems with “input buffering” but didn’t give any specific advice on what could be fixed or what points to investigate further.
To my surprise added to the thread Andrew Kelly, founder and lead developer of the Zig language. He couldn't explain the phenomenon I was seeing, but he pointed out that I was making a different performance mistake:
“It seems like you're making one system call per byte read? Productivity suffers greatly from this. I'm guessing that when an extra step occurs in the build process, some kind of buffering is accidentally done at that step. Really, I'm not sure why. The build system forces the child process to directly inherit file handles.”
Finally my friend Andrew Ayer noticed my post about this on Mastodon and solved the riddle:
Michael, do you see the tenfold difference in cases where the input is large chunks (say, more than 1 MB)? Will this difference remain if you redirect stdin from the file to the pipeline pipe?
I think when you execute the program directly, xxd And count-bytes start working simultaneously, so the channel buffer is empty at the moment when count-bytes the first time it tries to read information from stdin, it has to wait for xxd to fill it. But if you use zig build runin this case xxd gets a head start when compiling the program. Therefore, by the time count-bytes tries to read stdin, the pipe buffer is already full.
Andrew Ayer was absolutely right, and below I will break this situation down.
Note: Andrew Ayer also helped me solve and another difficult performance case.
I had the wrong idea about how bash pipelines work
I've never thought much about bash pipelines, but thanks to Andrew's comment, I realized I was misunderstanding how they work.
Imagine a simple bash pipeline like this:
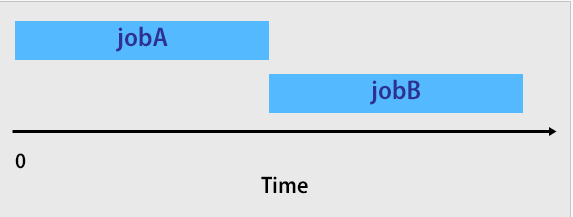
./jobA | ./jobBI believed that jobA starts and runs until completion, and then starts jobBwhich accepts the output jobA as input.

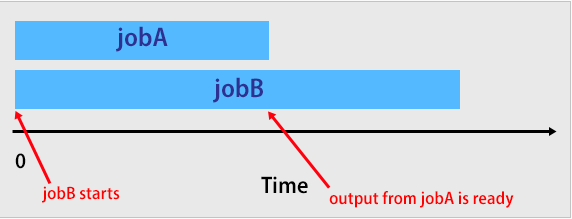
It turns out that all the commands in the bash pipeline are run at the same time.

To demonstrate parallel execution in the bash pipeline, I decided to test the concept with two simple bash scripts. Here's what I got.
jobA starts, then goes to sleep for three seconds, prints the result to stdout, goes to sleep for another two seconds, then exits:
#!/usr/bin/env bash

function print_status() {
    local message="$1"
    local timestamp=$(date +"%T.%3N")
    echo "$timestamp $message" >&2
}

print_status 'jobA is starting'

sleep 3

echo 'result of jobA is...'

sleep 2

echo '42'

print_status 'jobA is terminating'
jobB starts, waits for input to stdin, then prints whatever it can read from stdin until stdin is closed:
#!/usr/bin/env bash

function print_status() {
    local message="$1"
    local timestamp=$(date +"%T.%3N")
    echo "$timestamp $message" >&2
}

print_status 'jobB is starting'

print_status 'jobB is waiting on input'
while read line; do
  print_status "jobB read '${line}' from input"
done < /dev/stdin
print_status 'jobB is done reading input'

print_status 'jobB is terminating'
If you run jobA And jobB in the bash pipeline, exactly 5.009 seconds elapse between messages jobB is starting And jobB is terminating:
$ ./jobA | ./jobB
09:11:53.326 jobA is starting
09:11:53.326 jobB is starting
09:11:53.328 jobB is waiting on input
09:11:56.330 jobB read 'result of jobA is...' from input
09:11:58.331 jobA is terminating
09:11:58.331 jobB read '42' from input
09:11:58.333 jobB is done reading input
09:11:58.335 jobB is terminating
If you adjust the execution so that jobA And jobB executed sequentially rather than pipelined, with only 0.008 seconds passing between messages starting And terminating each of the tasks:
$ ./jobA > /tmp/output && ./jobB < /tmp/output
16:52:10.406 jobA is starting
16:52:15.410 jobA is terminating
16:52:15.415 jobB is starting
16:52:15.417 jobB is waiting on input
16:52:15.418 jobB read 'result of jobA is...' from input
16:52:15.420 jobB read '42' from input
16:52:15.421 jobB is done reading input
16:52:15.423 jobB is terminating
Back to my byte counter
Once I realized that all the commands in the bash pipeline are executed in parallel, I immediately realized what was happening in my byte counter:
$ echo '00010203040506070809' | xxd -r -p | zig build run -Doptimize=ReleaseFast
bytes:           10
execution time:  13.549µs

$ echo '00010203040506070809' | xxd -r -p | ./zig-out/bin/count-bytes
bytes:           10
execution time:  162.195µs
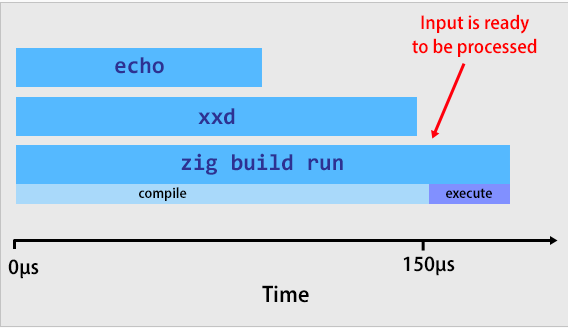
Apparently for execution echo '00010203040506070809' | xxd -r -p within the pipeline it takes approximately 150 microseconds. The zig build run step should take at least 150 microseconds.
By the time the application count-bytes actually starts working in version with zig build, he does not have to wait for the completion of tasks launched earlier. The input is already waiting for it in stdin.

If you miss zig build and directly run the compiled binary, then count-bytes immediately starts working, and then the timer starts. The problem is that count-bytes you have to wait idle for ~150 microseconds until the commands echo And xxd will put the desired input into stdin.

Benchmark fix
It turned out to fix the benchmark Just. I decided not to run the application within the bash pipeline, but moved the preparation and execution stages into separate commands:
# Преобразовать ввод из шестнадцатеричной кодировки в двоичную.
$ INPUT_FILE_BINARY="$(mktemp)"
$ echo '60016000526001601ff3' | xxd -r -p > "${INPUT_FILE_BINARY}"

# Считать ввод в двоичной кодировке в виртуальную машину.
$ ./zig-out/bin/eth-zvm < "${INPUT_FILE_BINARY}"
execution time:  67.378µs
Then the previously observed figure of 438 microseconds was reduced to only 67 microseconds.

How I Followed Andrew Kelly's Advice and Fixed Performance
Let me remind you: Andrew Kelly pointed out to methat I make one system call for each byte read.
...
while (true) {
      _ = reader.readByte() { // Медленно! Один системный вызов на каждый байт!
          ...
      };
      ...
  }
So, whenever my application called readByte while running in a loop, I had to pause execution, ask the OS to read the input, and then resume after the OS delivered a single byte to me.
Fix this problem it wasn't difficult. I needed to use buffering when reading. Now instead of reading one byte at a time from the OS, I used the built-in std.io.bufferedReader function available in Zig. With its help, my application can read large pieces of data from the OS. Thus, I have to perform many times fewer system calls than before.
Here is the code with all the changes:
diff --git a/src/main.zig b/src/main.zig
index d6e50b2..a46f8fa 100644
--- a/src/main.zig
+++ b/src/main.zig
@@ -7,7 +7,9 @@ pub fn main() !void {
     const allocator = gpa.allocator();
     defer _ = gpa.deinit();

-    var reader = std.io.getStdIn().reader();
+    const in = std.io.getStdIn();
+    var buf = std.io.bufferedReader(in.reader());
+    var reader = buf.reader();

     var evm = vm.VM{};
     evm.init(allocator);
I re-ran my code and noticed that it was another 11 microseconds faster, a very modest 16% speedup.
$ zig build -Doptimize=ReleaseFast && ./zig-out/bin/eth-zvm < "${INPUT_FILE_BINARY}"
execution time:  56.602µs
What if we tested a larger input?
Currently, my Ethereum interpreter only supports a small subset of all Ethereum opcodes. The most complex calculations it currently supports are adding numbers.
For example, here is an application for Ethereum that counts to three by pushing 1 onto the stack three times and then adding these values:
PUSH1 1    # Сейчас стек содержит [1]
PUSH1 1    # Сейчас стек содержит [1, 1]
PUSH1 1    # Сейчас стек содержит [1, 1, 1]
ADD        # Сейчас стек содержит [2, 1]
ADD        # Сейчас стек содержит [3]
The largest application I've benchmarked is Ethereum bytecode that counts to 1,000 by adding up the units.
After I succeeded reduce the number of system calls on the advice of Andrew Kelly, my “counter up to 1000” began to cope with the work not in 2,024 microseconds, as before, but in only 58 microseconds – an acceleration of 35 times. Now I have done the official implementation of Ethereum almost twice.

A little cheating for maximum performance
I was very excited to see that my Zig implementation was finally superior to the official Go version. But I wanted to see how much more performance could be improved by using Zig correctly.
A typical bottleneck in software development is memory allocation. The program has to request memory from the operating system and wait for the OS to grant this request.
Zig has a memory allocation mechanism that works with a fixed-size buffer. With its help, you can not request memory from the OS, but provide the allocating mechanism with a fixed buffer with bytes, and when allocating memory it will use only these bytes.
Here you can use a trick: I compiled this version of the Ethereum interpreter, which can receive only 2 KB of memory allocated from the stack:
diff --git a/src/main.zig b/src/main.zig
index a46f8fa..9e462fe 100644
--- a/src/main.zig
+++ b/src/main.zig
@@ -3,9 +3,9 @@ const stack = @import("stack.zig");
 const vm = @import("vm.zig");

 pub fn main() !void {
-    var gpa = std.heap.GeneralPurposeAllocator(.{}){};
-    const allocator = gpa.allocator();
-    defer _ = gpa.deinit();
+    var buffer: [2000]u8 = undefined;
+    var fba = std.heap.FixedBufferAllocator.init(&buffer);
+    const allocator = fba.allocator();

     const in = std.io.getStdIn();
     var buf = std.io.bufferedReader(in.reader());
I call this technique “cheating” because I specifically optimize the code for specific benchmarks. Naturally, there are full-fledged Ethereum programs that require more than 2 KB of memory, but I'm just curious how much speed can be achieved by doing such optimizations.
Let's say I already know during compilation how much memory I might need as much as possible. Let's see how this affects performance:
$ ./zig-out/bin/eth-zvm < "${COUNT_TO_1000_INPUT_BYTECODE_FILE}"
execution time:  34.4578µs
Cool! Using a fixed-size memory buffer, my Ethereum implementation runs the “count to 1000” bytecode in just 34 microseconds, almost three times faster than the official Go implementation.

Conclusion
The conclusion I draw from this experiment is that benchmarking needs to start early and be done more often.
By adding a benchmarking script to my continuous integration system and archiving the results, I could easily notice when my measurements changed. If I delegated benchmarking to a separate task that was performed periodically manually, it would be difficult for me to determine exactly what was causing the difference in measurements.
This experience also highlights how important it is to understand the metrics you are measuring. Before I stumbled upon this bug, I thought that my benchmark took into account the time it takes to wait for other processes to fill stdin.
Source
eth-zvm: Virtual machine for Ethereum, which I implemented on Zig out of interest


