How I developed a web service for booking charging stations for electric vehicles (part 2)
Preface
Hello everyone, Arseny Eliseev is in touch again! We continue to work on creating a web application for managing EPS reservations, which we started earlier: https://habr.com/ru/articles/803697/. Now we will turn our attention to practical aspects: the construction of a mathematical model of the method, its software implementation and the economic justification of the developed IT solution.
Building a mathematical model
And now the time has come to build the mathematical model itself. There are 3 main processes that are repeated over time, the costs of which must be optimized:
1) Traveling parts of the route from the starting point/current charging station to the ending point/next suitable charging station;
2) Waiting for a charging station to be available;
3) Carrying out the charging procedure.
Let's try to represent them using the highest level of the objective function:

The cost expression of the time spent during the passage of parts of the route, taking into account road transport conditions, waiting for the release of the electric charging station and charging on it, will be calculated by identifying it with the lost distance that could be covered by the electric car in this time period, expressed in the amount of energy for implementation of this with translation into the final cost according to the average tariff. For this reason, it is worth introducing constants: the average speed of a passenger vehicle in a modern metropolis, according to the study, is 55 km/h, and the average tariff based on aggregated data for consumption of 1 kWh by an electric vehicle at a charging station – 15 rubles. Also, after each part of the journey, it is necessary to check whether the amount of available electrical power is sufficient to determine the possibility of reaching any of the following route points to approach the final destination:

Let us recall the study of Romanian experts (Radu Flocea et al., 2022), from which it follows that the most acceptable period of time during which the user can plan to book charging station slots to suit his needs is 2 weeks. For convenience, the shortest period available for reserving a charging station slot can be taken to be 15 minutes, with the addition of 5 additional minutes for events that will occur after the charging procedure is completed. Due to the fact that we cannot say what the actual waiting time will be for the driver when approaching the EPS slot or the actual preparation time for initializing the charging session, then tj,m(wait) can be modeled by choosing a random value between 60 and 300 seconds (this should then be converted to hours) to add a “pinch” of stochasticity. Together with the decomposition of the variable ti,j(dist) and tj,m(charge) the objective function takes the following form:

As mentioned earlier, the set of electronic zones with the initial and final points of the route represent a directed graph. It is quite obvious that there is no point in taking into account its peaks, which are geographically located in the Urals, if the trip takes place within the boundaries of conventional Moscow. In this regard, it is necessary to filter the EPS slots that will participate in route modeling. To do this, I propose a specially developed approach, which consists in finding the midpoint of the segment between the starting and ending points of the route and enclosing in the filtering area those charging stations whose Euclidean distance between their location coordinates and the coordinates of the middle of the segment between the starting and ending points of the route is no more than 120% of the Euclidean the distance of half the segment divided by the previously mentioned midpoint. Those same 20% provide the opportunity for some maneuver: for example, you can back up a little to recharge the electric car in order to then follow the intended route. A graphical interpretation of this approach looks like this:
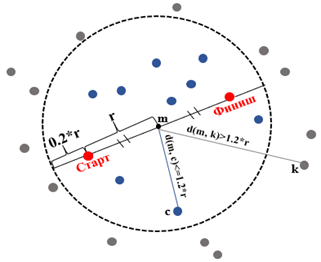
In addition, it is necessary to eliminate logical errors associated with graph theory, such as moving from one vertex to the same one, returning to the starting vertex and continuing movement from the final vertex. Now finally:

It is this mathematical model that will be used for the sum of the weights of the edges of the oriented graph (the costs of passing sections of the route), and will also serve as a fitness function for choosing the best chromosome (route) when using genetic algorithms:

Also, to build an alternative suboptimal route, a method will be used that consists of sequentially excluding charging stations included in the optimal route from the network according to the increasing number of time windows available for reservation and building a new route in order to ensure that a large selection of periods for reservation is maintained.
Web application development
Stage 1: Structure and Stack
*The link to the open source Github repository for this web application is provided at the end of the article.
The web service is built on the basis of a containerized application, the choice of which is determined by its ability to be deployed in any environment and operating system, which significantly facilitates its distribution and increases the level of fault tolerance. Traditionally used as an application containerizer Docker. Thus, the web service is provided by the operation of 4 containers:

1) java application:
The main part of the backend of a web application, which is responsible for executing computational algorithms to implement the routing and booking functions. In addition, it also contains database interaction logic for working with charging stations and reservation time windows. Developed on the framework Spring for the Java platform, the choice of which is determined by the speed of the Java programming language, convenience and popularity in the field of web development.
2) python-application:
An auxiliary part of the web application backend, which takes on one of the functions of the main part for calculating the duration of a fast charging session. Developed on the framework fastAPI for the Python platform, the choice of which is determined by its “lightness”, suitable for a web service of this size, as well as the general adaptability of the Python programming language for solving problems in the field of machine learning and, in particular, for creating and using pickle models.
3) frontend:
The frontend is the part of a web application that takes over the functions of the user interface and related components. Developed on the framework jQuery for the JavaScript platform, the choice of which is determined by the presence of Legacy code of other modules.
4) postgres:
The database of a web application, which ensures the flow of transactions for recording, storing and deleting information to prevent the operation of its functions. Implemented on a familiar DBMS PostgreSQL. Mainly needed for working with objects of charging stations and temporary armor windows.
Stage 2. Frontend part of the application
The best representation of the front-end part of the application is a direct demonstration of the appearance of the interface and its functionality. Achieving these goals can be achieved with a GIF image:

You can see that when booking time slots for the next day, the periods from 18:00 to 19:00 are not offered. Now, looking a little into the backend, or rather into the database, we can see that these options were already previously booked by someone else:

Also worthy of attention is the functionality associated with searching for an alternative suboptimal route. His work can also be demonstrated with a GIF:

Stage 3. Backed part of the application
To briefly analyze the backend part of the application, let’s first look at the endpoints present in it:
1) /weather/getTemperature:
This endpoint returns the rounded average temperature for a specific user-selected day and the coordinates of his current location or the location he has selected. Obtaining this information is provided by a request to the API service “Open-Meteo“;
2) /schedule/getTimeWindows:
Using this endpoint, a list of already booked time windows for each charging station slot is obtained from the database for the route date previously selected by the user. This list is necessary for subsequent filtering in the interface of only time windows available for booking;
3) /weather/saveTimeWindows:
At this endpoint, the selected temporary reservation windows for each charging station slot on the route are saved in the database along with the issued reservation code;
4) /routing/getFilteredStations:
This endpoint returns a list of EPS slots that satisfy the parameters selected by the user in the “Details” tab, for subsequent marking on the interactive map and building a route;
5) /routing/getRoute:
For this endpoint, a list of route points is returned along with their coordinates and additional parameters in the form of the distance from the starting point of the route to this point, the duration of the journey from the starting point to this point and the duration of the charging session (if the point is an EPS slot). Routing is carried out by accessing the service API “OpenRouteService” It is worth noting that in the free version of this API, which is used in the demo version of this application, the interval between requests is 2 seconds.
Let's take a closer look at the last method. It is within its boundaries that one of the previously mentioned resolution algorithms for finding the optimal path is implemented: Dijkstra’s method or genetic algorithms. To implement the work of these approaches, an adjacency matrix of a oriented graph is required, and within the framework of their software implementation, it is represented in the form of an associative array, where the key is the id of the charging slot of the electric charging station, and the value is an associative array with the key in the form of the id of the next possible charging station slot to reach and value in the form of an associative array of characteristics of this route point. The simplest explanation of the structure would be to demonstrate it directly:

As part of the selection of the most preferable algorithm for finding the optimal path, 5 tests are carried out, the essence of which is to build 5 separate routes under different conditions, followed by recording their performance criteria values for each of the selected methods. The test results can be presented in the following table:
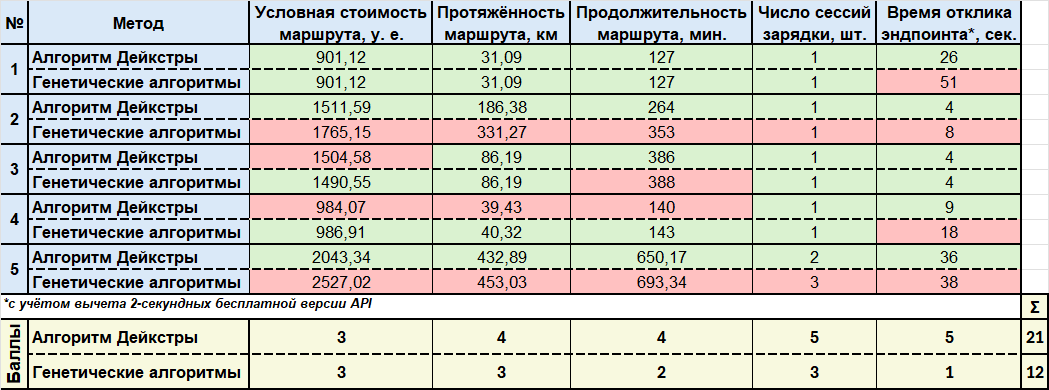
The experimental results show that for all the introduced criteria, except for the conditional cost of the route, where parity is observed, Dijkstra's algorithm demonstrates a higher number of points. In this regard, it will be the one that allows and will be used in the demo version of the web application.
Economic justification for the developed web application
Let's calculate the economic effect of the proposed web application on the financial condition of the company based on the calculation of one of the most important indicators demonstrating the effectiveness of the implemented IT solution in any enterprise: return on equity (ROE). It determines how much net profit a company generates on its invested capital. For this purpose we will use the popular strategic profit model from the consulting company “DuPont“, based on data from the balance sheet and income statement from 2023. This tool provides an opportunity for a visual presentation of the interdependencies between the financial indicators of the enterprise and the impact of changes in their values in connection with the implementation of the developed web application on the previously specified important indicator.
Due to the need to maintain the confidentiality of the company's financial information, the calculation of items of potential income and expenses associated with the implementation and operation of the web service is skipped. Let's consider the immediate results of chain substitutions in the strategic profit model:

From the proposed model, we can conclude that the cost of goods sold increases due to the investments made in the web application, while gross sales revenue increases due to the offer of a new service for reserving charging station slots. In connection with these changes in indicators, there is an increase in gross profit, and with constant total costs, due to the lack of influence on the structure of fixed and variable costs, it increases the value of income tax. This chain of changes entails an increase in net profit, which increases the net profit margin by approximately 0.01%. Due to the lack of impact of the implementation of the web application on the structure of the holding’s balance sheet and the increase in gross receipts from sales, the value of the asset turnover ratio increases by approximately 0.00008. Due to this chain of changes, the return on assets increases by approximately 0.01%, which, with unchanged financial leverage due to the absence of changes in the structure of the holding’s balance sheet, leads to an increase in the return on equity by approximately 0.01%. Thus, the target indicator of the model actually increases after the implementation of the web application in question, which proves the positive economic effect it brings to the company.
Results
As part of this work, we were able to go through the process of creating an application: from theoretical foundations to software implementation. I hope that the presented material will be useful to colleagues who work in the field of electric transport in Russia. Tell us how you solve various problems in this area, and also share your opinion about this work in the comments. All the best!
*Repository with open source application: https://github.com/yelis-alt/research/tree/prod/stations_booking_service


