guide for those who made it before the fire

In every project, sooner or later there comes a time when it is necessary to conduct load testing. Most often, this happens late: the site is already crashing under the influx of users, the start page does not load, and processing queries in the database takes more than a minute. At such moments, a new task appears in the tester’s Jira to find bottlenecks in the system.
Of course, in such a situation there is no time to carry out load testing according to all the rules, but if you managed to win a couple of days or had a rare chance to conduct testing before the “fire”, then this article is for you. My name is Alena Vakhtina and I am a leading testing specialist at the League of Digital Economy – I will share my experience.
Setting goals
Let's start by setting load testing goals. Saddling a website by putting it to sleep for a while is not load testing. This will only show that you can open the tool and supply a large number of threads, no more.
To be fair, I will say that load testing is also carried out this way, but such an approach is unlikely to help detect all the bottlenecks of the project. Therefore, I recommend starting gradually. I will highlight several possible goals:
find the bottlenecks of the project that most weakly support the load;
understand how long a site can maintain an average load;
find out the maximum number of simultaneous users.
Based on our goals, we divide load testing into three large groups:
Tests are run for a short time, with each new iteration the number of threads increases. With this approach, we determine at what point the site stops supporting the load, and we can also look for bottlenecks.
We do testing for a long time, for example an hour, a working day or a day. The number of threads is slightly above average. This will make it clear how the product will behave under decreasing load, and find possible memory leaks.
We start tests with the maximum number of threads. Here we look at how long the site can maintain peak load. In addition, it is worth monitoring how recovery occurs after a fall.
It is best when you have time to conduct all three types of tests. But most often you can only manage one. In this case, it is best to choose a gradual increase in flows.
Product Research
We have decided on setting the goal. Here you could open the same JMeter and start writing scripts. But what queries should I specify? Covering the entire product with tests is usually difficult, if not impossible. This is why you need to explore.
Sit down with a pen and paper and write down what actions your user most often performs, what entities he views, and maybe creates. After that, add your experience: think about where the project can stall the most.
For me these are logs and reports, as well as search. But if logs are used constantly, then reports are rarely generated, so I will exclude them from load testing, but I will definitely check the remaining two points.
Show the received scenarios to the analyst and architect, perhaps they will tell you a couple more or tell you to discard some extra ones. The remaining list of tests will be loaded.
Setting up the environment
Next, you need to understand where load testing will be carried out – not in production. Therefore, let’s decide what else is needed to conduct the research.
First, we need to decide on which stand we will start testing. Ideally, the test bench should be relevant to the product, but most often this is not possible, so you just have to use what you have, calculating the proportions. If you manage to order a separate stand, it is better to calculate convenient proportions in advance.
In addition to the stand, you need to set up a monitoring system. The most commonly used are:
Zabbix;
Victoria metrics;
Prometheus;
etc.
These programs are needed to obtain additional information about the state of our system at the time of load.
Monitoring systems are very flexible. There are hundreds of different templates on the Internet for checking the slightest movement of the system, so it is worth discussing in advance with the DevOps engineer the parameters that should be monitored. Here is a sample list of those that I ask you to configure on a separate screen in Zabbix, but depending on the product it may vary:
CPU;
memory;
I/O internet;
kafka connection;
bd connection.
Of course, these are not all the necessary parameters, and some may be unnecessary in your projects, for example kafka connection, if the product itself does not use Kafka.
The final configured monitoring looks like this:

Or like this:

In the absence of monitoring systems and time, you can use standard Linux utilities to configure them:
htop (or top);
vmstat;
p.s. axu;
iostat;
iotop;
atop.
However, monitoring systems are not everything: they will only indicate the problem, but will not help to fix the error at the moment it occurs.
Let's look at how different parts of the application communicate:
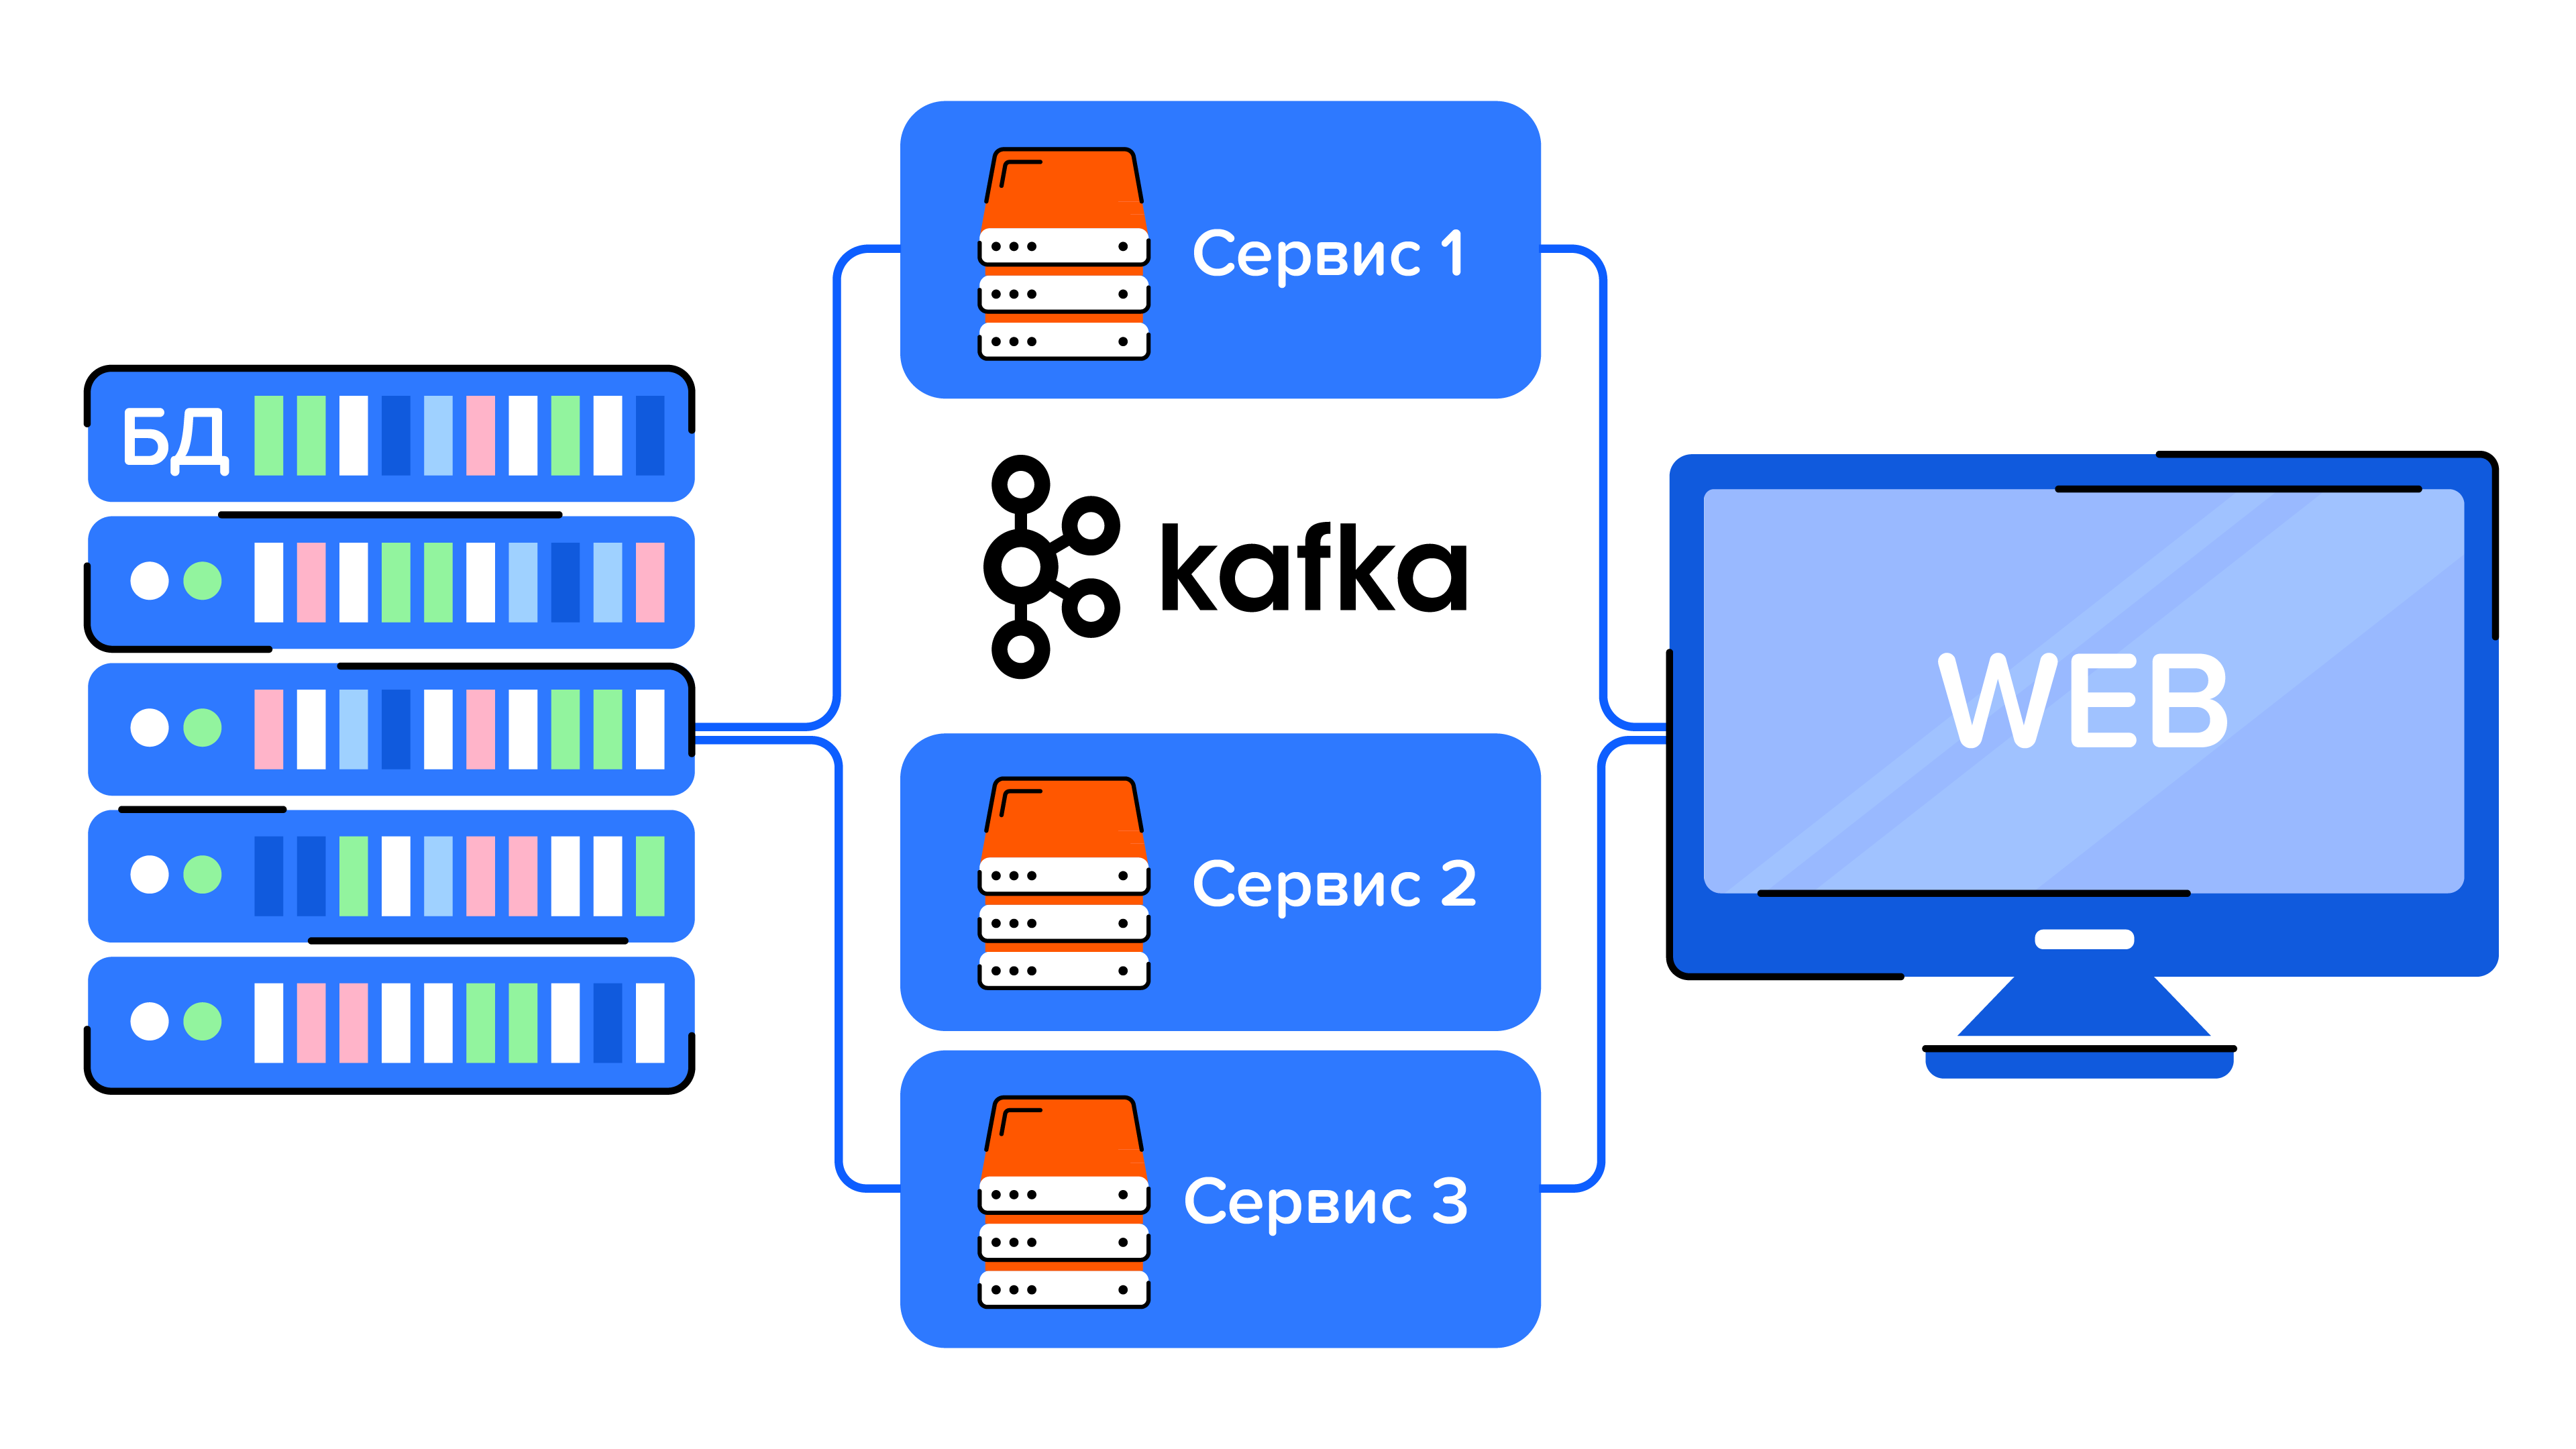
Therefore, to catch problems in various places, the application will need: analysis of logs for the back-up, removal of database activity for the database and the Kafka Tool for Kafka.
After final configuration of the application, you can proceed directly to the load.
Selecting Tools
I will not describe in detail the choice of tools, because you can read articles on this topic Here, Here or Here. I use Apache JMeter. I won’t say that I chose him consciously, but I’m quite happy with him. I will list the positive and negative aspects.
Pros:
a large amount of information and articles;
the ability to add new plugins;
cross-platform;
convenient data analysis;
ability to work with ui and through the terminal.
Minuses:
It eats up a lot of memory and can crash your entire computer;
not all plugins work well.
Perhaps this list may differ for some.
Some lifehacks with JMeter
Since I already said that I use JMeter, I’ll tell you a few interesting things that I would like to know in my first attempts at load testing.
JMeter load tests need to be run from the console. Seriously, it's even written on the start page.

This is easy to do:
jmeter -n -t
Tests run from the console distribute the load better and have more relevant results.
You can not only create tests by hand, collecting each REST request separately, but also record them using Recorder. However, the advice is controversial: I prefer self-written tests because they are more controllable, easier to edit, and the tester has a better understanding of what is happening. But we have to admit that working with Recorder is an order of magnitude faster. You can read how to do this Here.
There is no need to send the maximum number of threads from the very beginning. I think I've already talked about this. If you are too lazy to start and stop manually, gradually changing the number of users, then JMeter has the Stepping Thread Group and/or Ultimate Thread Group plugins. Use them.
It’s worth pairing JMeter with Allure. In the future, when you write a report on load testing, it will be helpful. You can read how to do this in article.
It is convenient to use variables and direct access to the database.
Besides this, there are other convenient things. It’s not for nothing that JMeter itself released an article Best Practices.
Writing a report
Let's say load testing has been carried out. Here I missed how this was done, because there is a lot of information on this topic; in extreme cases, you can always read the documentation.
It's time to write a report. Why do this?
Firstly, so as not to lose what you have already done. How can I compare the results after fixing the problem if no records were saved?
Secondly, not every developer, architect or analyst is ready to accept your graphics. It is imperative to analyze the results and draw conclusions.

Thirdly, load testing is increasingly included in the list of documents for product delivery, so with experience in writing reports it will be easier to provide an answer at the time of the deadline.
In any case, whether to write a report or not is your choice. But if you still decide to do it, here are some tips.
Come up with a structure that is convenient for you in advance. Our load testing report template looks like this:

Let me briefly go through each report heading:
Goals – Why are we doing this testing?
Test Scenarios — what scenarios were chosen for the load this time. Helps explain to the customer using examples of real user steps.
Test Environment — description of the environment in which the load will be carried out.
Product Settings — what settings are set in the database, Kafka (number of connections, waiting time, etc.) and other places.
Stand parameters — table of capacities for the stand (space, memory, etc.).
Description of charts — a reminder on JMeter charts.
Test progress — screenshots of JMeter and Zabbix graphs for each individual launch.
Conclusions and comments — what can be said about the system, what bottlenecks were found during load testing, how the indicators have changed compared to the previous load.
Decoding the results
Decoding the results obtained is the culmination of load testing. Loading the stand so that it just falls doesn't make sense. It is necessary to correctly explain how and why this happened, find problems and give possible tips for correcting errors.
The results of load tests can be obtained from the graphs of JMeter itself and from monitoring systems. Let's start with the first ones.
Summary Report
Summary report on passing the test. A summary table showing the max/min/avg time (time in milliseconds) for each request, percentage of errors, and other parameters.
Label — label for the request.
Number of requests (# Samples) — the number of requests with this label.
Average – average time.
Min — minimum request time.
Max — maximum request time.
Error % — percentage of requests with errors.
Performance (Throughput) — number of requests per second.
Received KB/sec.
Sent KB/sec.

Response Time Graph
You can see multi-colored lines on the response time graph. These lines show the response time of an individual transaction or request along with the time.

By analyzing the shape of the graph, you can understand how stable the product is. The straighter the line and the more coaxial it is with the x-axis, the better. The edge points from such a graph should be discarded, because they are influenced by JMeter itself at the time of its startup and shutdown.
So, if sharp fluctuations are visible, then they indicate that the performance of the product may change from time to time. It is better to clarify whether the application is supposed to work this way.

The aggregated report is a summary table with static performance indicators for each unique sampler in the test plan.
One of the main indicators of this element, which distinguishes it from other reports of this type, is percentiles (Percentile/Line) – the time during which the corresponding proportion of requests receives a response:
Label — label for the request.
Number of requests (# Samples) — the number of requests with this tag.
Average – average time.
Median — time during which 50% of requests are guaranteed to be completed.
90%Line — the time during which 90% of requests are guaranteed to be completed (90th percentile).
95%Line — the time during which 95% of requests are guaranteed to be completed (95th percentile).
99%Line — the time during which 99% of requests are guaranteed to be completed (99th percentile).
Min — minimum request time.
Max — maximum request time.
Error % — percentage of requests with errors.
Performance (Throughput) — number of requests per second.
Received KB/sec.
Sent KB/sec.
Aggregate Report

This graph shows the ratio of the nth samplers to the response time.
No of Samples — total number of requests.
Latest Sample — response time of the last request.
Average — average response time to all requests.
Deviation — change in response time, the magnitude of the dispersion measurement, that is, the deviation of the data distribution.
Throughput — the number of requests processed by the server per minute.
Median — the time during which 50% of requests are guaranteed to be completed.
Graph Results

So on it you can see the total behavior of all questions over time: how errors grow in total for all questions, whether the average response time increases, whether the throughput changes, etc. without reference to a specific test.
That's all for JMeter graphs. If you wish, you can study them in more depth. All information is in documentation.
The next research point is system indicators. After all, JMeter will take indicators related to REST. But what happens in the application itself? How is the load distributed? How much does the CPU slow down? Is the maximum allowed number of connections to the database correctly specified? Working with metrics system indicators will help answer all these questions. If they are not there, then you can resort to launching various useful utilities (see above) while JMeter is running.
For example, this CPU graph shows a clear peak even though the load was linear. Why is that?
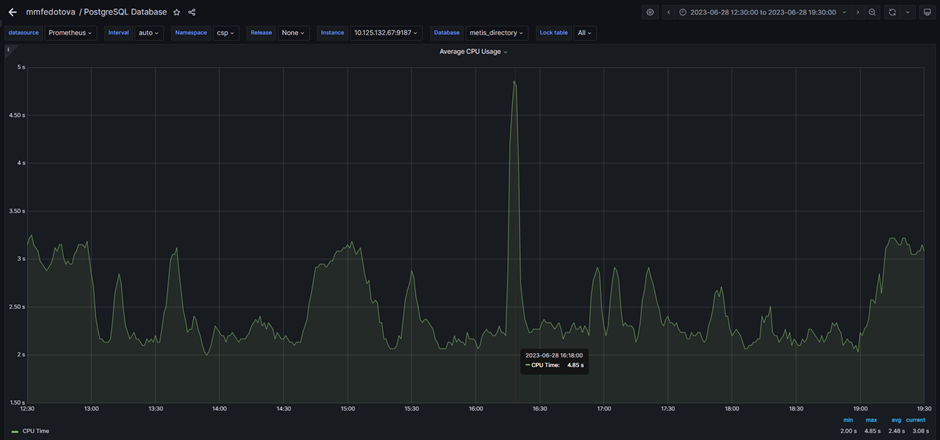
In order to understand this, you need to additionally look at the logs.
And here are some more suspicious peaks on the chart:

Understanding the cause also requires research.
I will not consider all these cases in detail, because each situation is individual. It is necessary to analyze the behavior of a system in a particular case separately or based on the experience of past load testing of the same system on the same benches.
I will only add that at times of load it is useful to run queries in pg_stat_activity. If queries are not optimized, then in pg_stat_activity you can see the following picture:
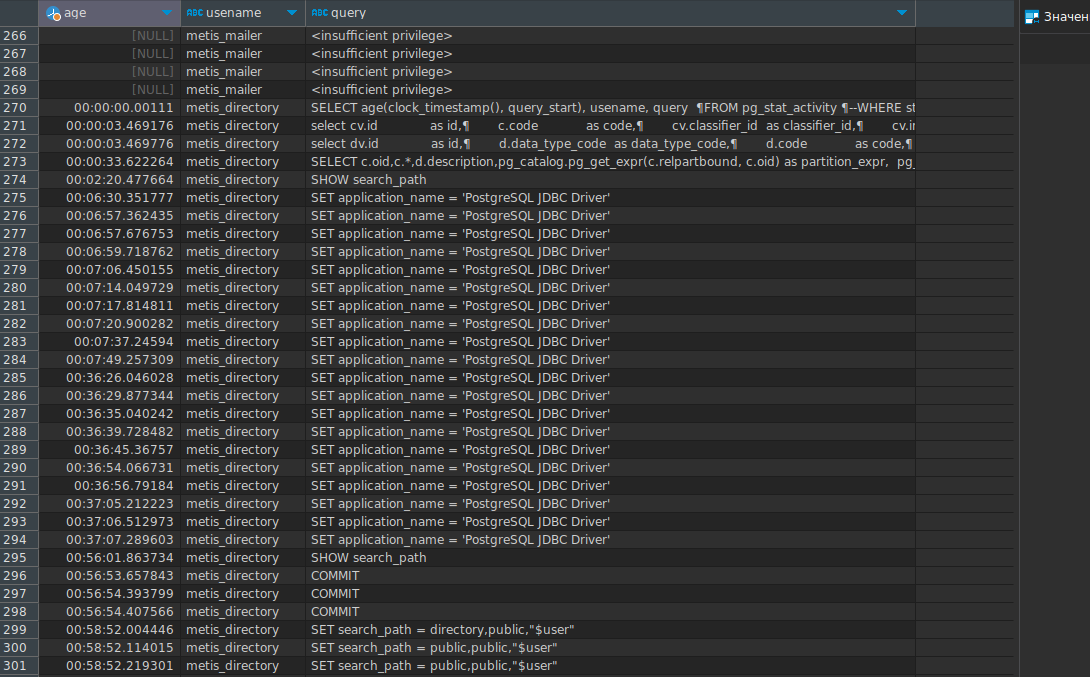
To get this data I run the following query:
SELECT age(clock_timestamp(), query_start), usename, state, query
FROM pg_stat_activity
WHERE state != 'idle'
ORDER BY query_start desc;
Or use the pg_activity utility:
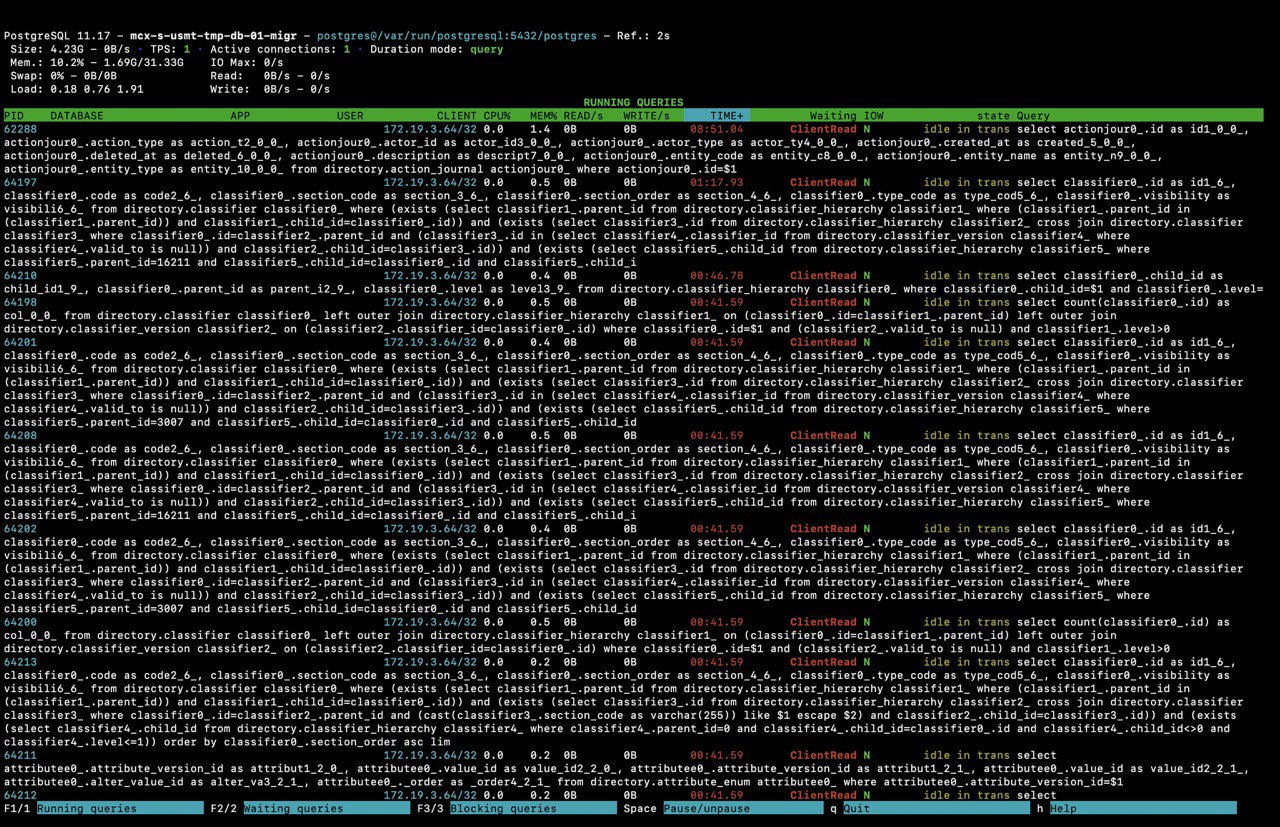
As you can see, a certain number of requests are executed too slowly – this is a bottleneck. It may cause problems in the future.
Let me summarize
In conclusion, I would like to say that load testing is a useful practice for any project. It can be carried out both at the development stage and at the time of delivery. You just have to remember that load testing is not just writing a few queries in JMeter and running them on the maximum possible number of users. This is a comprehensive study of the entire product, including many additional tools. After all, just getting the graphics is not enough, they need to be explained. Do not underestimate such research; in the future, it can save you from an accident.
Not all convenient features are collected here. There are many more of them. Try it, look for your own life hacks. Good luck!