A simple Python script for managing personal finances
Keeping track of your finances seems difficult. I will surprise you, but even such a problem has a simple and ingenious solution. To manage my personal finances, I wrote a script in Python. With it, you can monitor your budget by recording your income and expenses, and see what you spend money on every month.
Principle of operation
The script is written in the universal programming language Python. I used Pandas for data management and Matplotlib for visualization. The idea is this: you write down your income and expenses for the month, and the script calculates everything and shows an analysis of your finances.
Script in detail
Let’s take a closer look at the key components of the script:
1. Entering user data
def get_user_input():
    income = float(input("Enter your monthly income: "))
    expenses = {}
    while True:
        category = input("Enter expense category or 'done' to finish: ")
        if category.lower() == 'done':
            break
        amount = float(input(f"Enter amount for {category}: "))
        expenses[category] = amount
    return income, expenses
This feature prompts the user to enter their monthly income and expenses, broken down by category.
2. Calculations
def calculate_budget(income, expenses):
    total_expenses = sum(expenses.values())
    balance = income - total_expenses
    return total_expenses, balance
Here the script summarizes your expenses and calculates how much money you still have left.
3. Financial analysis
def display_budget_summary(income, total_expenses, balance):
    print("\nBudget Summary:")
    print(f"Total Income: ${income}")
    print(f"Total Expenses: ${total_expenses}")
    print(f"Remaining Balance: ${balance}")
Using this feature, you can print a financial analysis and see your income, expenses and balance.
4. Cost chart
def plot_expenses(expenses):
    df = pd.DataFrame(list(expenses.items()), columns=['Category', 'Amount'])
    df.plot(kind='bar', x='Category', y='Amount', legend=False)
    plt.ylabel('Amount ($)')
    plt.title('Expense Distribution')
    plt.show()
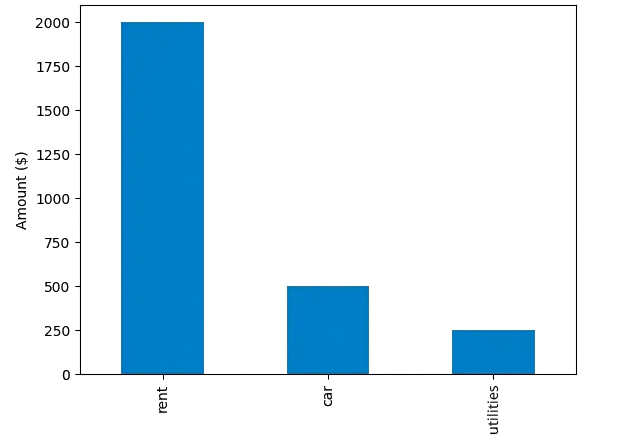
Using Pandas and Matplotlib, this function creates a chart that shows the breakdown of expenses by category.
Spending visualization
A visual representation is especially useful because it helps us immediately understand what we spent our money on. Here, for example, is what such a diagram might look like:
python3 budget.py
Enter your monthly income: 10000
Enter expense category or 'done' to finish: rent
Enter amount for rent: 2000
Enter expense category or 'done' to finish: car
Enter amount for car: 500
Enter expense category or 'done' to finish: utilities
Enter amount for utilities: 250
Enter expense category or 'done' to finish: done

Budget Summary:
Total Income: $10000.0
Total Expenses: $2750.0
Remaining Balance: $7250.0
How to use the script
Just run the script in the Python environment. It will ask you to enter your monthly income and all your expenses. Having received all the data, the script will show a financial analysis and a bar chart of expenses.
This Python script is a simple yet effective tool for users who would like to understand their own finances. By recording and visualizing your income and expenses, you can make better decisions about how to manage your money.
I am all for simplifying the analysis of personal finances. I suggest you try this script in action, customize it for yourself and share your ideas for improving it in the comments.

Upcoming Netology courses on Python programming:
Free classes and webinars:


