XCResult – how and why to read

In 2018, Apple for the next (third) time updated the format in which information about the test run is issued. If earlier it was a plist file, which was a large xml, now it is a large file with the xcresult extension, which opens through Xcode and contains a bunch of useful information, starting with test results with logs, screenshots and ending with target coverage, diagnostic information about assembly and much more. Most developers don’t work with this every day, but the infrastructure builders in this article might find something useful.
Let’s break down the pros and cons of updating the format
What are the disadvantages of updating the format?
– It weighs a lot, which means the exchange of such files with the CI server can be long.
– If there is no Xcode, then it will not open (it is doubtful that the tester or developer will not have Xcode, but still).
– Possible breakdown of existing integration tools. Learning to work with something new again.
How is the new xcresult convenient?
– Opens natively through Xcode.
– You can transfer to colleagues from QA and development, even if they do not have a local project. Everything will open and show the information you need.
– Contains comprehensive information about the test run.
– Can be read not only through Xcode.
We will talk about the last point in this article.
Why read XCResult outside of Xcode?
If your company has CI&CD processes set up, then you probably collect metrics on project builds, stability and number of tests, and, of course, test coverage data. Most likely, somewhere on Bamboo, Jenkins, Github, you have dropped tests or CI status, or coverage percentage. It is customary to automate such operations and leave them at the mercy of soulless machines. What tools do we have for this?
Apple, together with the release of the new format, released the xcresulttool and xccov tools, which you can work with from the terminal.
What can we get using xccov?
xcrun xccov view --report --json /path/to/your/TestScheme.xcresult
The request will return comprehensive information about what coverage all targets have, what methods and what classes are covered, how many times they were executed and what lines were executed. Objects have a similar structure. There are 4 levels in total: root, target, file, function. All levels except the root have a name field. All levels have coveredLines and lineCoverage fields. It is important to note that objects have their own context. The entire structure can be described in several protocols.

In addition to protocols, we highlight the following structures: CoverageReport – aggregator of everything and root. It contains an array of Target objects. Each Target contains an array of File, which, in turn, contains an array of Function. These objects will implement the protocols described above.
We are interested in the lineCoverage field. To draw up a beautiful report (like in fastlane), let’s turn to the lineCoverage field and go through all the objects with a simple function:

We get something similar to:
Coverage Report Summary:
• Utils.framework: 51,04 %
• NavigationAssistantKit.framework: 0,0 %
• NavigationKit.framework: 35,85 %
• Logger.framework: 20,32 %
• FTCCardData.framework: 78,21 %
• FTCFeeSDK.framework: 25,25 %
• ErrorPresenter.framework: 2,8 %
• MTUIKit.framework: 0,24 %
• AnalyticsKit.framework: 47,52 %
• EdaSDK.framework: 1,18 %
• Alerts.framework: 85,19 %
• Resources.framework: 39,16 %
• QpayApiTests.xctest: 88,37 %
• FTCFeeSDKTests.xctest: 97,91 %
PS In order for coverage to be collected, you need to add the -enableCodeCoverage YES parameter to your test team or enable it in the scheme settings in Xcode.
What opportunities will xcresulttool give?
In fact, xcresulttool does not have a very large interface, but you can get a lot of information from it if you know the structure of xcresult. And this is a whole database to which you can make queries.
For a start, it’s a good idea to familiarize yourself with the interface itself:
xcrun xcresulttool --help
OVERVIEW: Xcode Result Bundle Tool (version 16015)
USAGE: xcresulttool subcommand [options] ...
SUBCOMMANDS:
export Export File or Directory from Result Bundle
formatDescription Result Bundle Format Description
get Get Result Bundle Object
graph Print Result Bundle Object Graph
merge Merge Result Bundles
metadata Result Bundle Metadata
version XCResultKit Version
To read the structure, we just need to call the command:
xcrun xcresulttool get --path /path/to/your/res.xcresult --format json
This is where we get the “table of contents” for our xcresult bundle. What was going, what tests were run, how long it took, where are the screenshots and logs, and what were the compiler warnings. The main thing for us is to get the file identifiers that contain information about the tests.
xcrun xcresulttool get --path /path/to/your/res.xcresult --format json --id {id}
Then we will get objects with test targets, type of tests, which are divided into test classes and test suits with reports with logs, screenshots, execution time and other information for each test.
Unfortunately, the reason for the failure of the red tests will not be easy to pull out – for this you have to make another request for each failed test (and in fact, not even one! !
For Failure Summary, the same query is used:
xcrun xcresulttool get --path /path/to/your/res.xcresult --format json --id {id}
But for crash logs, you need to remove –format json from the request, because there is just a string and when passing the formatter, the tool will throw an error.
What to do with this background knowledge next?
Automate, of course! If you try these commands, you will see that the answers are gigantic and hard to read. How to automate? Ruby, Python … Or Swift?
Of course, swift. Any modern iOS developer knows it. The project opens in Xcode, debugging, syntax highlighting, strong typing are available. In short, a dream! Especially with the advent of Swift package manager.
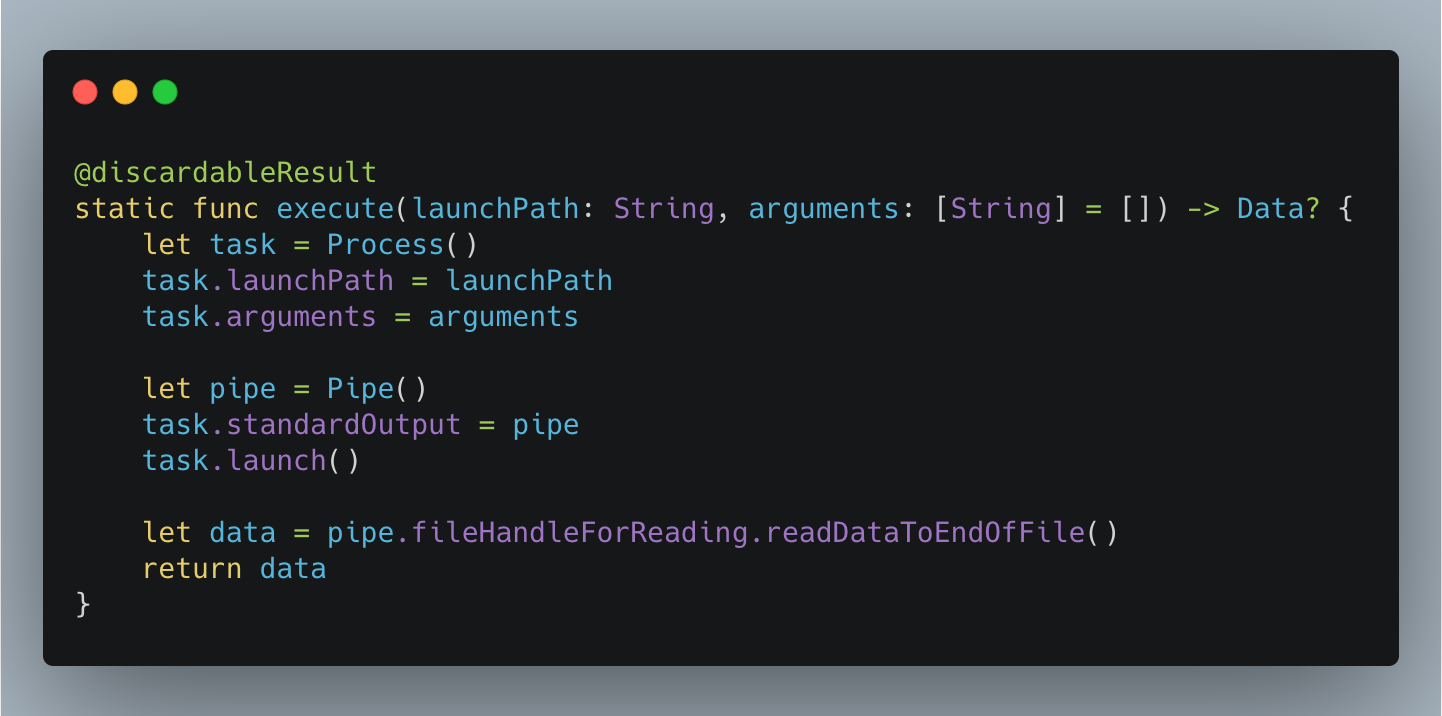
It’s no secret that with swift we can easily launch processes, listen for errors, and get output. In the simplest case, we can get by with the following construction:
We now only have to explore the XCResult format through the familiar xcrun xcov and xcrun xcresulttool. For example, to read test coverage, we use:

And to get the XCResult table of contents, we need to execute:

But how do we get our cherished CoverageReport and XCResult structures?
We get a string from Data, which the first Shell command will return to us and put the content here: quicktype.io…
The service will generate us something similar to the required swift structures. True, you won’t be able to use the result “as is”. We’ll have to study the structure of the answer more closely and throw out duplicates. Nevertheless, such work is not difficult. You can discard unnecessary parts, or you can do some research and highlight a few basic building blocks:

Based on this, describe the rest of the structures, for example:

or even such information about the computers on which the run was performed:

Well, how to use this?
There are two ways to use our scraper. The first is as executable, and this is where Apple’s swift-argument-parser library comes in handy. Before that, we had to write the processing of arguments ourselves, cover it with tests, and support it. Now this work has been taken over by a popular library, whose maintainers can be trusted.
There are two commands: get a test coverage report and generate a junit test report. You need to build the project and run the binary, passing the necessary arguments:

The second way is to use this project as a library. We have a large CI project that is responsible for assembling, testing and shipping our KoronaPay product. For example, based on the results of passing tests, we can extract all assertion failures and crashes in tests like this:

Or get red tests, analyze flasks and restart only them.
How to analyze? Everything is simple and not easy at the same time. To get the details of the reason for the test failure, you need to make an additional request to xcresult using the failure summary identifier. And then extract information from the failure summary. At the moment, we have learned how to look for crashes in tests and lost connection cases, as well as pull out the reasons. It is not difficult to understand that a crash has occurred. You just need to find the cherished words crashed in in failureSummaries.

It is a little more difficult to find out the cause of the crash.
Here, the reflection mechanism in swift comes in handy, which, although somewhat limited, is excellent for solving this problem. Find all Attachment objects named kXCTAttachmentLegacyDiagnosticReportData.

There is nothing magic about the reflectProperties method, this is a simple extension for Mirror:

Another category of red tests is asserts. Unlike crashes, you cannot simply search for the string “crashed in” here. Such tests can be disguised as lost connection cases. To get to the bottom of the reason, you have to walk through several arrays inside the TestCase object like this:

For such operations, our library has a TestsInspector entity that can provide a summary of red tests. Thus, the red tests are grouped by characteristics in the report.

Instead of a conclusion
Like all existing solutions in this area, our scrapper is not an exhaustive tool for analyzing xcresult. To get all the information and see screenshots, you still need to open xcresult through Xcode. However, if you have CI configured and you want to see test results quickly, then most likely you will be able to appreciate the combination of junit and our xcscrapper at its true worth.


so… what exactly is the “/path/to/your/res.xcresult” ? I cannot find an answer to that question! Xcode on a CI/CD agent (namely Azure DevOps) does not store it in the same way as on my Mac, where it is also stored in an inconvenient path. Using “-resultBundlePath” as an argument fails as soon as you run “build” and “test” in sequence with the error that the file already exists. Where is that little s}itbag of a file?