What’s new in JDK 17
JDK 17 was released on September 14th. This is the release Long-Term Support (LTS), which means it will be supported and updated for years to come. This is also the first LTS release to include production-ready version ZGC… Let’s refresh your memory: experimental the ZGC version was included in JDK 11 (previous LTS release) and the first production-ready the ZGC version appeared in JDK 15 (non-LTS release).
In JDK 17, the ZGC received 41 fixes and improvementsand I will focus on some of them. But before moving on to that, if you’re interested in learning more about the ZGC features / enhancements in previous JDK releases, read my past posts.
Now let’s take a look at what’s new in JDK 17 from a ZGC perspective.
Dynamic number of GC threads
The JVM has had an option for a long time -XX:+UseDynamicNumberOfGCThreads… It is enabled by default and tells the GC that it should be smart about the number of GC threads it uses for various operations. The number of threads used will be constantly re-estimated and therefore may change over time. This option is useful for several reasons. For example, it can be difficult to determine the optimal number of GC threads for a given workload. It usually goes like this – you try different settings -XX:ParallelGCThreads and / or -XX:ConcGCThreads (depending on which GC you are using) to see which one gives the best result. To complicate matters: the optimal number of GC threads can change over time as the application goes through different phases, so setting a fixed value in this case may not be optimal in nature.
Prior to JDK 17, ZGC ignored -XX:+UseDynamicNumberOfGCThreads and always used a fixed number of threads. During JVM startup, the ZGC used heuristics to decide what this fixed number should be (-XX:ConcGCThreads). After such a number was established, it did not change any more. Starting with JDK 17, the ZGC now takes into account -XX:+UseDynamicNumberOfGCThreads and tries to use as few threads as possible, but enough to keep garbage collection going as fast as it can. This avoids using more CPU time than the ZGC requires, which in turn makes it more accessible to Java threads.
Also note that when this feature is enabled, the parameter value -XX:ConcGCThreads changes from “Use so many threads” to “Use no more so many threads. ” -XX:ConcGCThreads… The ZGC heuristic will automatically select the optimal maximum number of threads for you, based on the size of the system in which you are working.
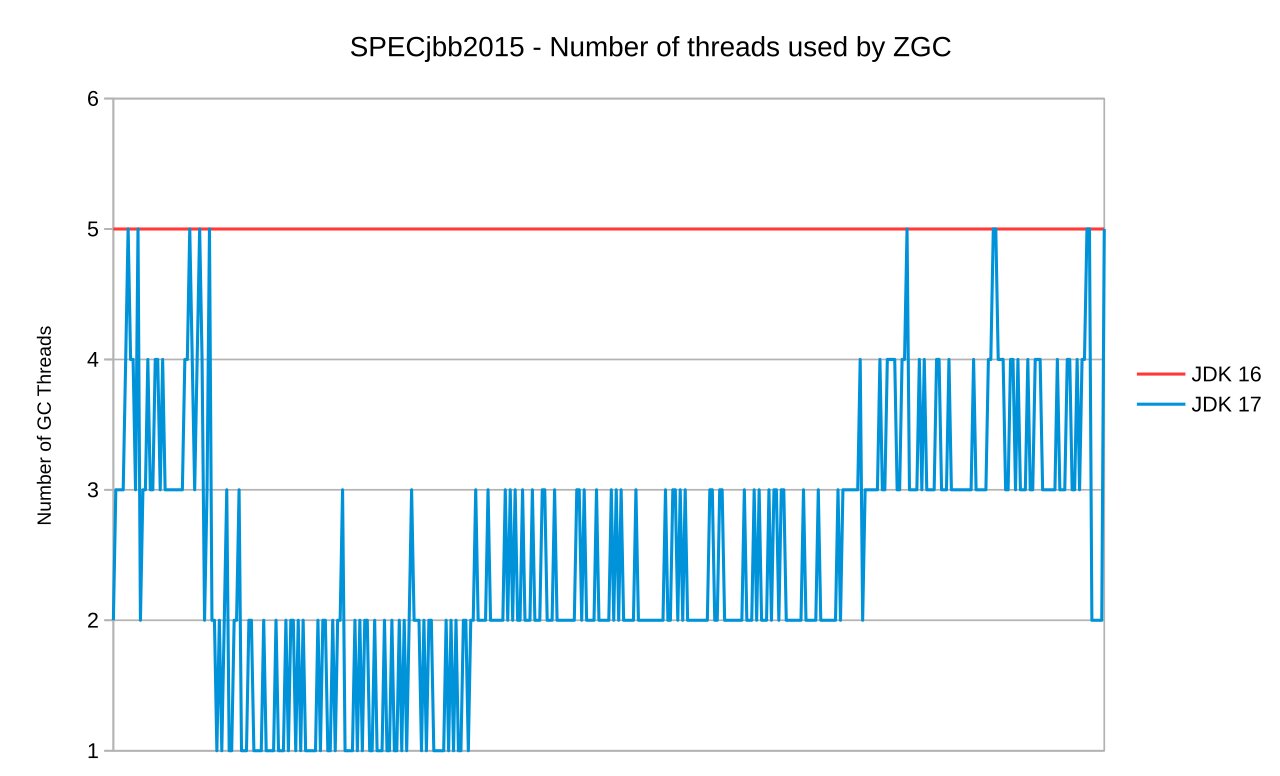
To illustrate this feature in action, let’s look at some graphs while running the SPECjbb2015 benchmark.
The first graph shows the number of GC threads in use over the entire runtime. SPECjbb2015 has an initial acceleration phase followed by a longer phase where the load (pumping rate) gradually increases. We can see that the number of threads used by the ZGC reflects the amount of work it needs to get done to keep up. Only in some cases it will need all (in this case 5) threads.
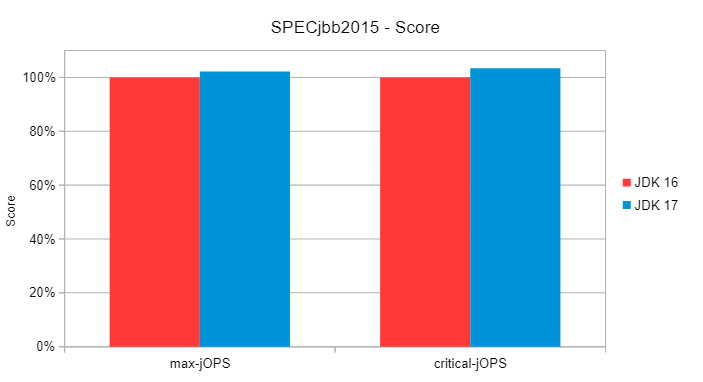
In the second graph, we see the benchmark results. Since ZGC no longer uses all GC threads all the time, we devote more CPU time to Java, resulting in better throughput (max-jOPS) and better latency
(critical-jOPS).
If for some reason you want to always use a fixed number of GC threads (as in JDK 16 and earlier), then you can disable this feature using -XX:-UseDynamicNumberOfGCThreads…
JVM shutdown quickly
When using ZGC, you may have noticed that termination of a running Java process (for example, by pressing Ctrl + C or by calling the System.exit () application) does not always happen instantly. Sometimes it can take a while (in the worst case, a lot of seconds) for the JVM to actually terminate. This can be annoying and problematic in environments where fast completion is essential.
Why does it sometimes take a while to complete when using the ZGC JVM? The reason is that the JVM shutdown sequence must be coordinated with the GC in order for the GC to stop doing its work and go into a “safe” state. The ZGC was in a “safe” state only when it was idle, i.e. did not collect trash. If a very long GC cycle was in progress by the time the terminate signal arrived, then the JVM shutdown sequence had to wait for that GC cycle to complete before the ZGC became inoperative and returned to a “safe” state.
This issue was addressed in JDK 17. The ZGC can now interrupt the current GC cycle to quickly transition to a “safe” state on demand. The shutdown of the JVM running ZGC is now almost instantaneous.
Reducing the memory usage of the marking stack
ZGC performs stripe marking… This means that the heap is split into stripes, and each GC thread is tasked with laying out objects in one of them. This helps to minimize the shared state between GC threads and make the marking process more cache friendly, since the two GC threads will not mark objects on the same part of the heap. This approach also naturally balances workload across GC threads, as lanes do roughly the same amount of work.
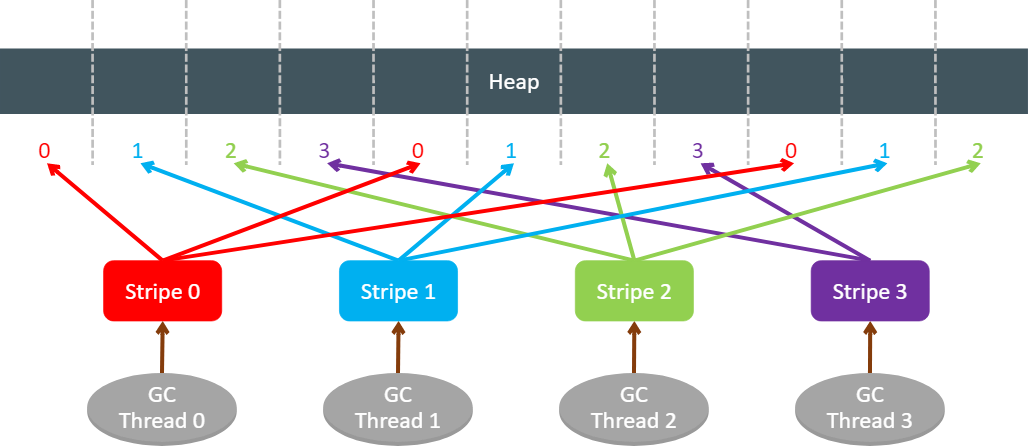
Prior to JDK 17, the ZGC markings strictly followed the striping. If a GC thread, while tracking an object graph, came across an object reference pointing to a portion of the heap that did not belong to its assigned lane, then that object reference was pushed onto the thread’s local label stack associated with that other lane. As soon as this stack was full (254 entries), it was passed to the GC thread, which was assigned to perform marking for this lane. A Java thread loading an object reference to a not yet mapped object does the same, except that it always pushes the object reference to its associated local label stack and never does any actual marking work.
This approach works well for most workloads, but there is also a pathological problem. If you have an object graph with one or more N: 1 links, where N is a very large number, then you run the risk of using a lot of memory (for example, many gigabytes) for label stacks. We’ve always known that this is a potential problem and we can write a small synthetic test to provoke it, but in reality, we never had to deal with a real load that would reveal it. This was until the OpenJDK developers at Tencent reported that they faced this problem in practice. So it’s time to do something about it.
The fix for this issue in JDK 17 is to relax strict stripe (banding) as follows:
-
For GC threads, no matter which lane the object reference points to, they first try to mark the object (i.e. potentially go outside the assigned GC thread’s bandwidth), and if it hasn’t been marked yet, move the object reference onto the associated stack tags.
-
For Java streams, first check if the object has already been marked, and if it hasn’t already been marked, move the object reference onto the associated label stack.
These tweaks help stop the overuse of the label stack memory in the pathological N: 1 case where GC threads come across the same object reference over and over again, pushing multiple duplicates of them onto the label stack. Such copies are useless because the object only needs to be marked once. If you mark an object before moving it and only move previously unmarked objects, duplicate production stops.
We were somewhat hesitant at first, as GC threads now perform atomic compare and replace operations to mark objects in memory that belong to stripes that other GC threads should work on. This breaks strict striping, making it less caching friendly. Java streams now also perform atomic loads to see if objects are tagged, which they did not do before. At the same time, other actions performed by GC threads (scanning / tracking object fields and monitoring the number of active objects / bytes in each area of the heap) still adhere to strict stripping. In the end, benchmarking showed that our initial fears were unfounded. GC mark execution time did not increase, and the impact on Java threads was not noticeable either. On the other hand, we now have a more robust layout scheme that is not prone to overuse of memory.
MacOS on ARM support
Apple recently announced a long-term plan to move its Mac lineup from x86 to ARM. Shortly thereafter, in the doc JEP 391: macOS / AArch64 Port it was suggested to port the JDK to this new platform. The JVM codebase is reasonably modular, with OS and CPU specific code isolated from the general platform independent code. The JDK already supported macOS / x86 and Linux / Aarch64, so the core components needed to support macOS / Aarch64 are there. Of course, everyone who plans to ship and maintain a JDK build for macOS / Aarch64 still has work to do: investing in new hardware, integrating the new platform into CI pipelines, etc.
With the ZGC, the situation is much the same. Both macOS / x86 and Linux / Aarch64 were already supported, so it was mainly about including building and testing this new OS / CPU combination. Starting with JDK 17, ZGC runs on the following platforms (see. table for more details):
Linux / x64
Linux / AArch64
macOS / x64
macOS / AArch64
Windows / x64
Windows / AArch64
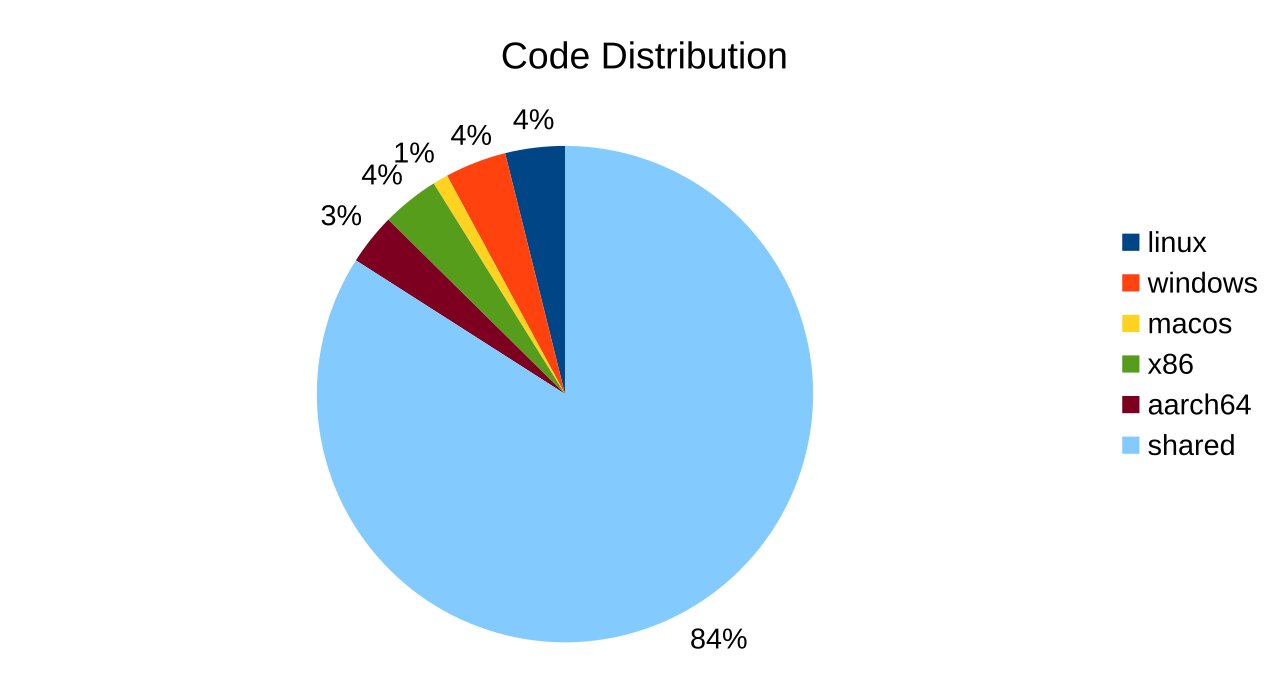
Much of the ZGC codebase continues to be platform independent. The current distribution of the code looks like this:
GarbageCollectorMXBeans for Loops and Pauses
GarbageCollectorMXBean provides information about the GC. With this bean, the application can retrieve summary information (number of GCs done so far, total time spent on GC, etc.) and listen for notifications GarbageCollectionNotificationInfo for detailed information about individual GCs (GC reason, start time, end time, etc.).
Prior to JDK 17, ZGC published a single bean called ZGC. He provided information on cycles ZGC. The cycle includes all GC phases from start to finish. Most of the phases are simultaneous, but some of them are Stop-The-World pauses. While the loop information is helpful, it might still be interesting to know how much time spent on GC was spent on Stop-The-World pauses. This statistic was not available for any ZGC bean. To solve this problem, ZGC now creates two bins, one called ZGC Cycles and the other called ZGC Pauses. As the names suggest, the information provided by each of them is related to cycles and pauses, respectively.
Here is a small example to illustrate the difference between JDK 16 and 17. The example first makes 100 calls System.gc(), and then a summary of the available information is retrieved. GarbageCollectorMXBean(s).
import java.lang.management.ManagementFactory;

public class ExampleGarbageCollectorMXBean {
    public static void main(String[] args) {
        // Run 100 GCs
        for (int i = 0; i < 100; i++) {
            System.gc();
        }

        // Print basic information from available beans
        for (final var bean : ManagementFactory.getGarbageCollectorMXBeans()) {
            System.out.println(bean.getName());
            System.out.println("   Count: " + bean.getCollectionCount());
            System.out.println("   Total Time: " + bean.getCollectionTime() + "ms");
            System.out.println("   Average Time: " + (bean.getCollectionTime() / (double)bean.getCollectionCount()) + "ms");
        }
    }
}
Running this program with JDK 16 produces the following output:
$ java -XX:+UseZGC ExampleGarbageCollectorMXBean
ZGC
          Count: 100
     Total Time: 424ms
   Average Time: 4.24ms
And running this with JDK 17 gives the following output:
$ java -XX:+UseZGC ExampleGarbageCollectorMXBean
ZGC Cycles
          Count: 100
     Total Time: 412ms
   Average Time: 4.12ms
ZGC Pauses
          Count: 300
     Total Time: 2ms
   Average Time: 0.006666666666666667ms
In both cases, we can see that the GC completed 100 cycles and each cycle took ~ 4ms on average. In JDK 17, we also see that there were 3 Stop-the-World pauses in each cycle, and each pause lasted ~ 0.007ms (~ 7 μs) on average.
Summary
-
JVM option
-XX:+UseDynamicNumberOfGCThreadsis now supported. This feature is enabled by default and instructs the ZGC to be smart about the number of GC threads in use, which usually results in higher throughput and lower latency at the Java application layer. -
Shutting down the JVM running the ZGC is now almost instantaneous.
-
The tagging algorithm now generally uses less memory and is no longer prone to over-consuming it.
-
ZGC now works on macOS / Aarch64.
-
The ZGC currently publishes two files
GarbageCollectorMXBeansto provide information on both GC cycles and GC pauses.
More information on the ZGC can be found at OpenJDK Wiki, in the GC section on Inside Java or in this blog…
The material was prepared within the framework of the specialization “Java Developer”