What the charts talk about: what is technical analysis, and why exchange investors use it
There are various ways to analyze assets that are traded on an exchange. For example, in the case of companies and their stocks, there is fundamental analysis that allows investors to understand the validity of the current business valuation and its prospects. Another method is technical analysis, which consists in studying historical data, including changes in the price and trading volume of a financial instrument.
Investopedia Portal tells about what technical analysis is, how much you can trust it, and how modern investors use this tool. We present to your attention the main thoughts of this material.
Note: indicators are just one of the auxiliary tools for working with exchange-traded assets, they do not guarantee positive trading results. In order to understand the use of indicators, you need a trading terminal (for example, SMARTx), as well as a brokerage account – you can open it online. You can practice using test account with virtual money…
Technical Analysis: A Brief History
The concept of technical analysis of stocks and trends has been around for hundreds of years. In Europe, merchant Joseph de la Vega used the practice of technical analysis to predict the behavior of markets in Holland in the 17th century.

In its modern form, technical analysis was formed by Charles Dow, William P. Hamilton, Robert Rhea, author Dow theory) and other financiers, including lay people like Nicolas Darvas.
These people imagined a market consisting of waves that correspond on the charts to the highs and lows of the value and trading volume of a particular asset. All concepts of technical analysis were brought together and summarized by Robert D. Edwards and John Magee in their 1948 book Technical Analysis of Stock Market Trends.
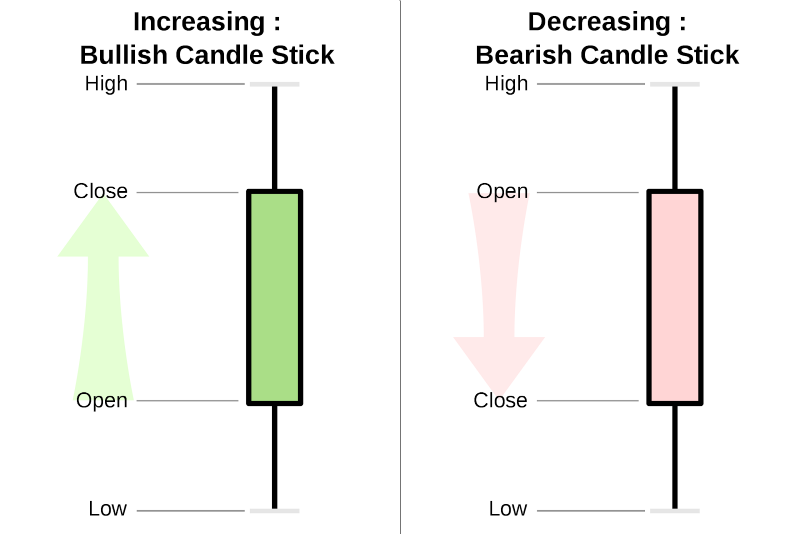
In the 1990s, a technique based on the analysis of Japanese candlesticks gained popularity in the United States – this method was used hundreds of years ago by Japanese merchants to determine trends in the rice trade. Investors analyzed stock charts in an effort to see new patterns of price movements that are possible in the future, to predict market reversals.
What is technical analysis for?
Technical analysis in its essence is an attempt to predict future price movements in order to play on them and earn money. Traders look for signs on the charts of stocks and other financial instruments that may indicate the emergence of trends or, conversely, their end.
In general, the term technical analysis combines dozens of strategies for interpreting price movements. Most of them are built around determining if the current trend is close to completion, and if not, when to expect a reversal.
Some technical analysis indicators use trend lines, others use Japanese candlesticks, and there are some where a trader analyzes mathematical visualizations. A specific pattern on the chart can represent the desired entry or exit point for a trade.
The two main types of technical analysis are searching for patterns on charts or using technical, statistical indicators. In this article, we looked at some of the popular technical analysis indicators.
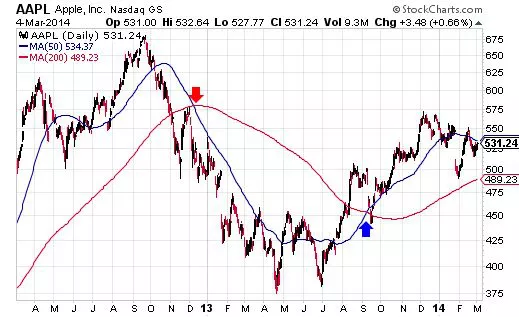
Indicator “moving averages” with marked entry and exit points
The key principle of this type of analysis is that price reflects all existing information that affects the market. This means that it makes no sense to analyze all factors such as business fundamentals, the general situation in the economy, or the emergence of new developments on the market in certain niches. There is a price, it already speaks about everything, but prices move cyclically.
Differences in the approach of supporters of technical and fundamental analysis are significant. While the former believe in the wisdom of the market, which forms trends through the price, the latter believe that the market often underestimates the really important factors. Fundamentalists believe that chart patterns are less important than the accounting figures of a business whose stock is being analyzed by an investor.
Limitations of technical analysis
The main disadvantage of technical analysis is that any decisions here are made based on the interpretation of the chart. A trader can make a mistake in interpretation, or the trading volume turns out to be insignificant for the formation of a correct hypothesis, time periods for indicators such as moving averages can be too large or too small, etc.
And one more important factor: the more popular technical analysis and its specific techniques and indicators become, the more difficult it becomes to understand whether the price itself has formed a certain pattern on the chart, or thousands of investors see the same picture, believe that the market will fall and start selling. intensifying his fall?
In any case, technical analysis is one of the ways to analyze the market. Inexperienced investors shouldn’t rely on it alone. It is better to study the approaches of technical analysis and the existing indicators available in the trading terminal using test account with virtual money…
Read reviews, market analytics and investment ideas in Telegram channel ITI Capital
Useful links on investment and exchange trading:
- Open a brokerage account online
- Test account with virtual money
- Stock trading software: trading terminal, mobile applications
- Structural Products
- Model portfolios