VMware, Hyper-V, OpenStack, Kubernetes, Swarm – monitoring from a single interface in Quest Foglight
There are a lot of tools for monitoring virtualization platforms. Especially in this market, the positions of vendor solutions are strong – vRealize and SCOM with respect to related VMware and Hyper-V platforms, respectively. The third popular virtualization platform is OpenStack. There is no vendor solution for monitoring this platform, but there are third-party solutions. From popular – open source solutions. In this article I will talk about a complete solution for monitoring the above platforms (and not only) – Quest Foglight. Under the cut a lot of pictures and little text.
Foglight is a universal monitoring platform on which you can place independently developed monitoring modules or use existing ones. Last time on Habré we talked about monitoring popular databases, about approaches to quickly identifying and fixing problems in SQL Server databases and useful interfaces for monitoring the performance of various databases.
VMware
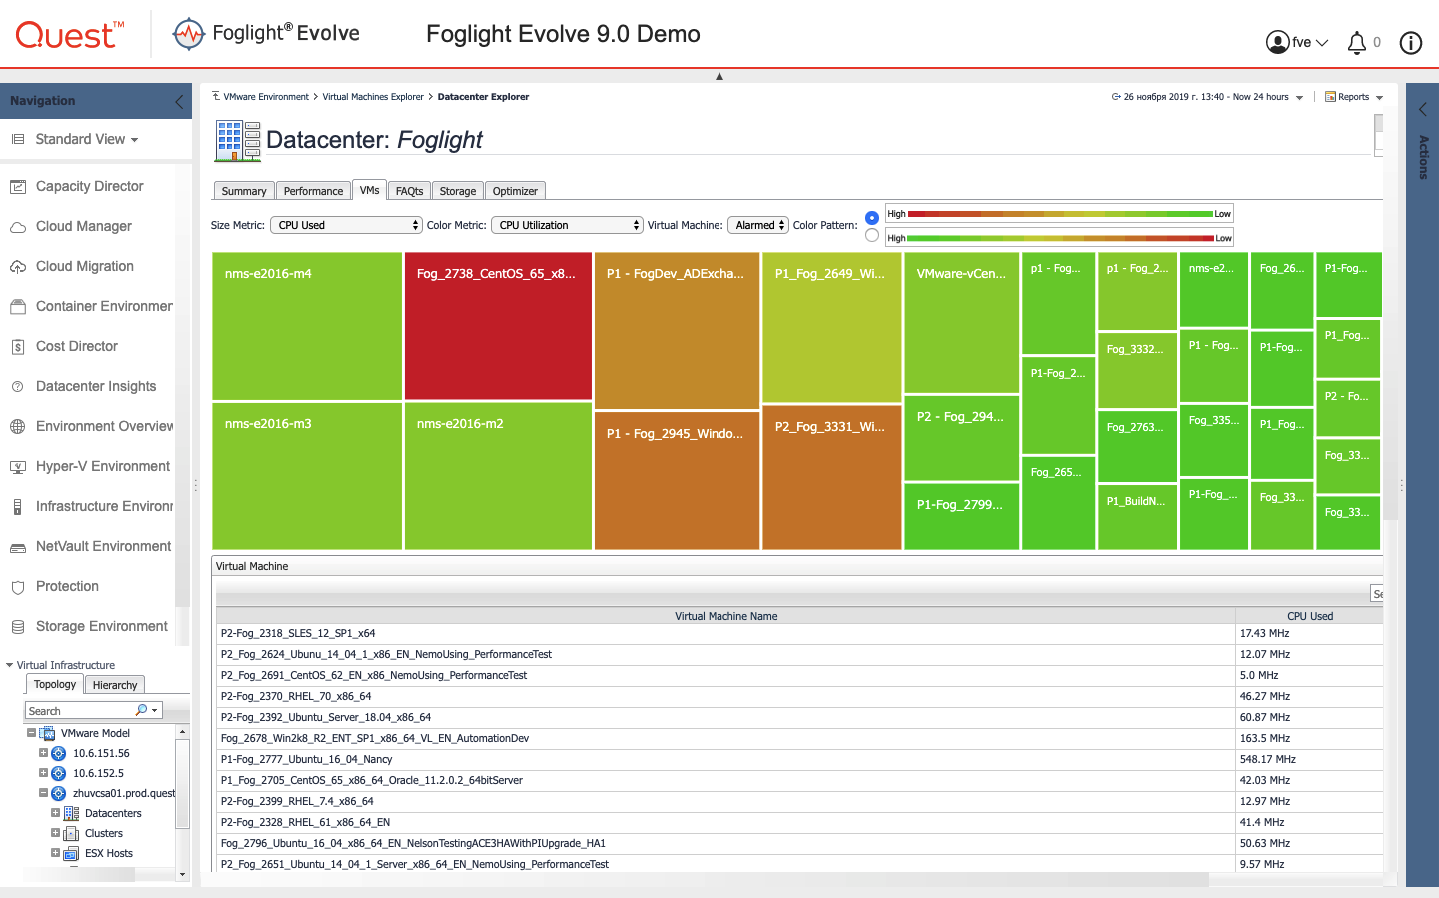
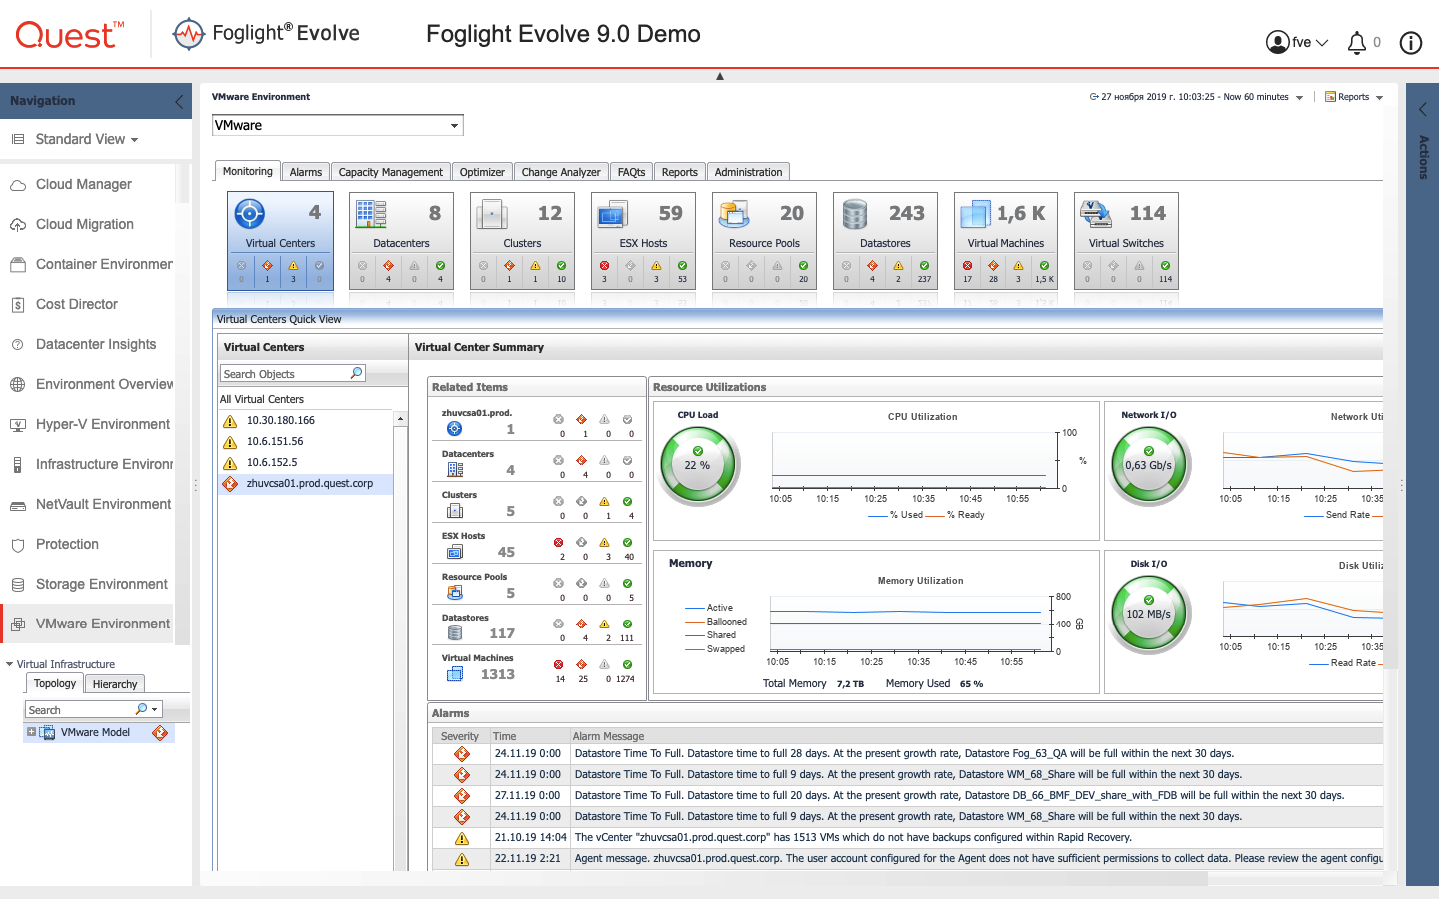
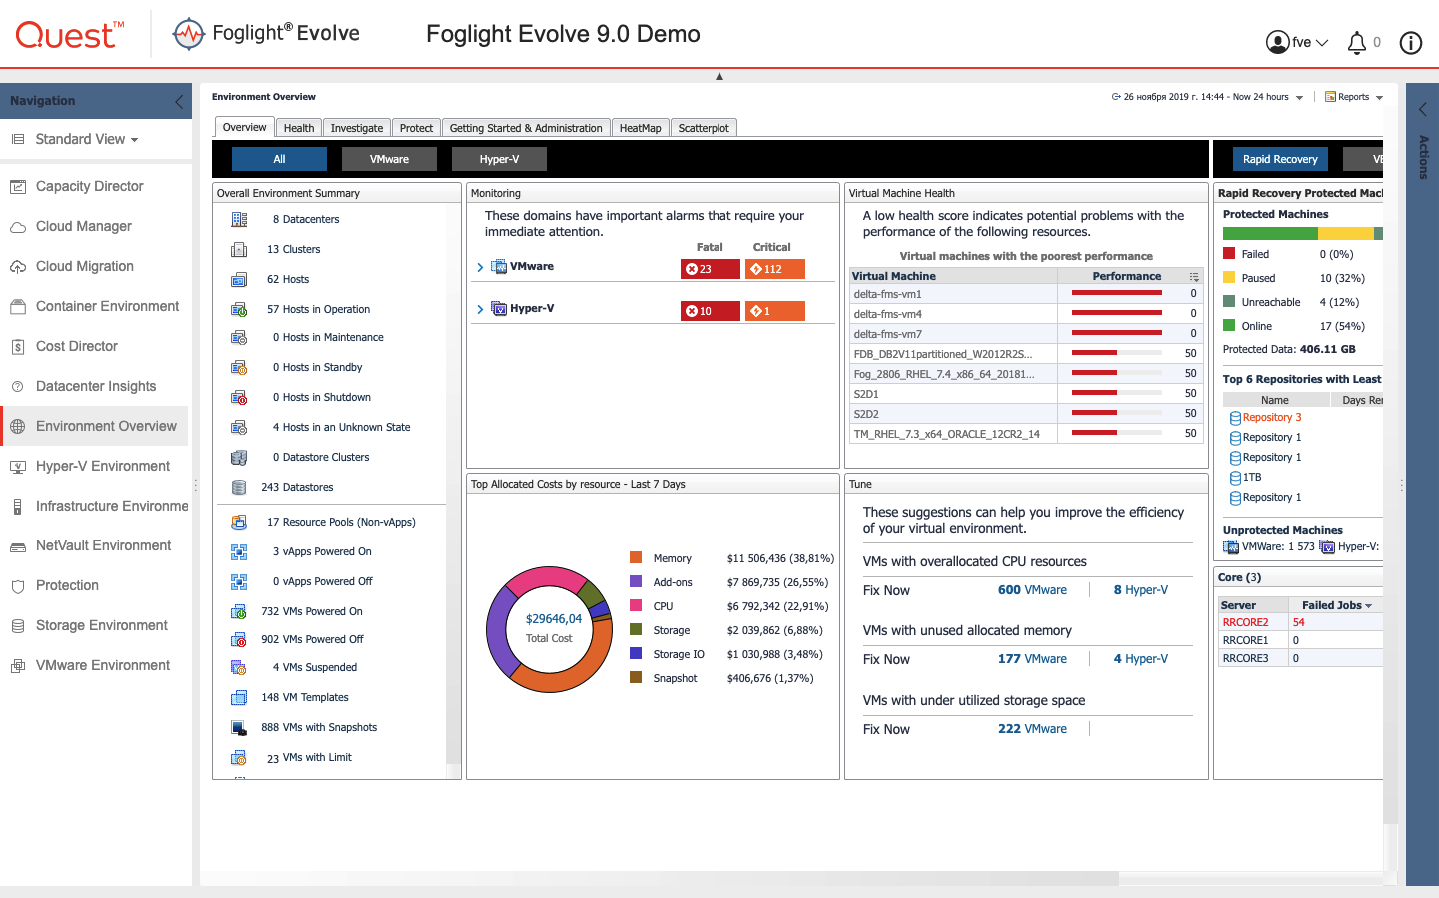
VMware monitoring is done through vcenter, all available data is collected. In the main view, it is convenient to switch between the entities of the virtualization infrastructure: clusters, data centers, ESX hosts, virtual machines, etc.
For example, in this view of the virtualization host health metric. There are similar ones in clusters, data centers and other entities.
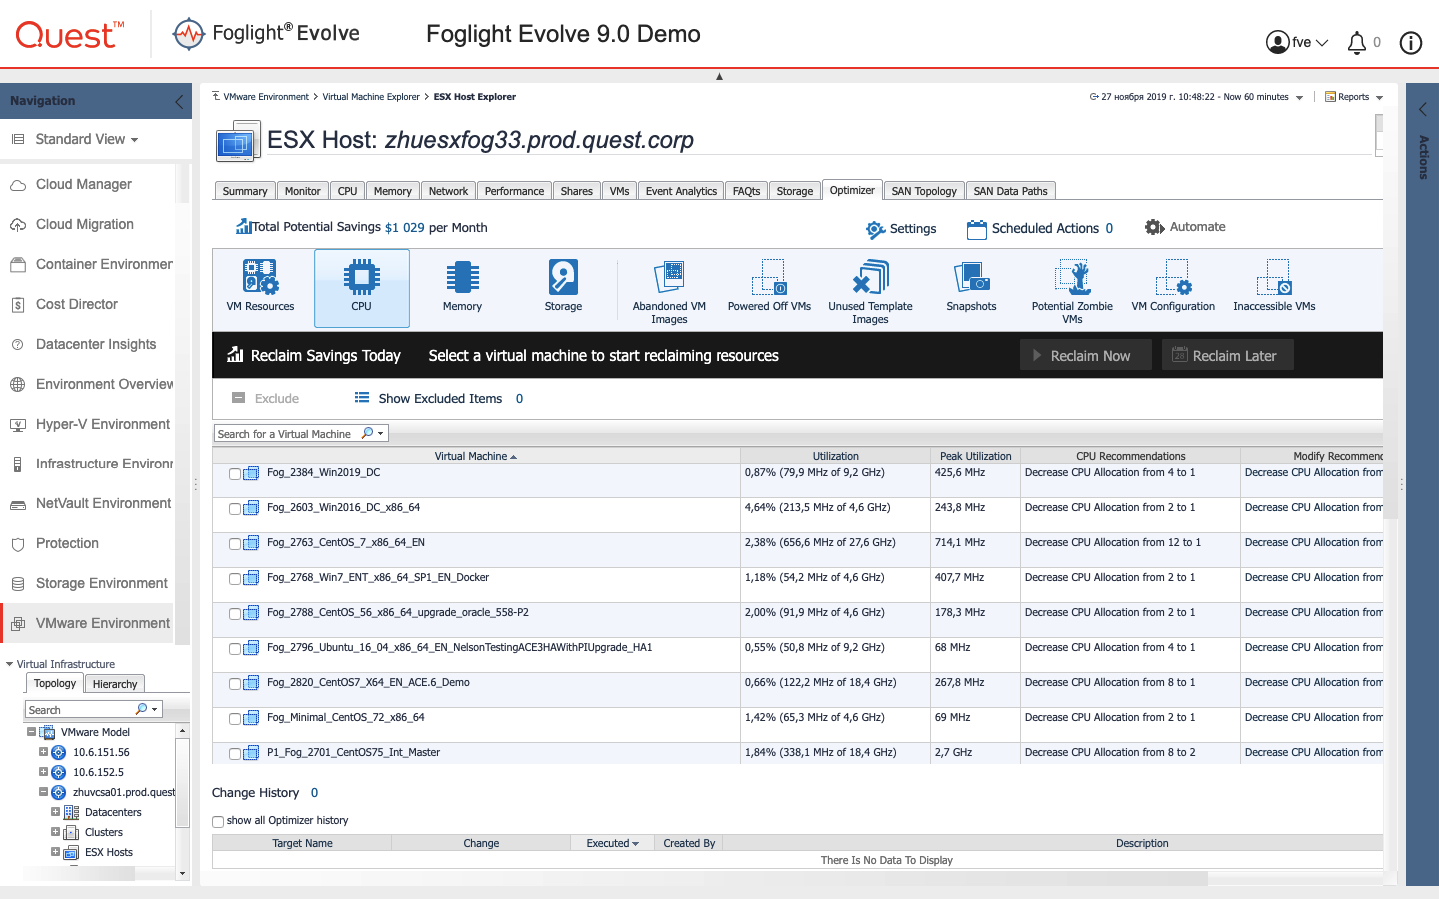
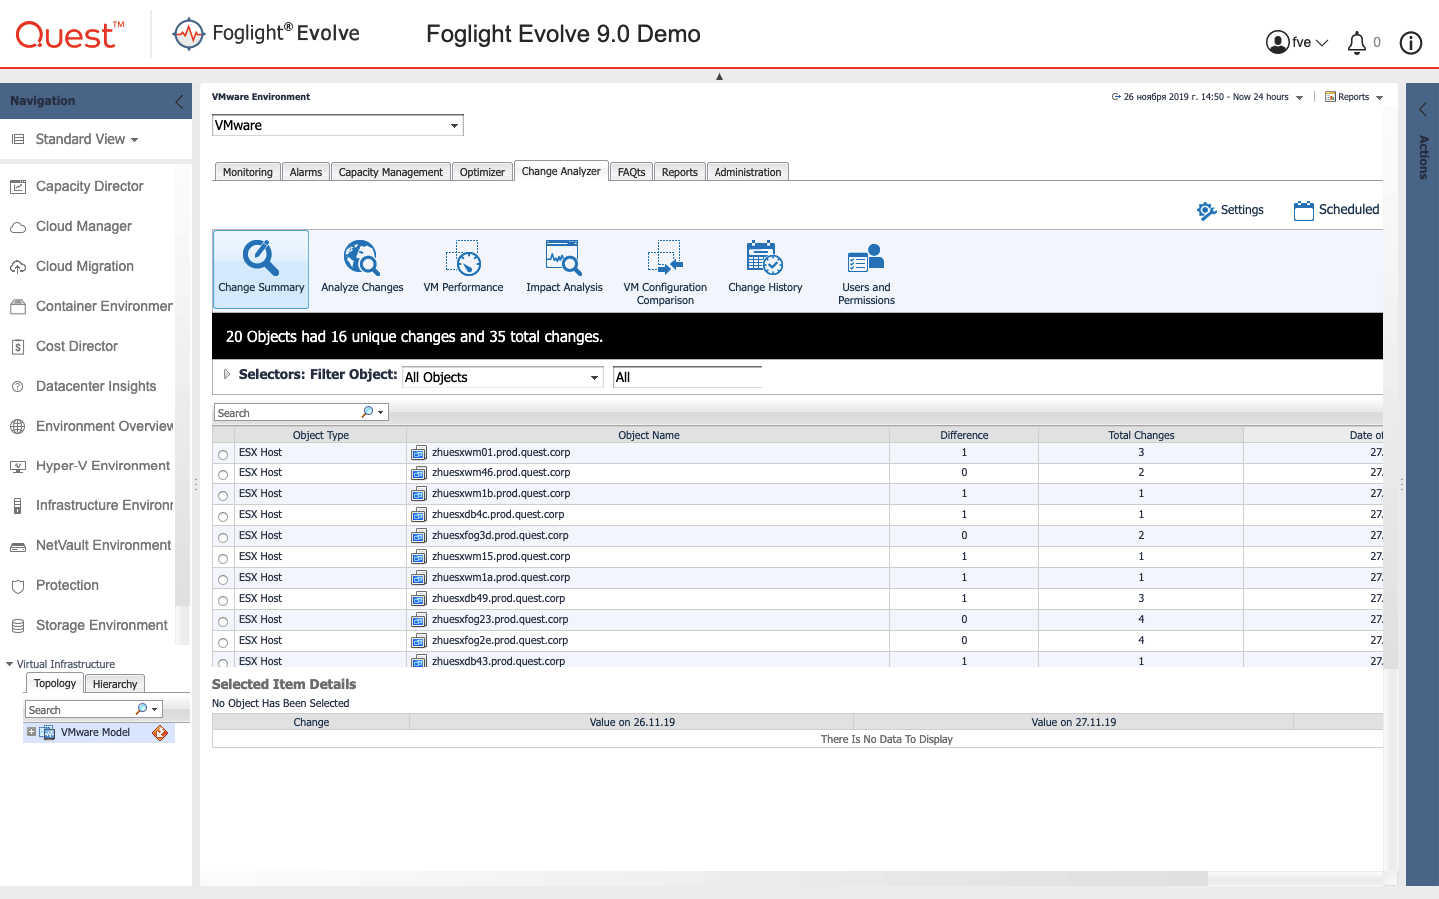
In the same interfaces, opportunities for optimizing the virtual infrastructure are available. You can identify underloaded, overloaded or zombie machines, view stored images, templates, snapshots and delete unnecessary ones. In addition, it is possible to adjust the power allocated to virtual machines (change the allocated values of memory, cores or disk size). From here, you can automate these processes.
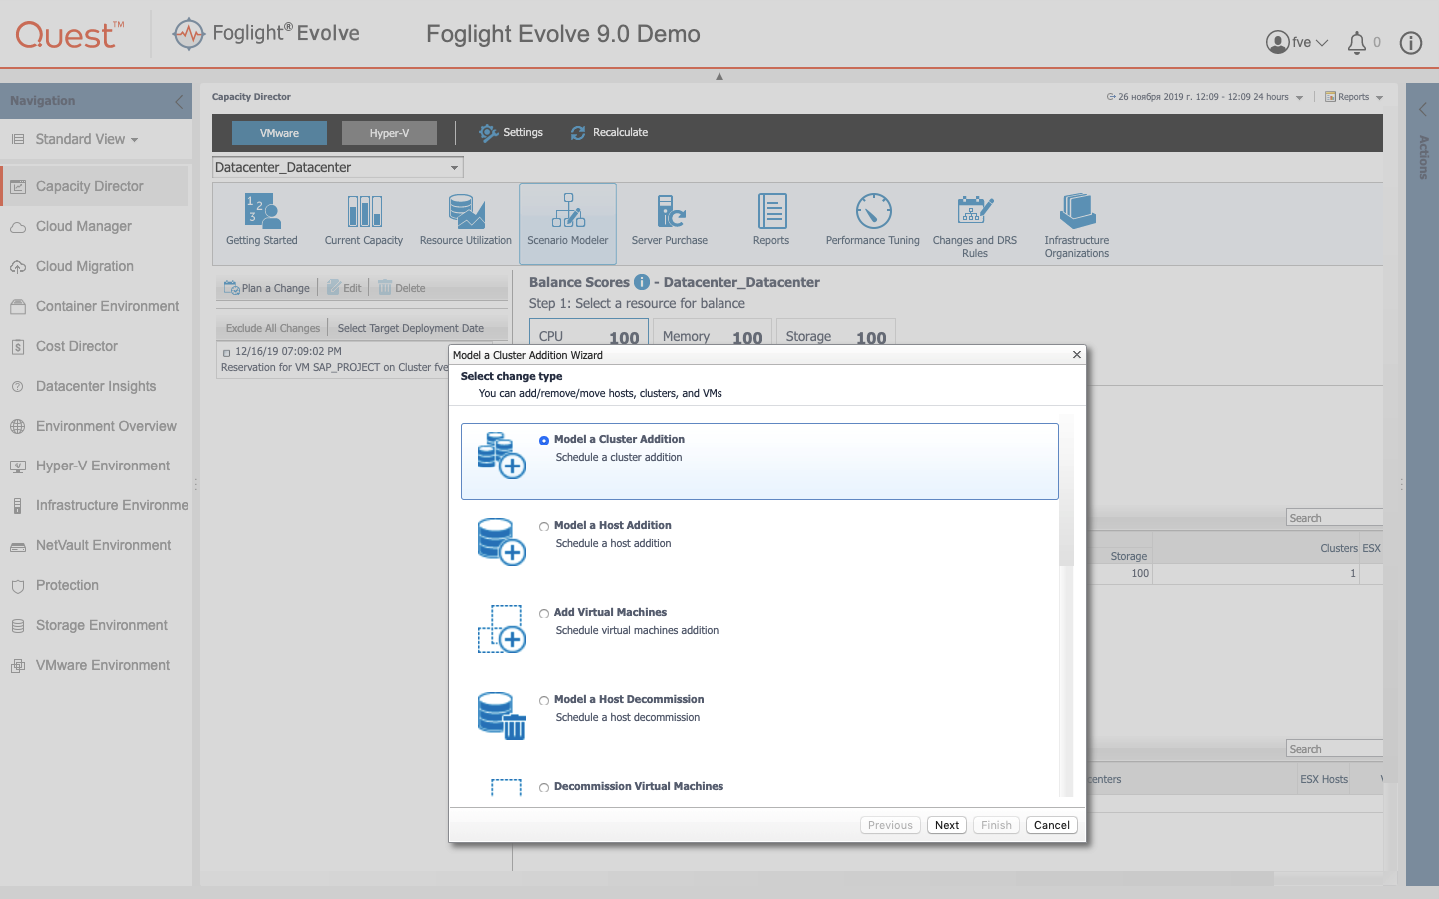
From a general view on the state of VMware, you can also model changes in the configuration of the virtual infrastructure (virtual machine migration, addition, etc.) and see how this will affect the performance of the cluster as a whole.
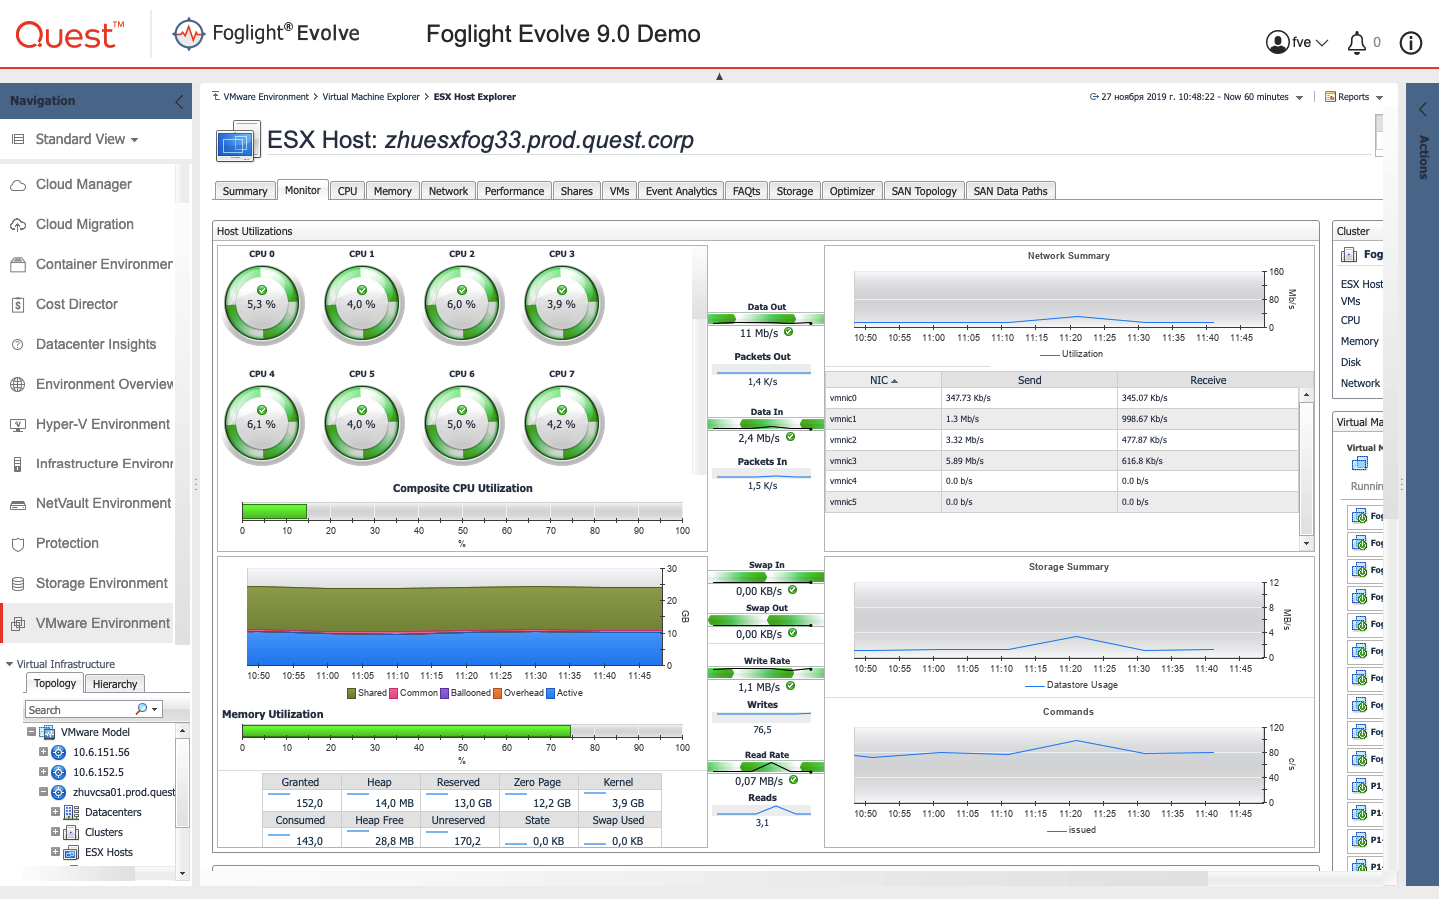
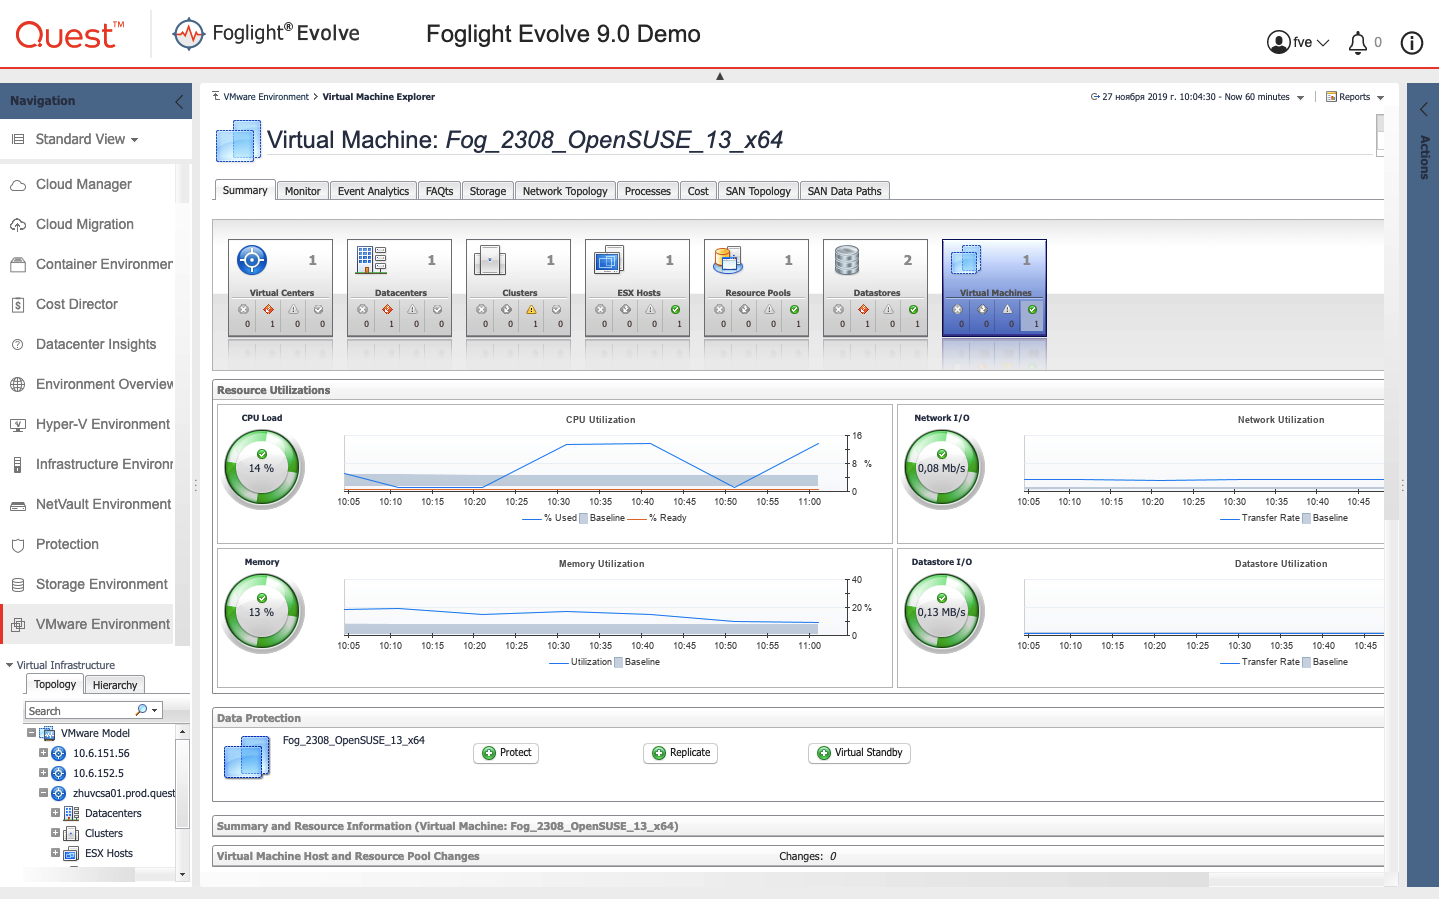
Let's move on to the level of the virtual machine. For each virtual machine, of course, a complete list of performance metrics is available.
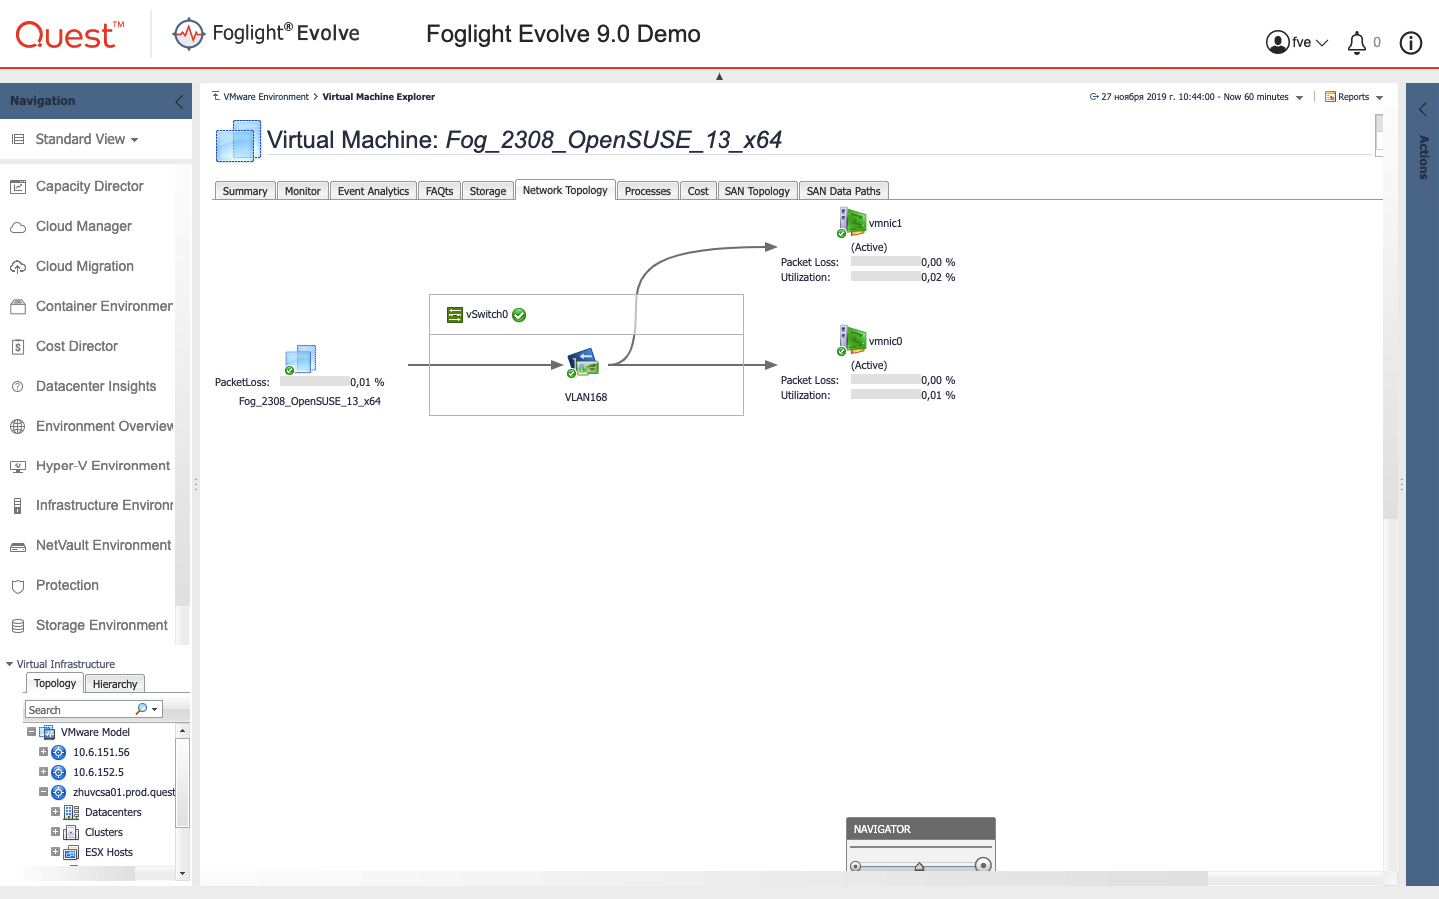
On a virtual machine, you can see the network topology.
Storage Topology
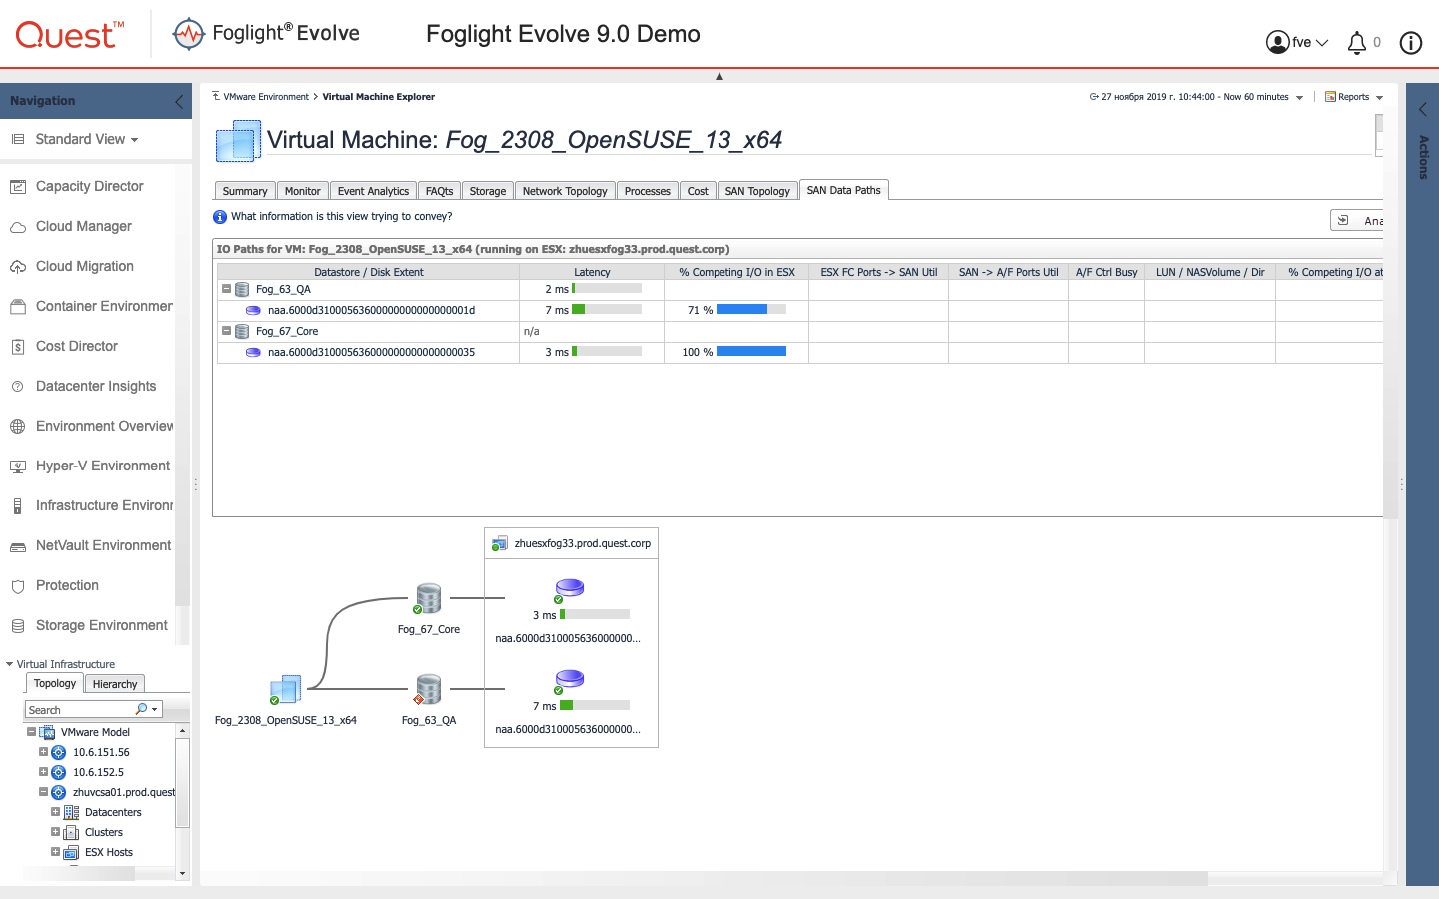
And see the performance of individual repositories.
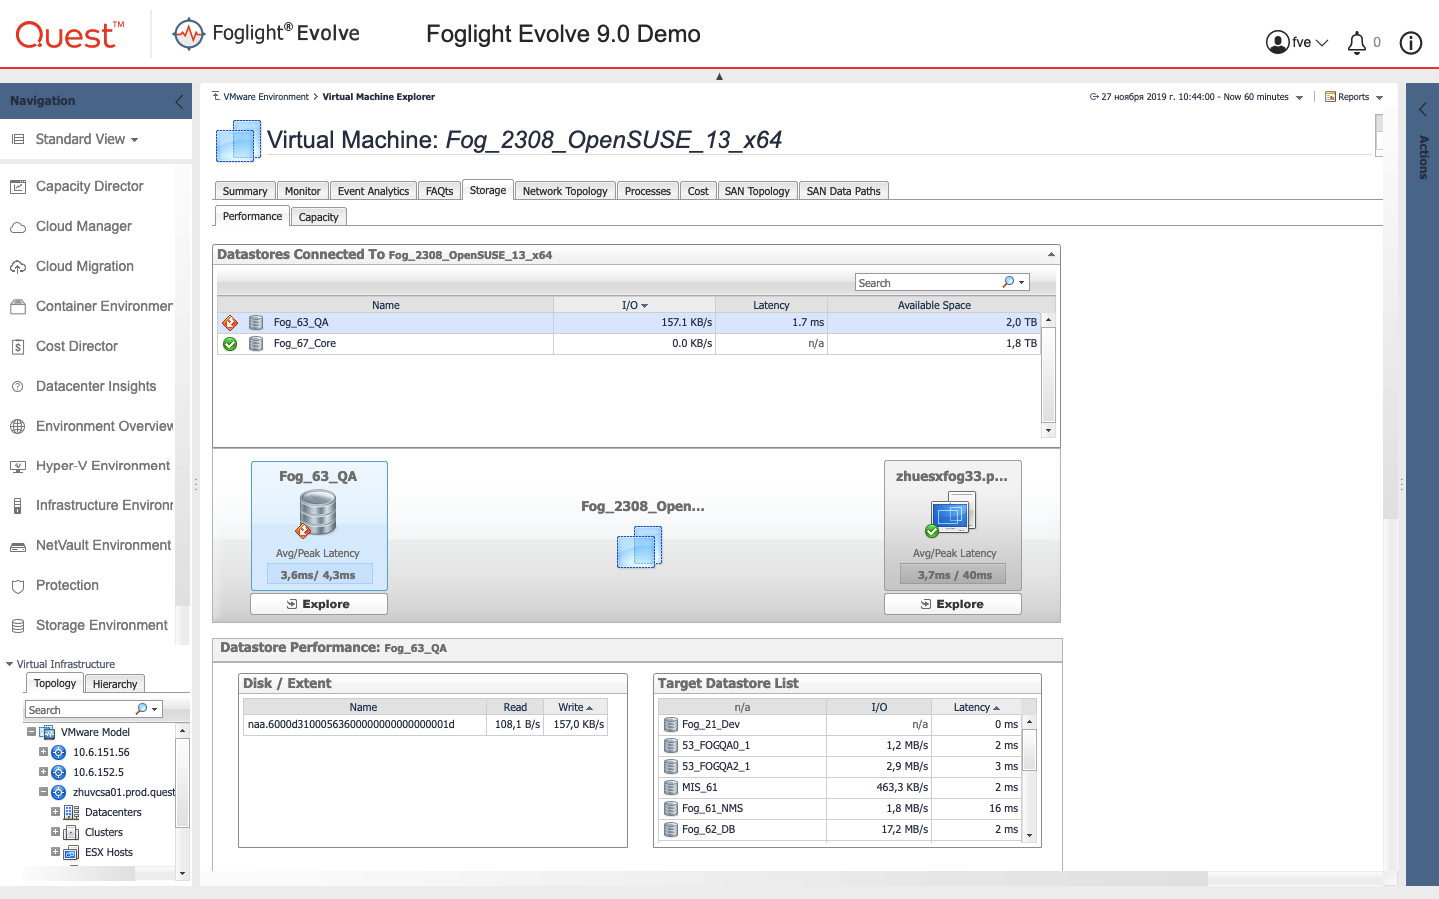
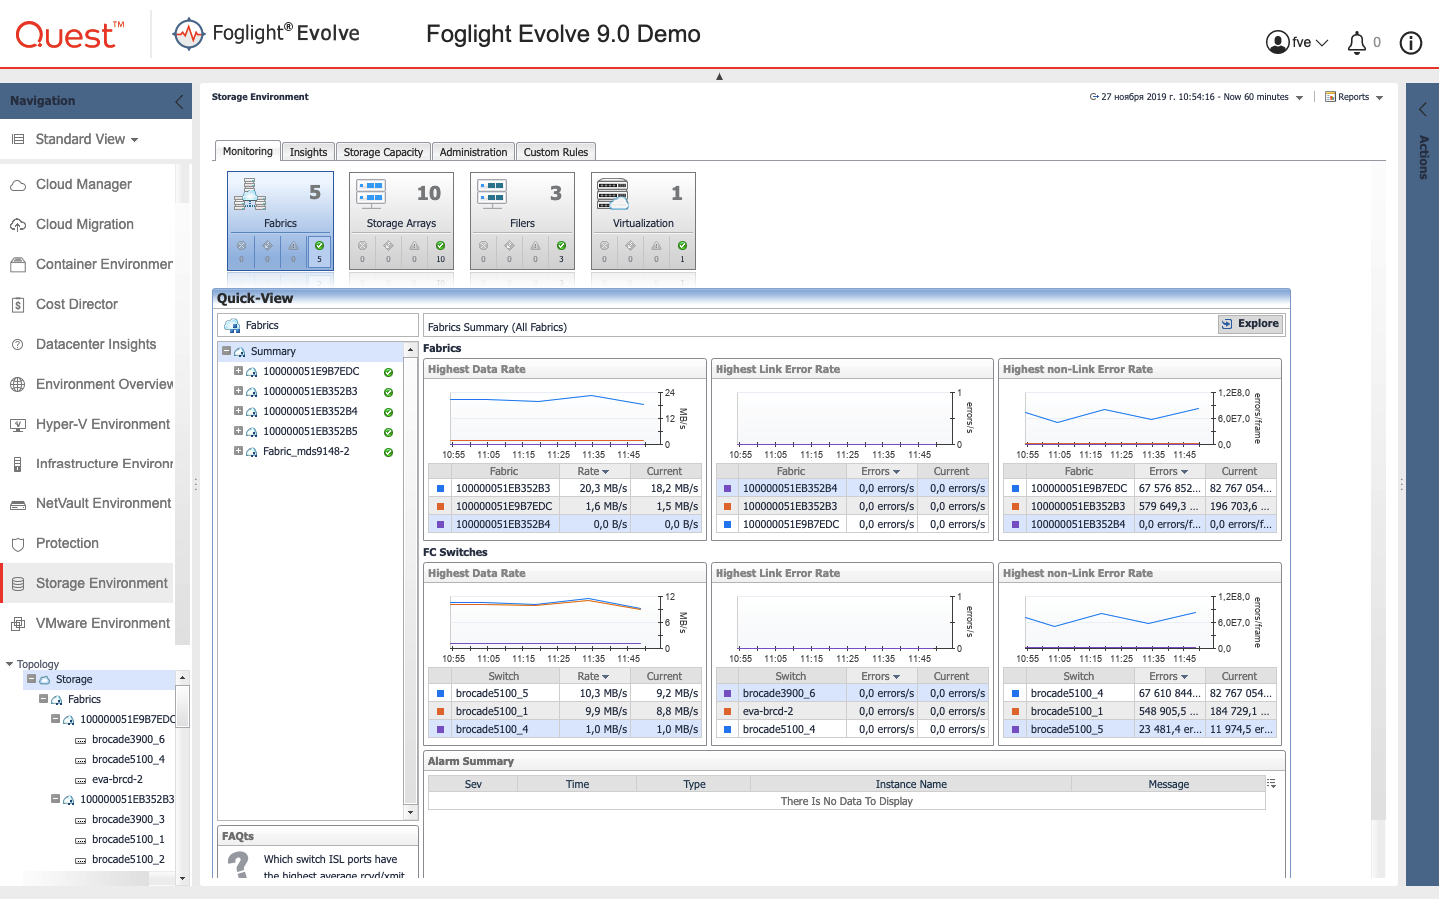
On disk arrays, there are also separate views. Views are switched through the menu on the left.
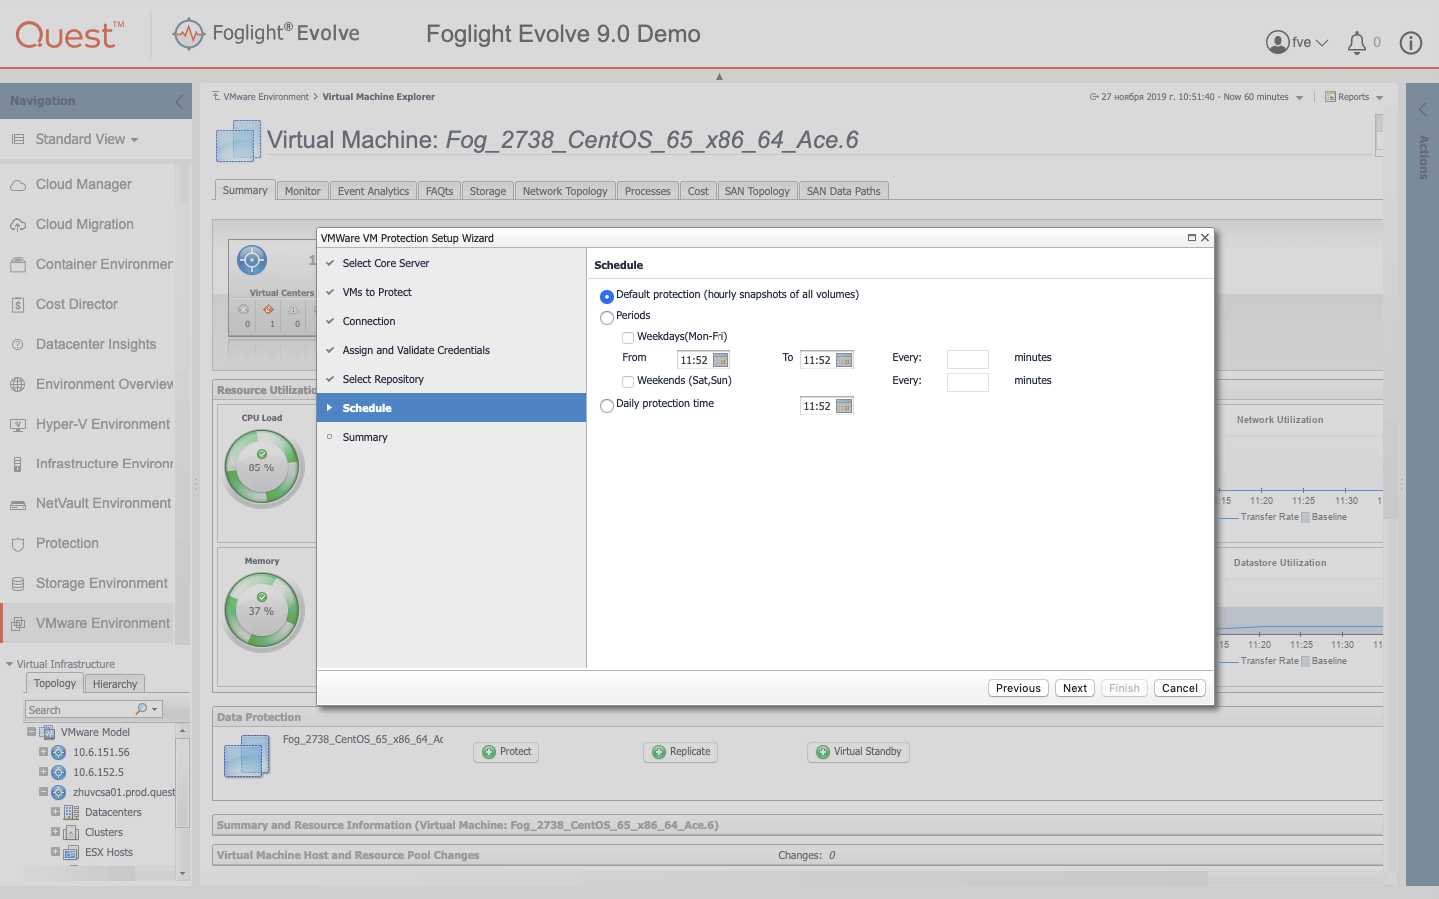
Another feature of the product is integrated data protection. That is, if we go into the view with a virtual machine, you can see three inconspicuous buttons. This thing is realized through the Quest Rapid Recovery tool built into Foglight, which is also available as a separate product (and not only virtual machines can be restored there).
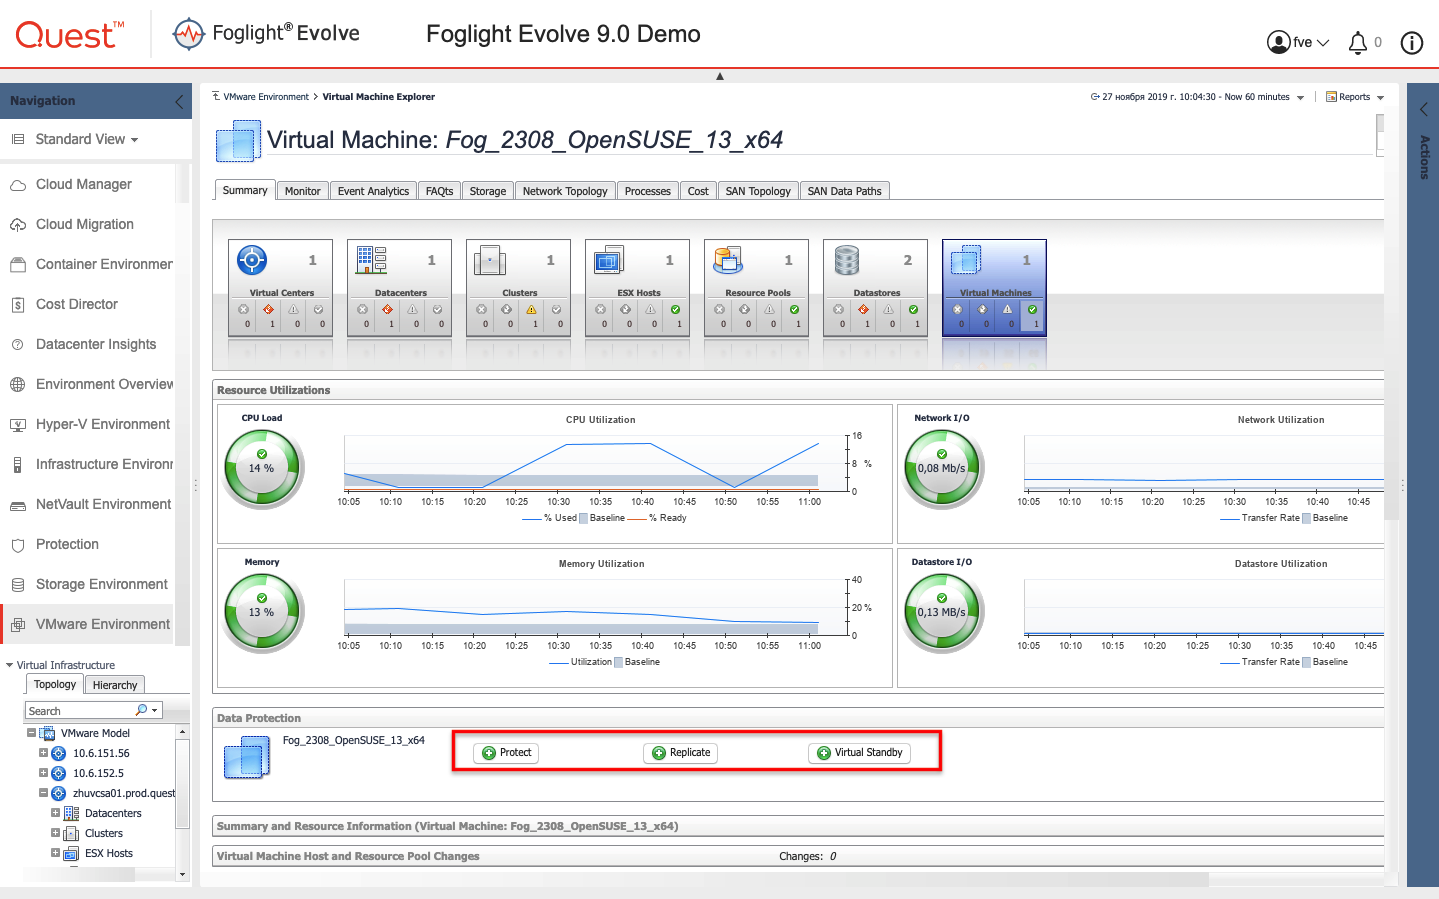
From the interfaces that open after clicking on one of the buttons, you can configure the replication schedule, set automatic recovery options.
For finer control of the replication tool in the system, there is a separate view where you can see the general picture of protecting virtual machines. There is data on the repositories where the backups are stored.
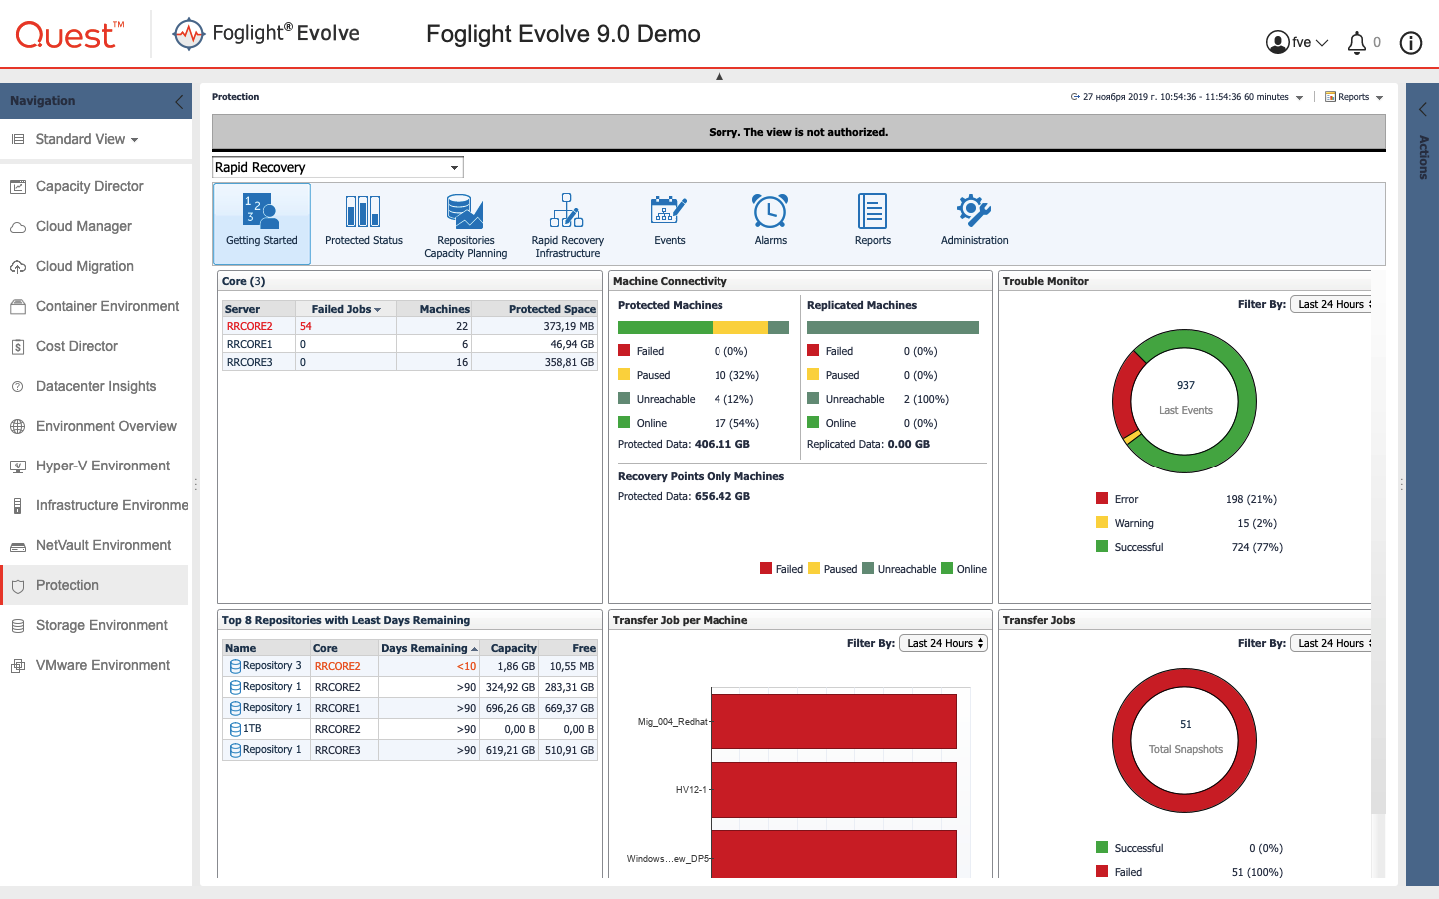
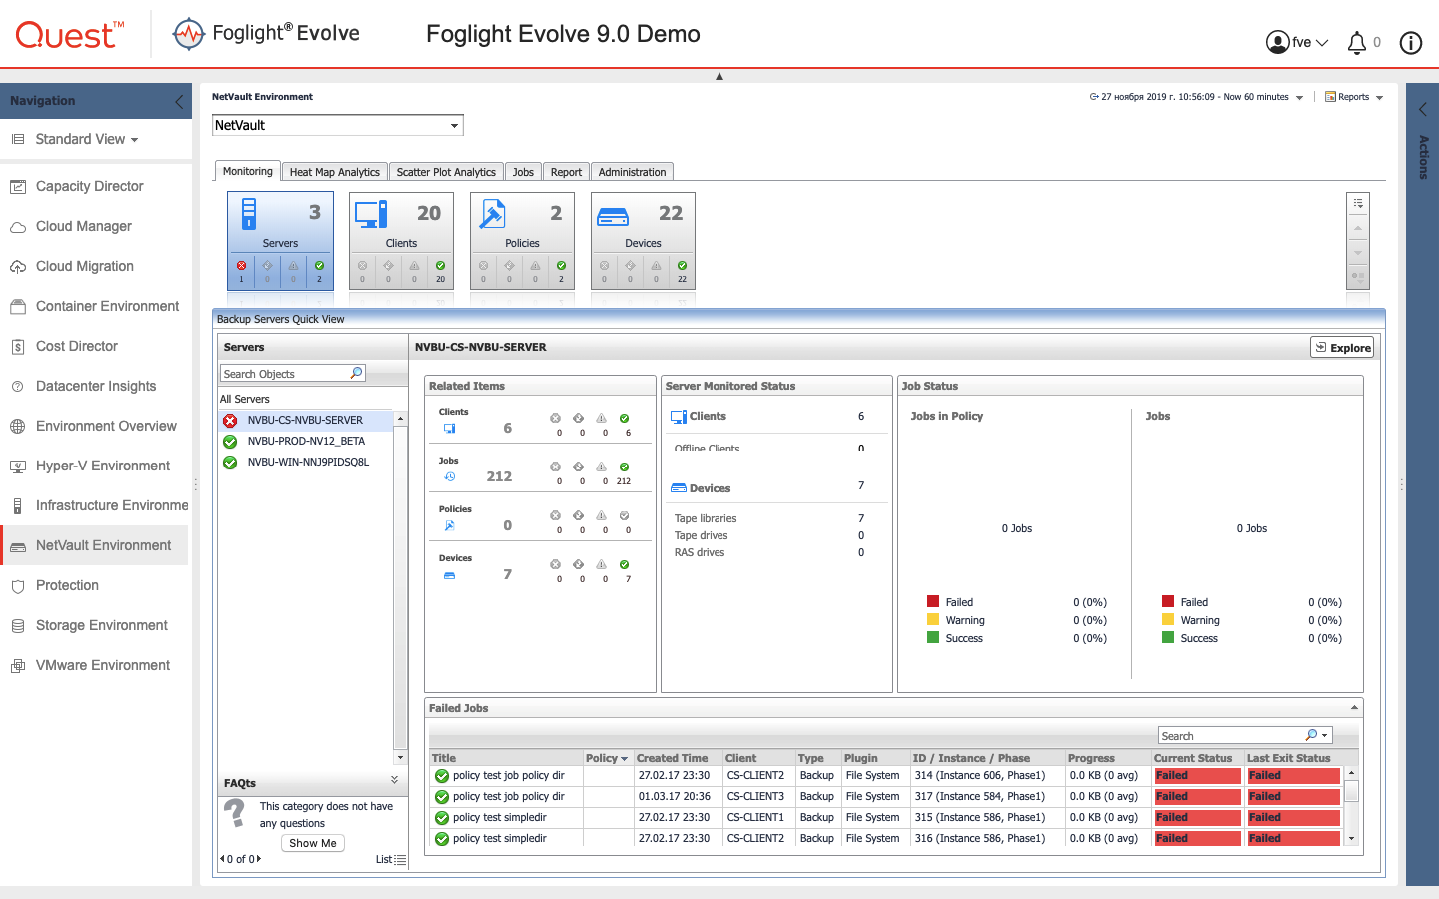
If NetVault is used as a backup tool, you can also see the corresponding metrics here.
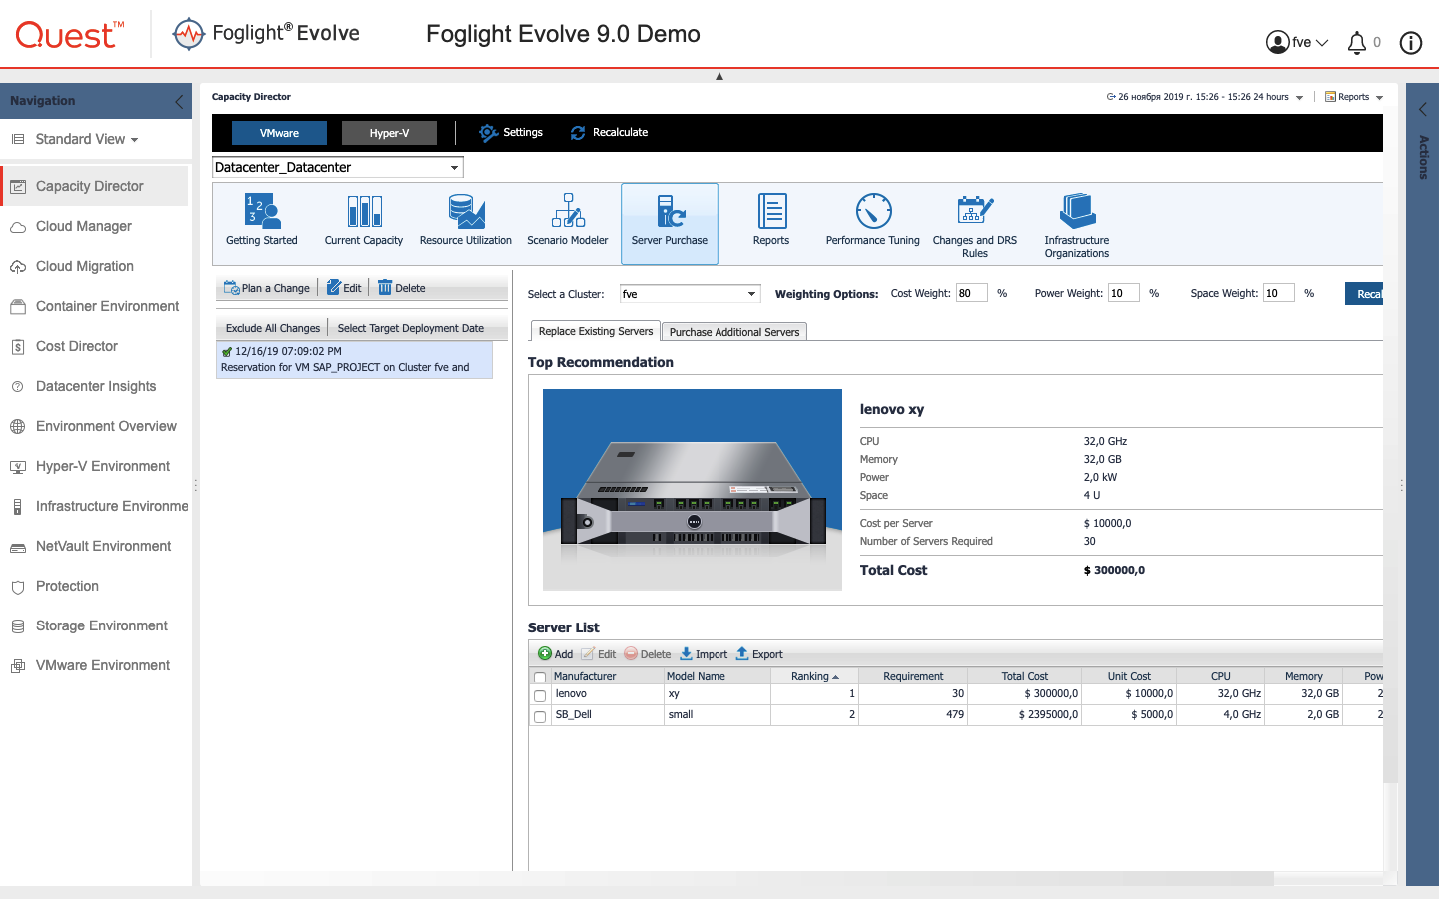
Additional functionality that is available in the Foglight interface is capacity management.
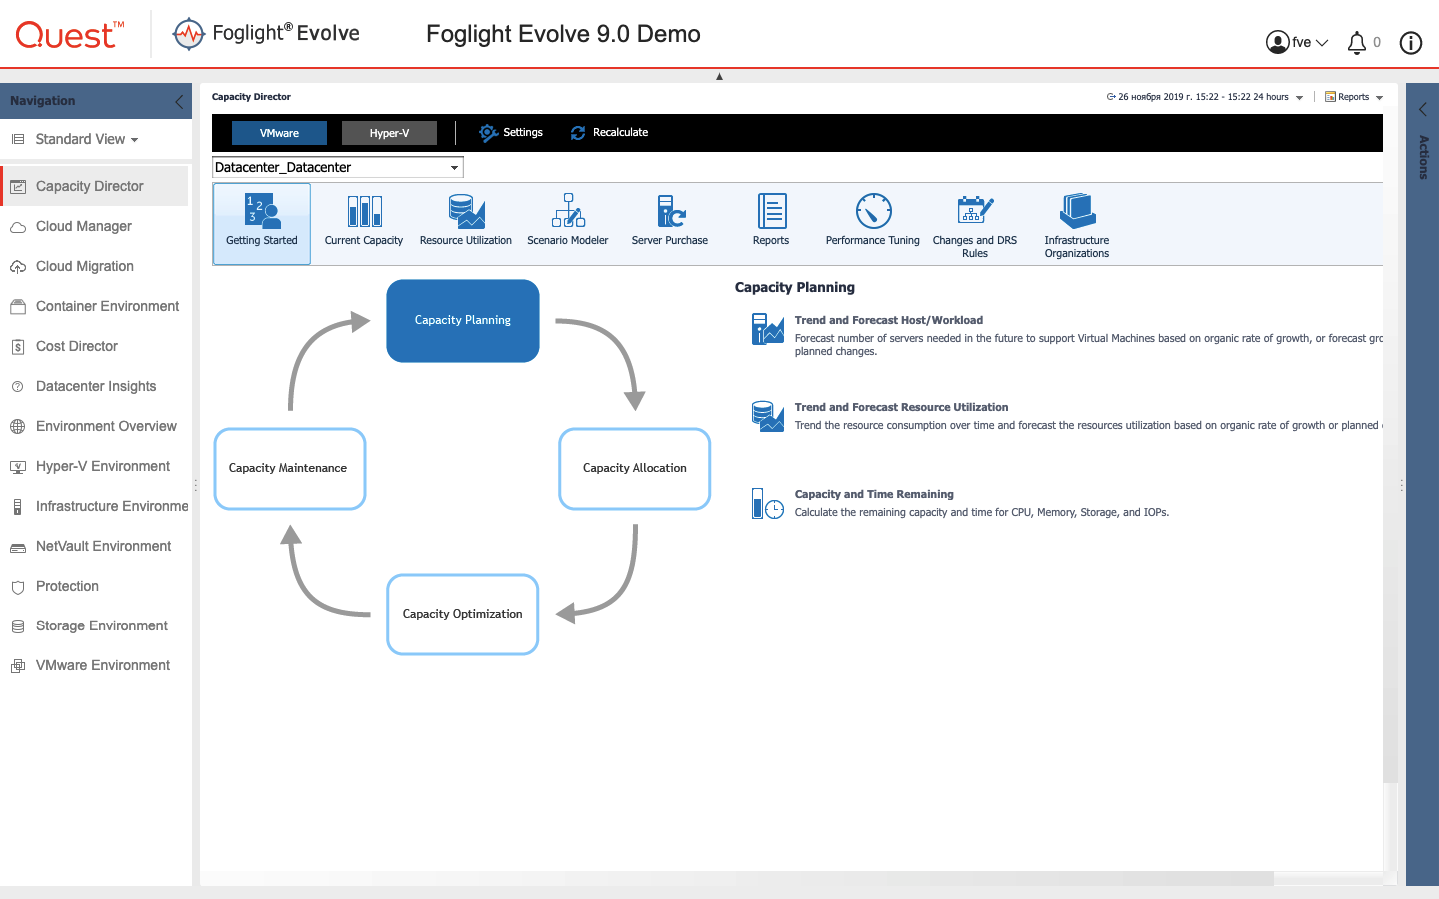
If necessary, you can simulate the changes and see how this will affect the forecast for capacity utilization.
Here you can add servers, indicate their price and characteristics, and the system can offer to use them in case of lack of capacity. At the same time, the final price of changes will be reflected.
Hyper v
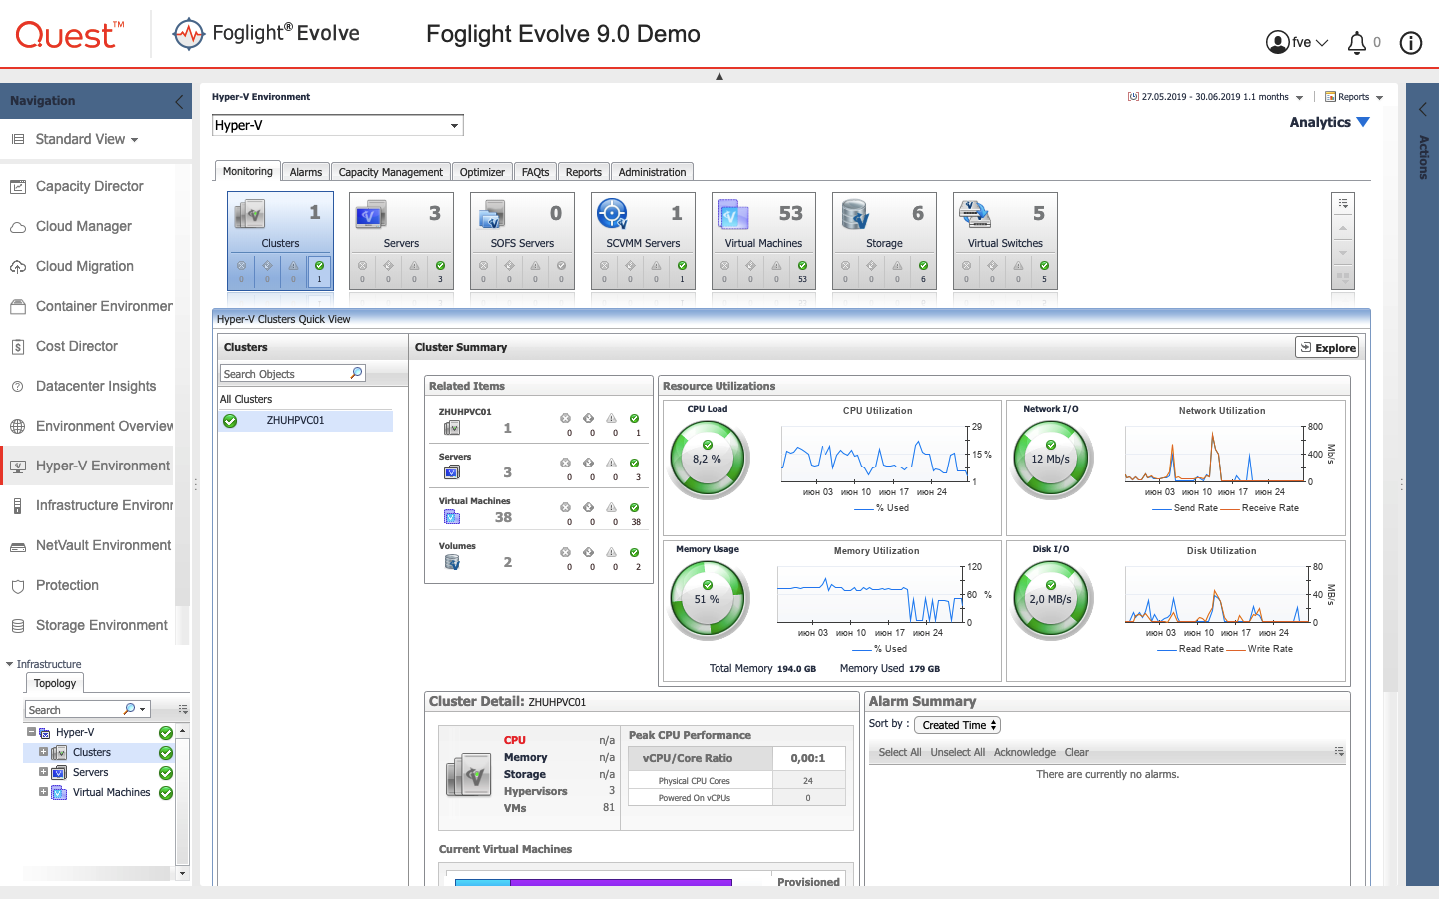
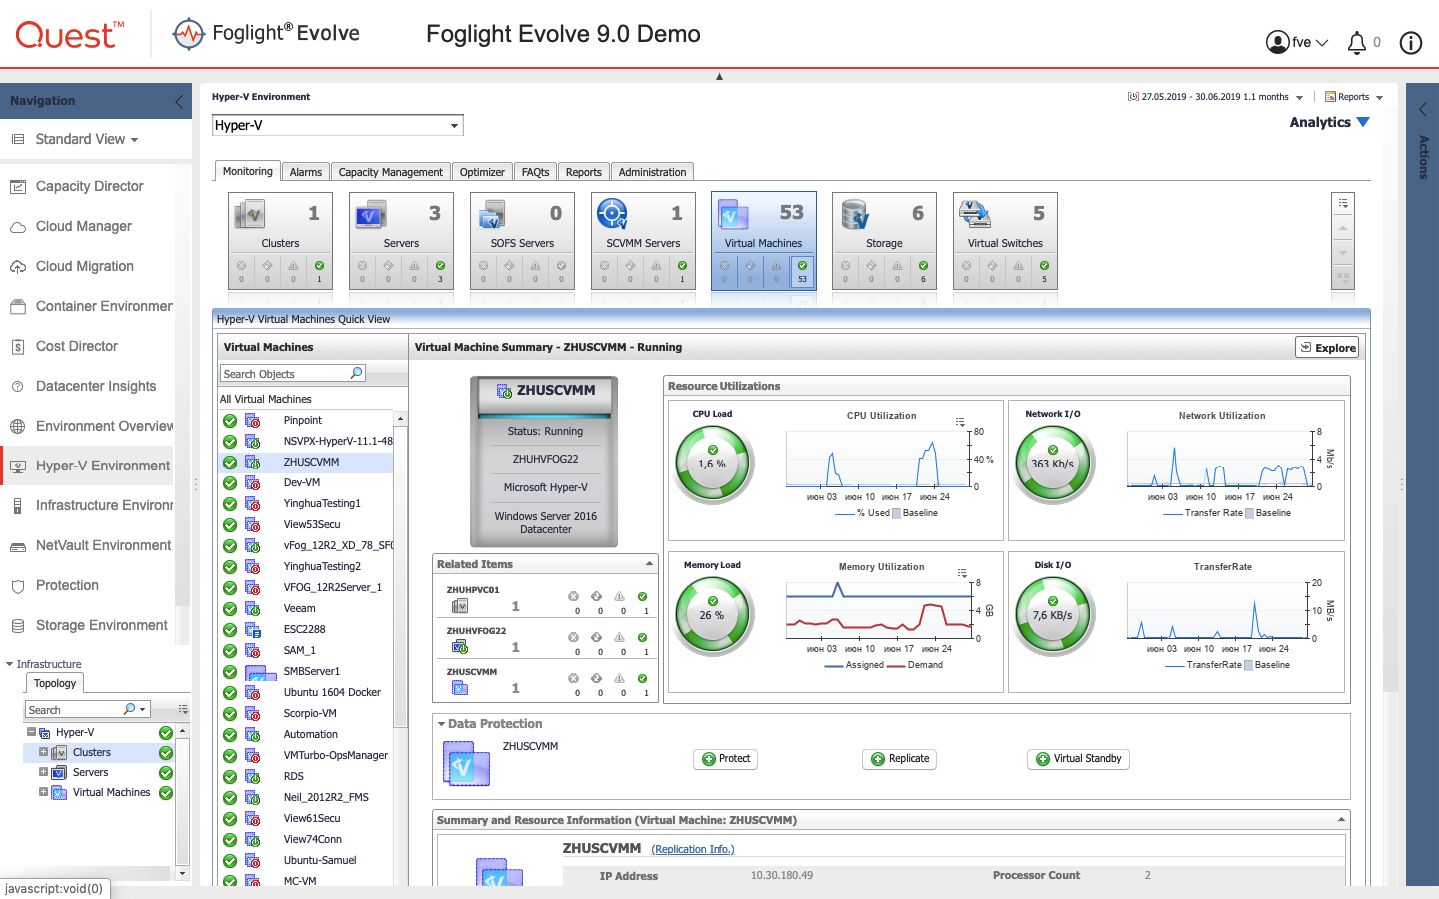
The Foglight functionality in terms of monitoring Hyper-V is in many ways similar to VMware. This is how the general performance overview of the elements of the Hyper-V virtualization platform looks.
Hyper-V also provides control over replication of virtual machines and viewing performance parameters in various sections.
According to VMware and Hyper-V, the system has a single view from which you can manage both of them by switching tabs.
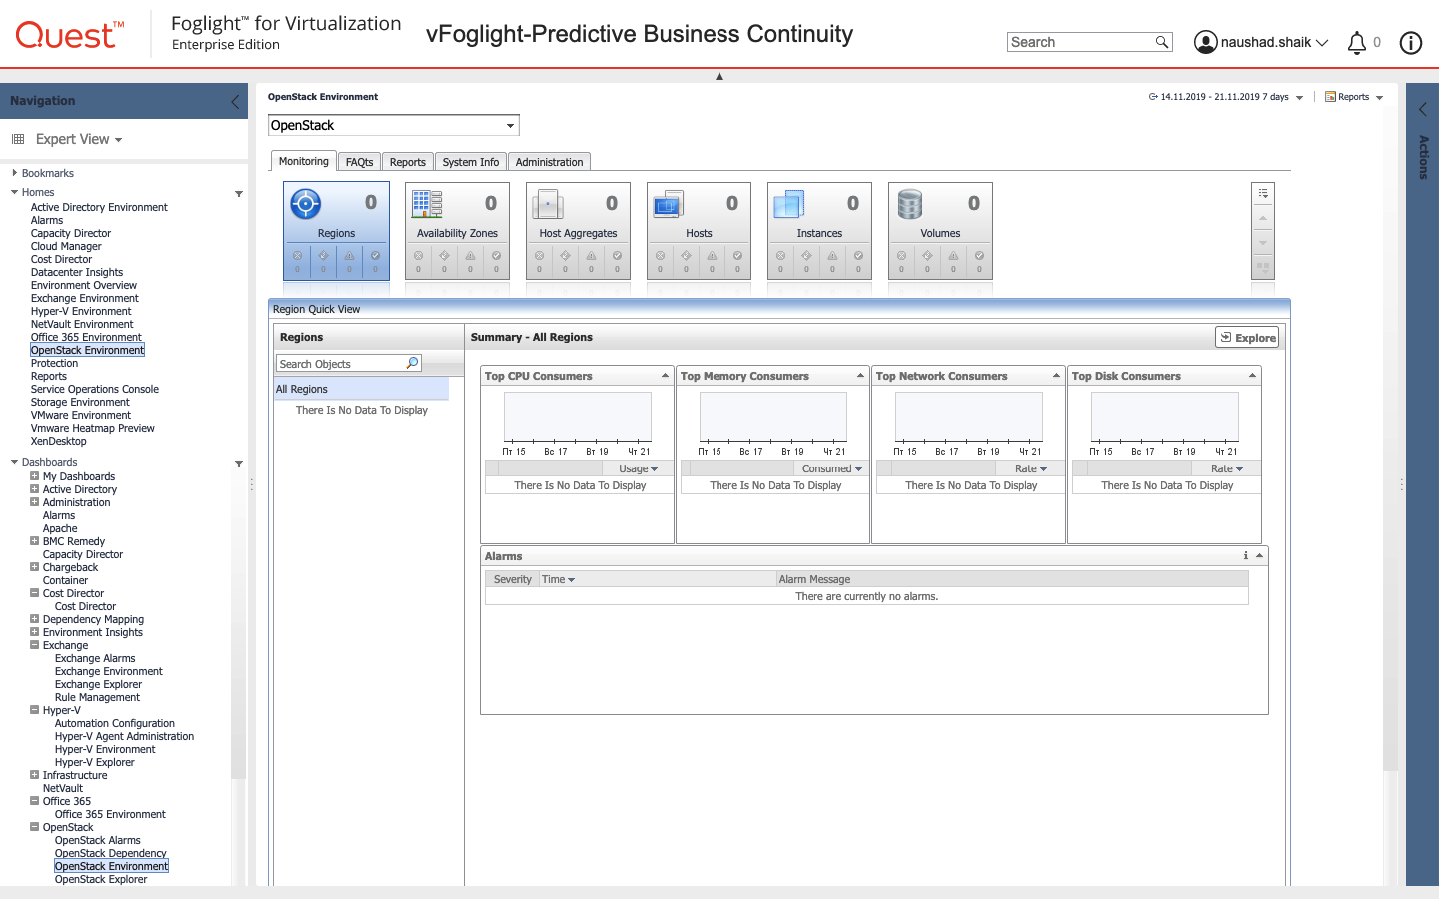
Openstack
Unfortunately, OpenStack was not found in our demo lab. As for VMware and Hyper-V, data on the performance of this platform in various sections are available from a specialized view. But this functionality on this platform is limited.
Other features of Foglight
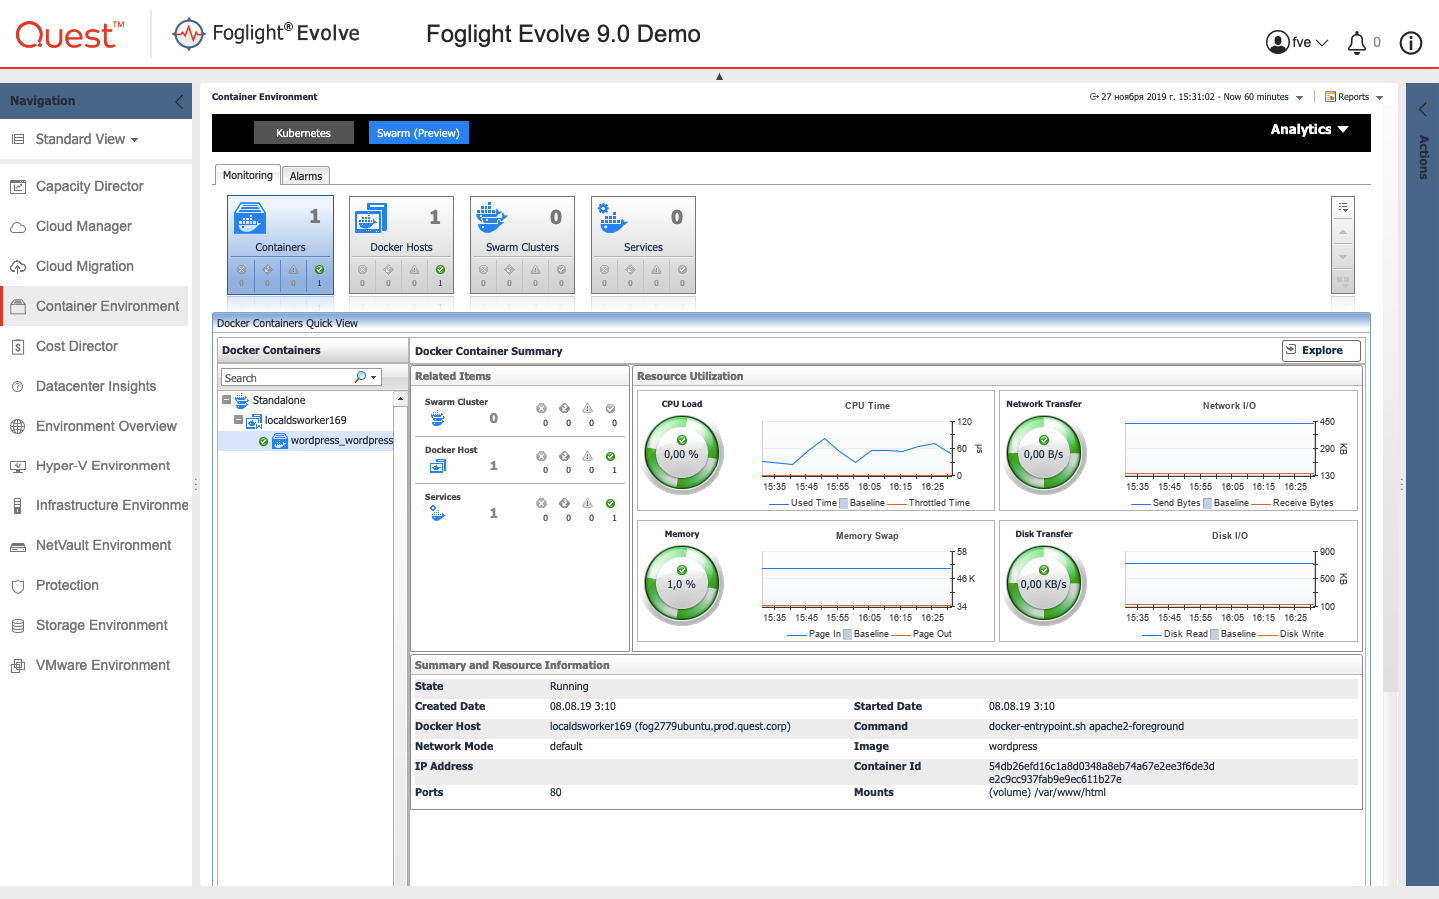
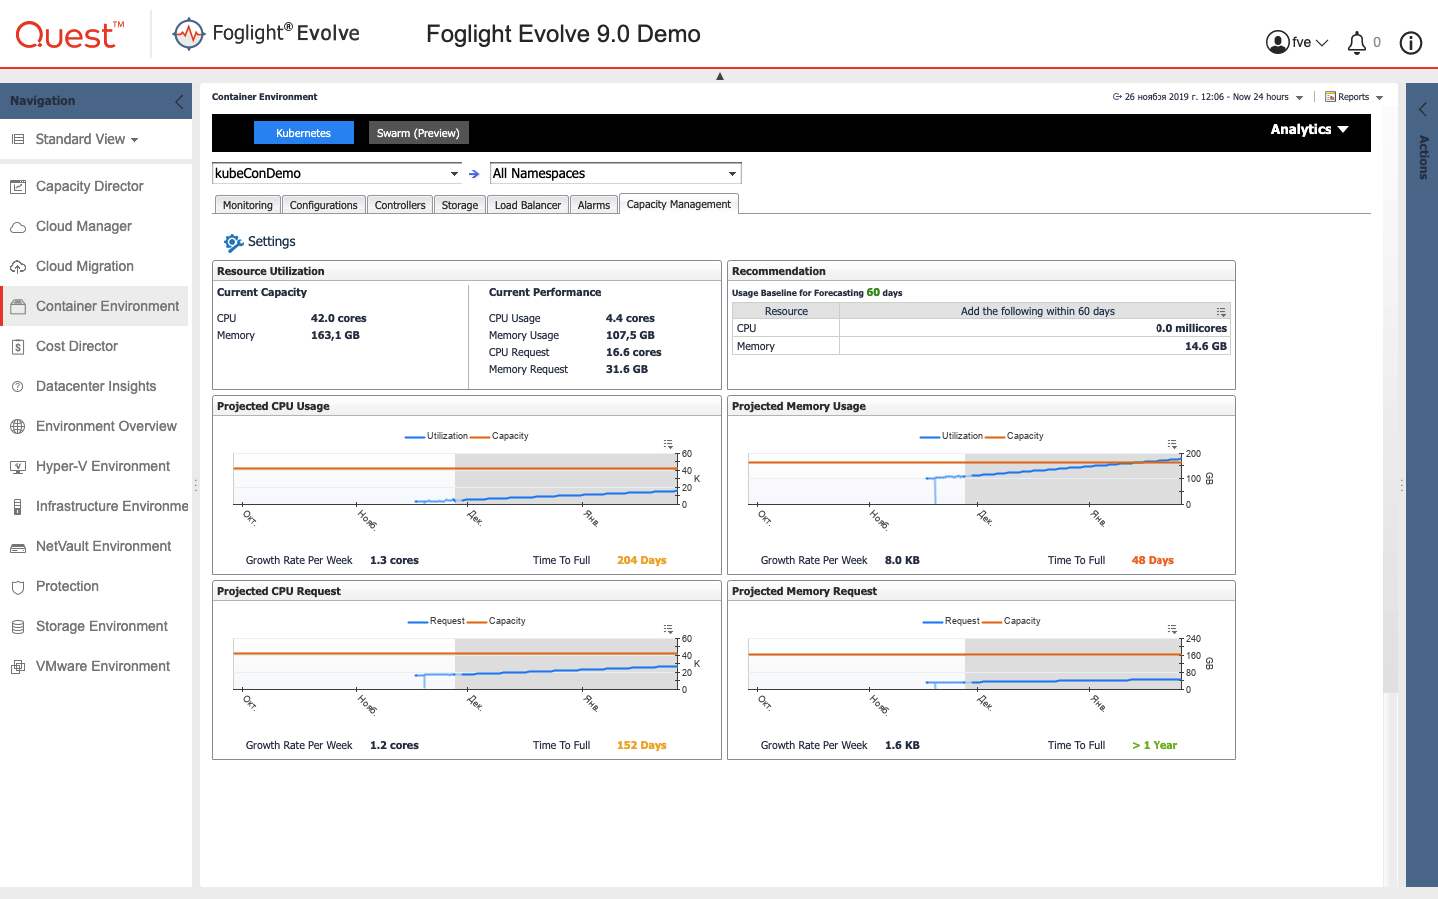
Among the other features of the platform is the monitoring of microservice architectures based on Kubernetes or Swarm.
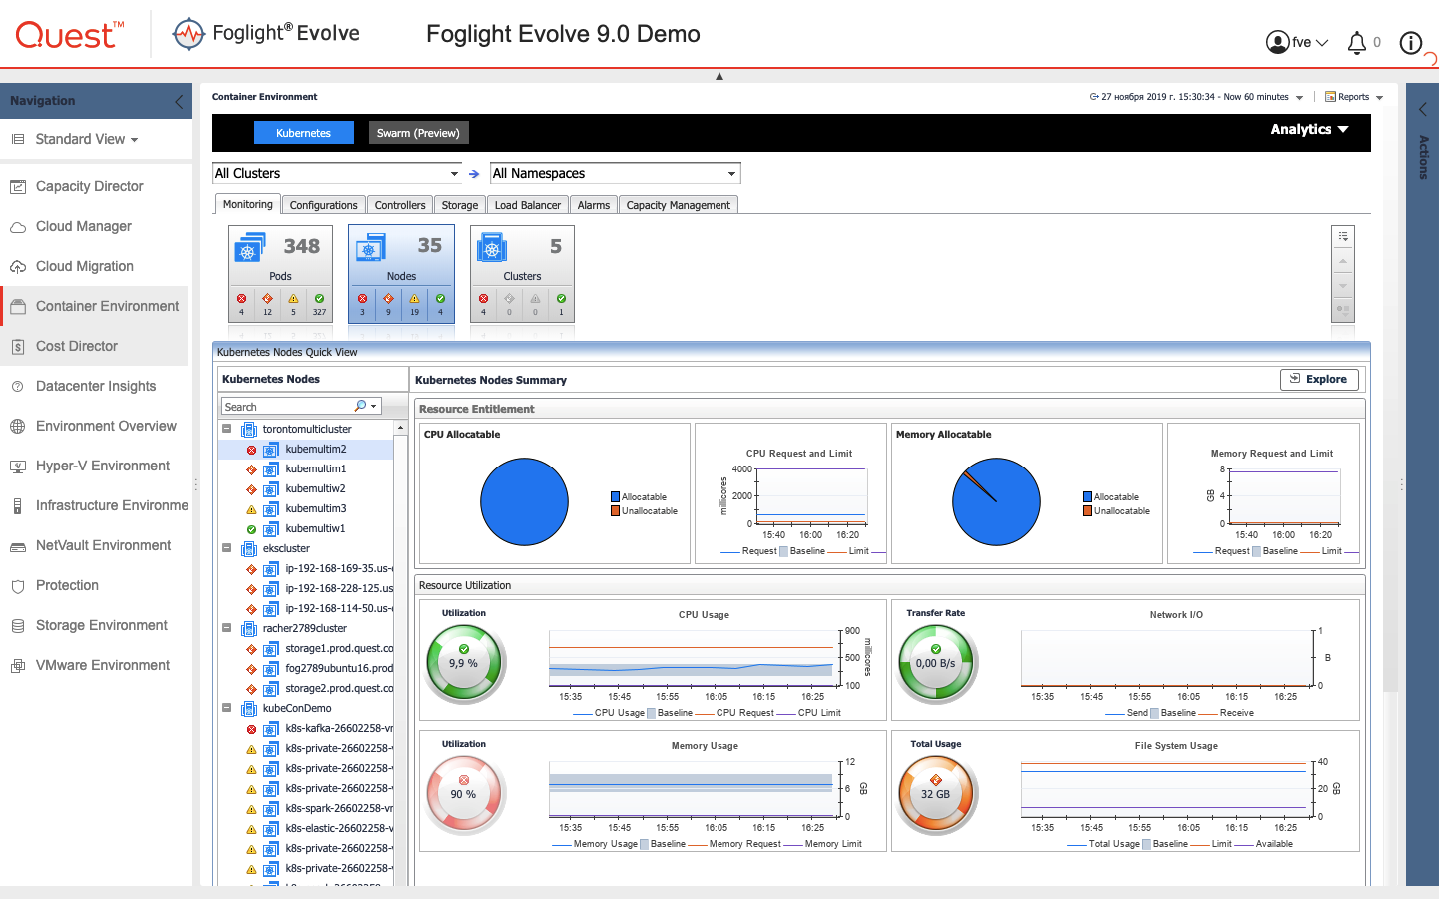
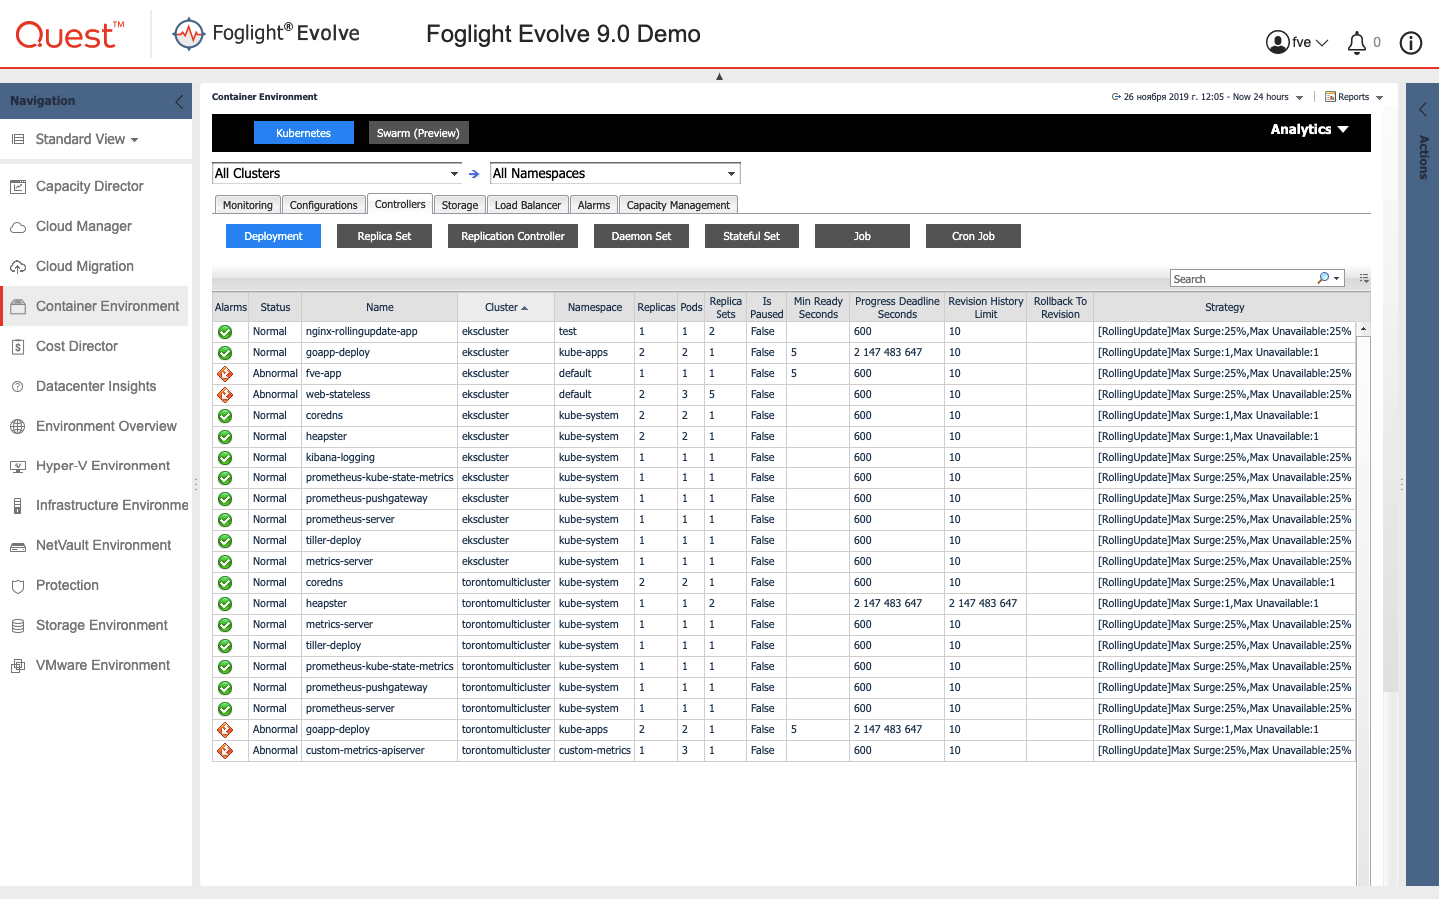
In addition, data is available on the controllers.
And the power reserve forecasting capabilities.
If it is customary to take into account the cost of using infrastructure within an organization, there is a Cost Director tool among the platform modules. Inside it, you can set the cost of time for the disposal of a certain amount of capacity. Works for on-premises and cloud infrastructures.
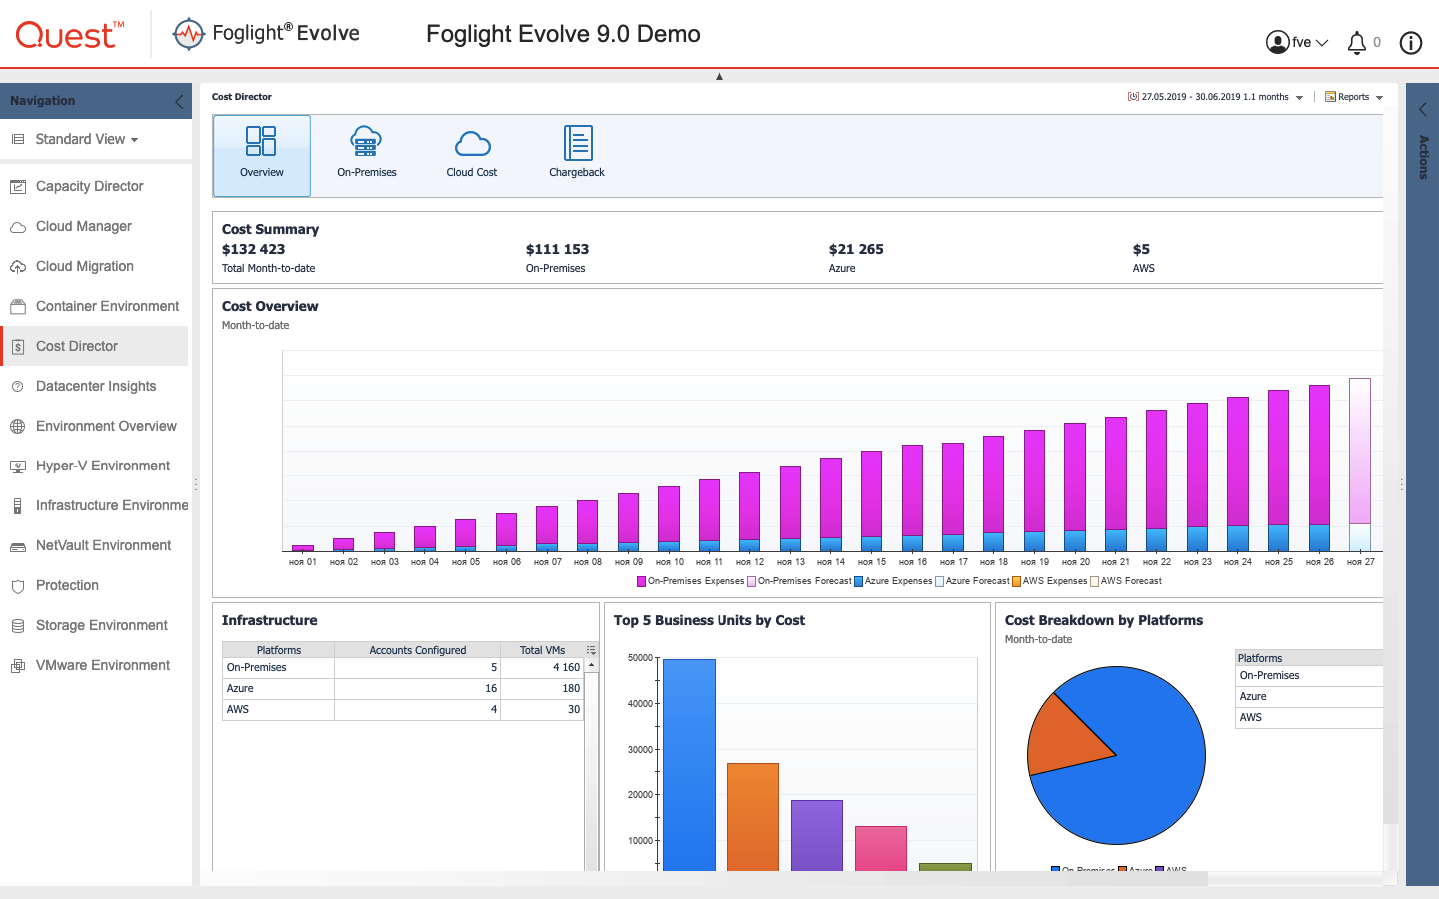
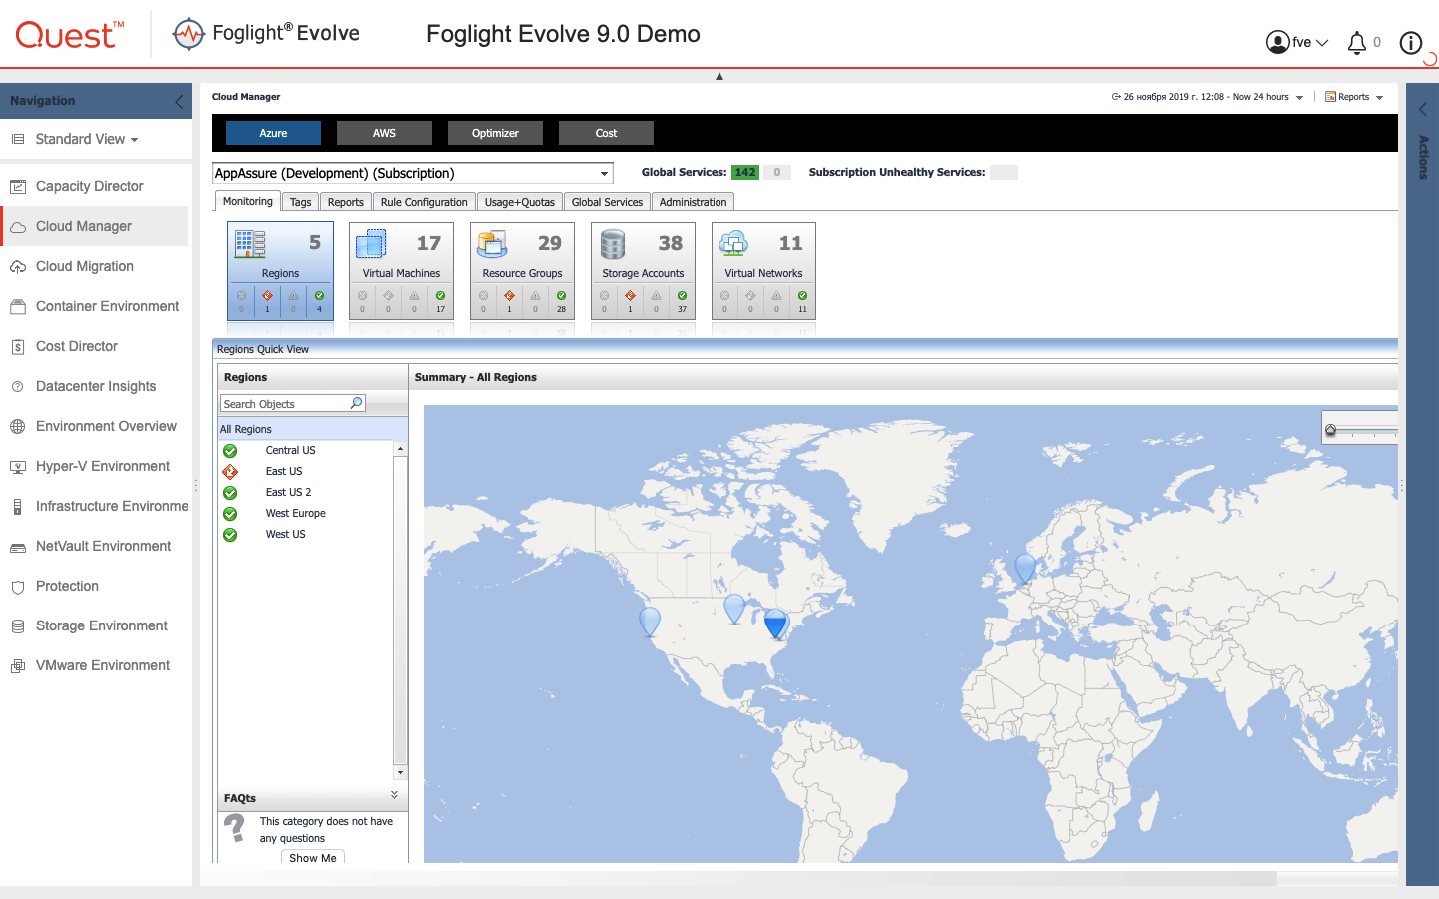
Foglight also has the ability to calculate the cost of consumed services for cloud AWS and Azure.
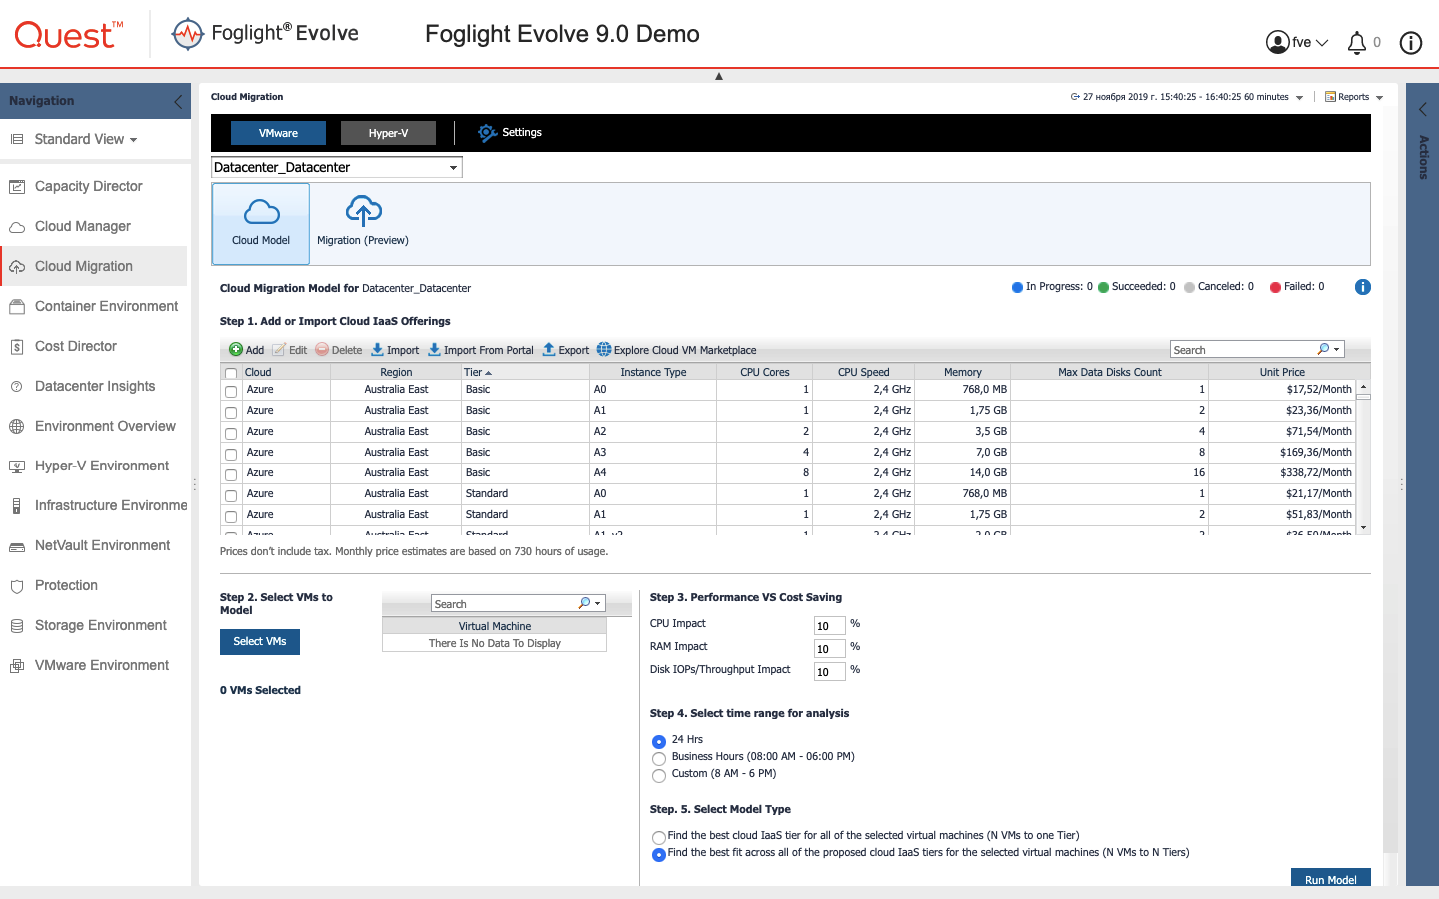
Another built-in tool is Cloud Migration. Allows you to calculate the gain when migrating from the local infrastructure to the cloud.
I tried to minimize the amount of text and show for the most part the visual component of the product. I hope the general idea has developed. Ask questions in the comments, I will answer with pleasure. And for a test drive of the solution on your infrastructure, leave a request in the feedback form on our website.