Using Intel Processor Trace to Trace System Management Mode Code

This article is devoted to testing the possibility of using Intel Processor Trace (Intel PT) technology to record tracks in System Management Mode (SMM) mode. The work was carried out as part of Summer Of Hack 2019. The author of the work: @sysenter_eip.
Most of the tools used are written by other people (in particular @d_olex, @aionescu) The result is just a combination of existing tools in order to get the code execution path in SMM mode for one particular motherboard. However, the material may be interesting for those who want to repeat this for their platform or are simply interested in the work of SMM.
System management mode
SMM is a special, privileged mode of the x86 architecture processor that is available while the operating system is running but transparent to it. It is designed for low-level interaction with iron, power management, emulation of legacy devices, transition to sleep mode (S3), access to TPM and more. It works completely isolated from the OS. For the duration of the SMM, the OS stops completely. The program code that runs in this mode is stored in the SPI-Flash memory of the motherboard and is part of the UEFI BIOS firmware.
Switching to SMM mode is carried out using special SMI interruptions (System Management Interrupt). One of the options for this interrupt is available for use in the zero ring (i.e., from the OS kernel) – Application Level SMI Interrupt (Software SMI). Further, we will focus on these interruptions.
Due to its high privilege, SMM is of particular interest for security research. Compromise of SMM leads to serious violations of the integrity and confidentiality of the entire system, and in most cases it allows you to embed malicious code that cannot be deleted and cannot be detected by the operating system in the UEFI BIOS firmware.
Intel Processor Trace
One of the pitfalls of the debugging process for various highly loaded applications is overhead – the costs of debugging tools. They can be reduced with a hardware-enabled solution.
The fifth generation of processors from Intel (Broadwell) has presented the world with technology such as Intel Processor Trace. How is it useful? Intel PT allows you to get the full flow of execution (Control Flow) of the debugged application with minimal overhead (<5%). At the same time, it supports multithreading and can help in fixing errors like "race condition" due to time stamps when recording the application trace. Undoubtedly, Intel PT technology offers great opportunities for writing vulnerability search tools in applications.
Today, this technology is used in various tools for tracing, debugging, and evaluating code coverage – both in user and kernel-level applications. Examples of tools can be found on the Intel website. An AFL fuzzer option that takes advantage of Intel PT is available in the PTfuzzer repository. Of recent projects, pay attention to iptanalyzer.
However, we have not seen any work devoted to the use of Intel PT in SMM mode. Since nothing prevents us from using Intel PT in this context, we decided to find out whether it is possible to trace System Management Mode code with it.
Preparation for work
From the Intel Developer Manual it follows that it is impossible to activate the Intel PT trace in SMM from the outside using regular means. If it was active at the time the SMI was triggered, the processor will disable it before transferring control to the SMI handler entry point. The only activation method is voluntary inclusion of the SMI handler by the code itself.
Even if the processor does not initially provide such an opportunity, we can intercept it and activate Intel PT manually. However, you need to somehow determine that the system is ready to record the trace (the address of the output buffer is set), and also turn off tracing at the end of the processor execution (execution of the RSM instruction). Otherwise, the processor will shut down the entire system.
First of all, you need to access SMRAM (the area of RAM in which the code executable in SMM mode is located). Since this RAM region is protected, we cannot access it from the operating system (even this cannot be done with DMA). There are several scenarios:
- exploit a known vulnerability in SMM and get the R / W primitive from it. This can be either a software error (a vulnerability in the SMI processor itself; as a rule, in SMM there is enough code that was added by the OEM, so vulnerabilities are not uncommon), as well as a vulnerable platform configuration (unlocking / moving SMRAM);
- patch the UEFI image in such a way that we have an interface for reading and writing to arbitrary addresses – a backdoor. To implement this option, you need to find a motherboard on which Intel Boot Guard is disabled or there are vulnerabilities that can circumvent it.
Embed your code in the firmware
Despite the fact that SMM vulnerabilities in the code of various manufacturers are found from time to time, it will be better if we do not rely on them. It’s more interesting for us to trace the code on new firmware and, accordingly, try to find vulnerabilities in them. We already had the GIGABYTE GA-Q270M-D3H motherboard with Intel Boot Guard disabled, so all we had to do was add a backdoor to SMM.

Figure 1. Test bench
There is already a framework for "infecting" SMM and working with a backdoor. It consists of three components: a UEFI driver in C, an "infector", and a client script in Python. For it to work, you need to extract an arbitrary DXE driver (you can do this using UEFITool) and process it with an infector. The original module was replaced with "improved", and the firmware was uploaded to the SPI memory (for the convenience of flashing the SPI flash drive was removed from the board).
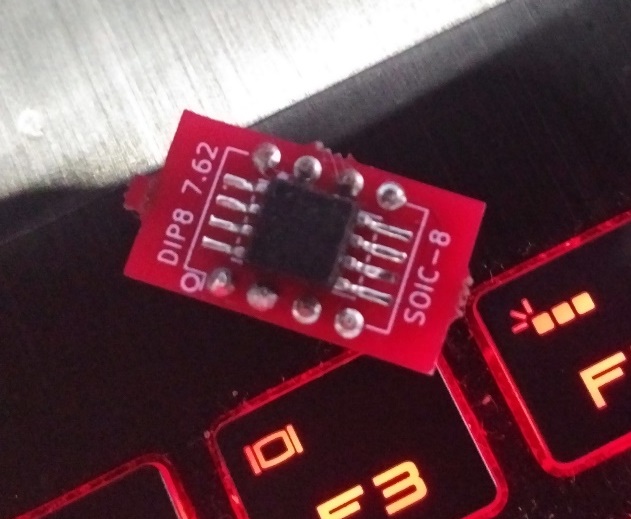
Figure 2. SPI-Flash memory chip
The system started up successfully, and now we have full access to SMRAM from Python (an example of use is provided with the backdoor). Since the client script for the backdoor is based on CHIPSEC, you need to give it access to kernel mode (we used the RWEverything driver; it will be convenient for someone to use their own CHIPSEC driver with signature verification turned off in the system).
You can check the backdoor by requesting an SMRAM dump.
$ python SmmBackdoor.py -d
After executing this command, the SMRAM_dump_cb000000_cb7fffff.bin file will be created containing the current SMRAM state. The values cb000000 and cb7fffff are, respectively, the physical addresses of the beginning and end of SMRAM.
Work with dump SMRAM
The SMRAM dump can be loaded into a disassembler or passed for analysis to the smram_parse.py script, which will extract a lot of useful information for us. The most important for us will be the addresses of the SMI entry points. These are the addresses of the functions to which control will be transferred when SMI is triggered. Each CPU has its own entry point.
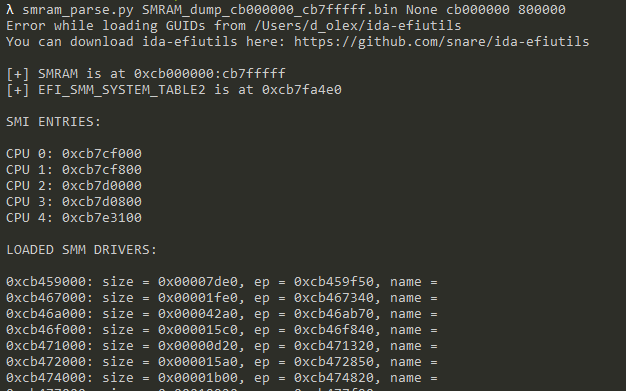
Figure 3. The output of the smram_parse script
Let's look at their code. Since SMM starts its execution in 16-bit Real Mode (the first 4 GB of RAM is reflected in the virtual space), the first thing the code does is switch to 64-bit mode. At the same time, all SMRAM is available with write and execute rights, since only one segment was created (are there any vendors that do it differently?).
We would not want to write 16-bit code or prepare everything necessary for switching to 64-bit mode on our own, so we will place our interceptor right before calling the SMI dispatcher function (this function determines which SMM module the execution should be transferred depending on what service was called or what event happened).

Figure 4. Placement for hooking
The easiest way to take control is to replace the dispatcher address with ours. All entry points have the same code, so the patch needs to be repeated for each.
Note: Regarding the location of the interceptor code. Since the structure of SMRAM is not completely known to us, we chose a random piece of zero memory near one of the entry points, where we placed the interceptor code. The best option would be to add your SMM module to the firmware, which UEFI would legally place in SMRAM, so as not to worry that something important will be overwritten with our code.
SMI Manager Interceptor Implementation
Let us designate what exactly we are going to do inside our interceptor. First we need to determine if Intel PT was turned on before moving to SMM. It is known from Intel documentation that each processor has its own SMBASE base (MSR 0x9E) and its own space for storing the processor state (SMM Save State area) at the time of transition to SMM.
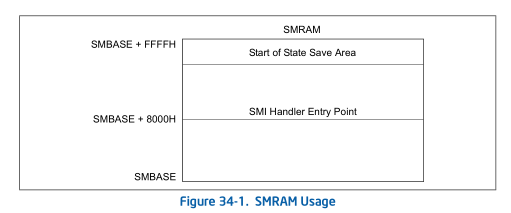
Figure 5. SMBASE layout
We determine the status of Intel PT
In the Save State SMM, the value of MSR register IA32_RTIT_CTL, which is responsible for managing Intel PT tracing, must be saved. Unfortunately, Intel Manual does not indicate where the processor saves the state of the IA32_RTIT_CTL.TraceEn bit at the moment of transition to SMM (whether tracing is enabled, zero bit). However, we can determine this ourselves by dumping the Save State SMM twice: with and without tracing enabled.
We used the WinIPT tool to activate tracing on the Python interpreter process (pid 1337), while highlighting 2 ^12 (4096) bytes to the trace buffer, and then the script SmmBackdoor.py was executed inside the interpreter (argument 0 – these are flags, for us they are not important, since in SMM you still have to force your trace settings).
$ ipttool.exe --start 1337 12 0
By comparing the SMRAM snapshots, we determined the location of the IA32_RTIT_CTL register in the SMM Save State structure. It is stored at offset SMBASE + 0xFE3C. The state of the IA32_RTIT_CTL.TraceEn bit is the main condition for Intel PT re-activation inside SMM. The field at this offset is marked as Reserved in the Intel Developer Manual.
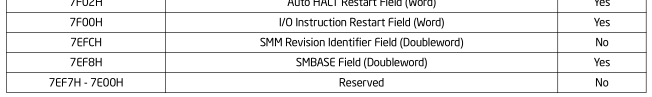
Figure 6. Marking that fields are reserved
Writing shellcode
We did not want to configure Intel PT inside SMM on our own, as this would complicate our shellcode (for example, being in SMM, it would be difficult to allocate a large piece of RAM so that it was not used by the operating system itself). Therefore, we decided to use the already configured tracer and simply "skip" it inside SMM, especially since it already has the function of saving the trace to a file.
Since we used WinIPT for this purpose, which at that time did not support tracing of the kernel code (CPL == 0), it was obvious that even when the trace was included in SMM, nothing would appear in the log, since the SMM code was executed at CPL = 0 . We need to modify some filters so that the tracer can work throughout the entire time spent in SMM. We list all that needs to be checked and installed:
- Tracing with CPL = 0 must be enabled.
- Tracing with CPL> 0 must be enabled (optional).
- The valid IP ranges for event recording must be disabled.
- IA32_RTIT_STATUS.PacketByteCnt must be reset.
- CR3 filtering must be disabled.
A few words should be said about PacketByteCnt. This counter determines at what point you need to insert synchronization packets (a sequence of several PSB commands) into the trace. We need to reset this counter, otherwise, during the processing of the trace, the moment of entering the SMM will be missed and the trace will start from a random place when the PSB is generated naturally.
Below is the shellcode we used:
        sub rsp, 0x18; this will align stack at 16 byte boundary (in case SMM
                                        ; code uses align dependent instructions)
    mov qword ptr ss:[rsp+0x10], rcx; need to save rcx for SMI_Dispatcher
    mov ecx, 0x9E; MSR_IA32_SMBASE
    rdmsr
    test byte ptr ds:[rax+0xFE3C], 0x1; Save State area contains saved
                                        ; IA32_RTIT_CTL.TraceEn
    je short @NoTrace
    call @Trace_Enable
    mov rcx, qword ptr ss:[rsp+0x10]    ; SMI_Dispatcher is __fastcall
                                        ; (first argument in rcx)
    mov eax, 0xCB7DDAA4; original SMI_Dispatcher !!!!!!!!!!!!!!!!!!!!!!!
    call rax
    call @Trace_Disable
    add rsp, 0x18
    ret

@NoTrace:
    mov rcx, qword ptr ss:[rsp+0x10]    ; SMI_Dispatcher is __fastcall
    mov eax, 0xCB7DDAA4; original SMI_Dispatcher !!!!!!!!!!!!!!!!!!!!!!!
    call rax
    add rsp, 0x18
    ret

@Trace_Disable:
    mov ecx, 0x570; IA32_RTIT_CTL
    rdmsr
    mov rax, qword ptr ss:[rsp+0x10]    ; restore IA32_RTIT_STATUS
    wrmsr
    mov ecx, 0x571; IA32_RTIT_STATUS
    rdmsr
    mov rax, qword ptr ss:[rsp+0x8]     ; restore IA32_RTIT_CTL
    wrmsr
    ret

@Trace_Enable:
    mov ecx, 0x571; IA32_RTIT_STATUS
    rdmsr
    mov qword ptr ss:[rsp+0x8], rax; save IA32_RTIT_STATUS
    and edx, 0xFFFF0000; IA32_RTIT_STATUS.PacketByteCnt = 0
    wrmsr
    mov ecx, 0x570; IA32_RTIT_CTL
    rdmsr
    mov qword ptr ss:[rsp+0x10], rax; save IA32_RTIT_CTL
    and eax, 0xFFFFFFBF; IA32_RTIT_CTL.CR3Filter = 0
    or eax, 0x5; IA32_RTIT_CTL.OS = 1; IA32_RTIT_CTL.User = 1;
    and edx, 0xFFFF0000; IA32_RTIT_CTL.ADDRx_CFG = 0
    wrmsr
    ret
This code must be placed in SMRAM, and the transition to the SMI manager must be patched to switch to our code. All this is done using SmmBackdoor.
Work with the track
The SMI manager interceptor allowed us to write the first code trace from SMM. The next command you can ask Winipt save the trace to a file:
$ ipttool.exe --trace 1337 trace_file_name
Disabling tracing on a process:
$ ipttool.exe --stop 1337
You can try to disassemble the trace using the utility dumppt from libipt.
$ ptdump.exe --no-pad ./examples/trace_smm_handler_33> ./examples/trace_smm_handler_33_pt_dump.txt
Output Example:
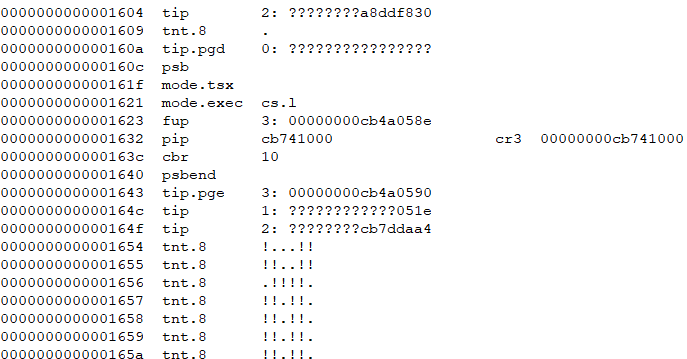
Figure 7. The first SMM instruction path
We can see some addresses, however, using this information is extremely difficult, since it is very low-level.
For a more readable view, there is a utility ptxed (from libipt), which converts the trace into a log of executed assembler instructions. Of course, we will have to provide the utility with an SMRAM memory dump, since the IPT log does not contain information about the values of memory cells or what instructions were executed; it contains only information about what changes occurred in the control flow.
$ ptxed.exe --pt tracesmm_12 --raw SMRAM_dump_cb000000_cb7fffff.bin: 0xcb000000> tracesmm_12_ptasm
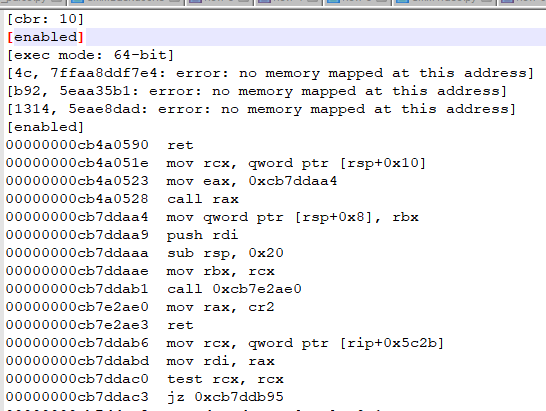
Figure 8. Assembler listing corresponding to the IPT log
It already looks much better, but if the code contains a loop, the output will be clogged with the same instructions.
Determine code coverage using the trace
To get coverage visualization, we chose the Lighthouse plugin for IDA Pro, which uses the drcov format.
No ready-made tools were found, so we modified ptxed so that it also generates a coverage file in the course of its work. Patched ptxed available in the repository. Take a look at the commit history to determine what exactly was added.
After ptxed completes, the SMRAM_dump_cb000000_cb7fffff.bin.log file appears, which will contain coverage information in drcov format.
Note: There is a small problem with disassembler synchronization on the first PSB. For an incomprehensible reason, if the PSB is generated before PGE (the counter is reset to zero before the trace is activated again), then ptxed can't sync over it. To work around this problem, we made a small patch. It is not clear whether this is the problem itself. ptxed, or we are doing something wrong by resetting IA32_RTIT_STATUS.PacketByteCnt.
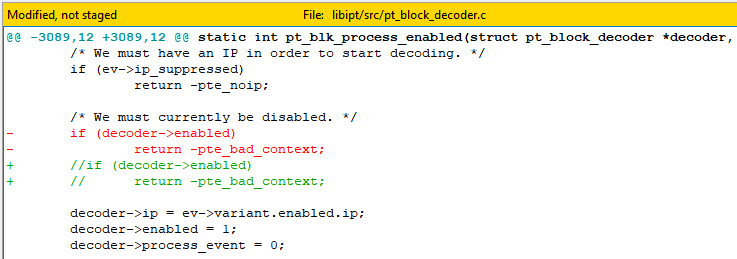
Figure 9. A patch that allows you to use the PSB located right in front of the PGE
Generated coverage files can be downloaded into IDA Pro and get beautiful highlighting, as well as statistics on percent coverage for each function.
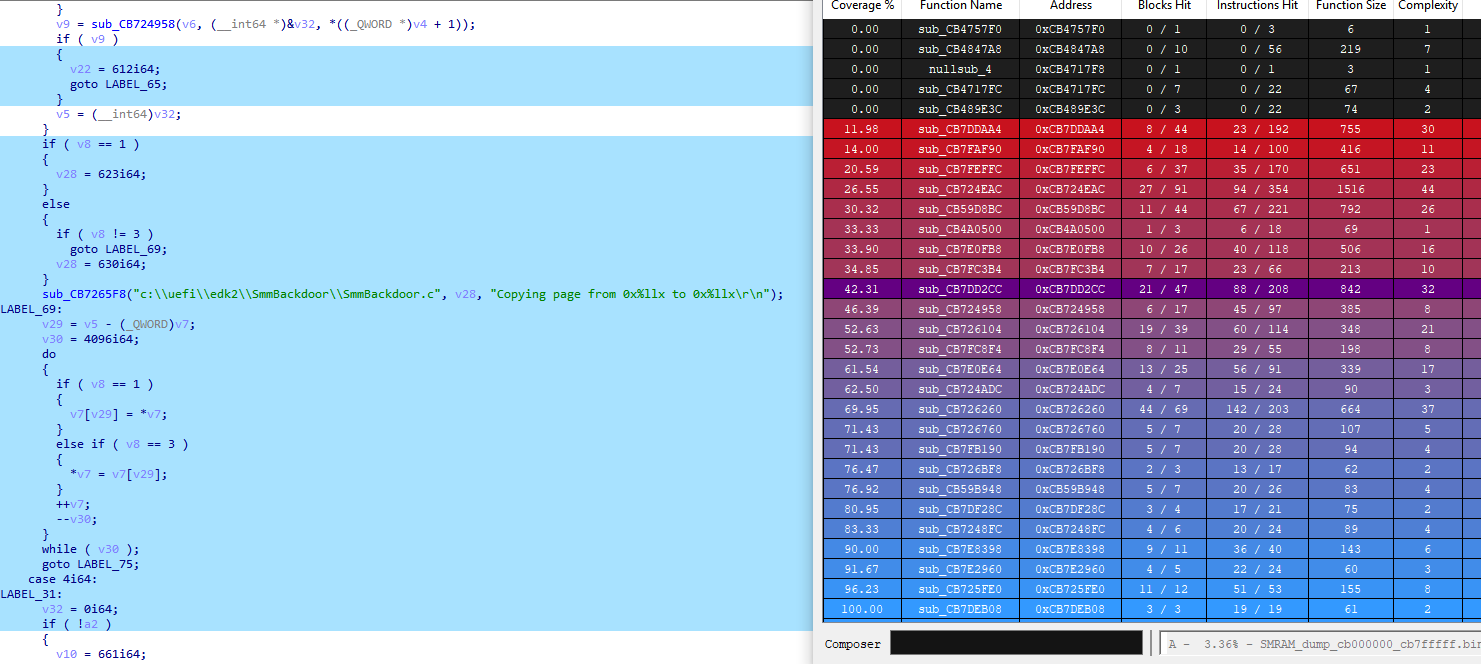
Figure 10. IDA Pro Lighthouse plugin with code coverage information
Note: The Lighthouse plugin works a little strangely on incompletely analyzed databases (the executable code is not marked up, functions have not been created). We traced this “problem” to the get_instructions_slice function in the lighthouse metadata.py file, where it returns 0 instructions even for the address where the function was manually created. The plugin seems to use the cache and ignore the new specific code. This can be circumvented by calling Reanalyze on the program and reopening IDB. Only after that the plugin will be able to see the new code and begin to consider it. Since this problem is very inconvenient in the case of an SMRAM dump (which on the first boot consists almost entirely of undefined code), we made one small change to the Lighthouse code so that we could define a new code manually faster.
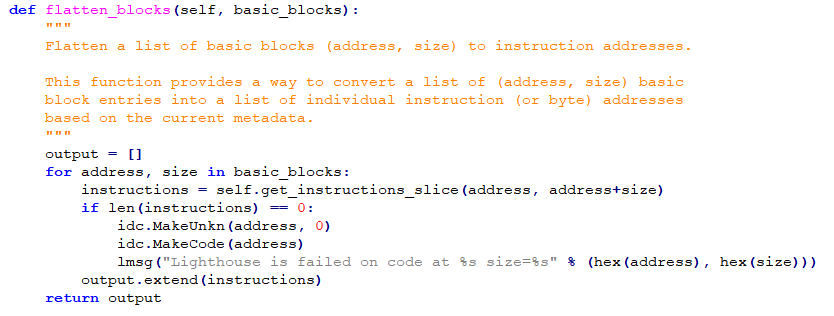
Figure 11. Added log message to help identify new code
Linux support
Since all our tests were conducted on Windows 10 x64 (we needed ipt.sys, which appeared in Windows October Creators Update 2018), let's say a few words about the possibility of implementing this in Linux.
- There is a module perf Linux kernel, which can do similar WinIPT (ipt.sys) actions, including the ability to trace code in kernel mode.
- Since the backdoor SMM interface is based on the cross-platform CHIPSEC framework, our patch will work on a Linux system without any modifications.
Conclusion
We successfully coped with the task of obtaining a code trace executing in SMM using Intel Processor Trace technology. A similar result could be achieved with the help of expensive equipment and software that is not sold to everyone. It was enough for us to have on hand one motherboard and SPI-programmer. The speed of removal of the track is really impressive, and there are no complaints about the accuracy of the result.
We hope this article helps others take advantage of Intel PT technology to investigate and search for vulnerabilities in SMM code. Adapting our work to other motherboards should not cause difficulties (do not forget about Intel Boot Guard). The main thing is to fully understand how it works. The most difficult part is to determine how to intercept the SMI dispatcher and write a shellcode for the interceptor. In our version, "wired" addresses were used, so you should carefully transfer the shellcode to another system.
All used tools and scripts are available in the repository on GitHub.