Useful scripts for WinDBG:! Exccandidates command
Some time ago, we published a small a script library for the popular Windbg debugger… They are designed to automate a number of routine tasks that arise when analyzing the causes of program crashes, both during live debugging and when working with memory dumps. We have planned several posts explaining how to use these scripts. Here is the first post in this series. It demonstrates the use of the! Exccandidates command with a synthetic example.
Sometimes, when parsing a dump, a suspicion arises that the exception that happened is not the first, but at the same time direct links to it have not been preserved anywhere. There are not so few such situations: for example, repeated exceptions can occur during exception handling or when unwinding the stack after an exception; they can be triggered by the state of the variables after the first exception; Finally, this often happens when using third-party libraries that use a different error handling model. In all these cases, you can try to find records from previous exceptions on the stack. Of course, there is no guarantee that they remained safe and sound, but in many cases it succeeds.
By itself, the trick with finding exceptions is quite widely known – you need to look for some rarely changing parts of the CONTEXT structure. Usually they look for flags (although they just can be changed) or segment registers, which, in my opinion, is more reliable. The! Exccandidates command automates this process and cuts off unnecessary things, leaving only those exceptions that occurred in the selected stream.
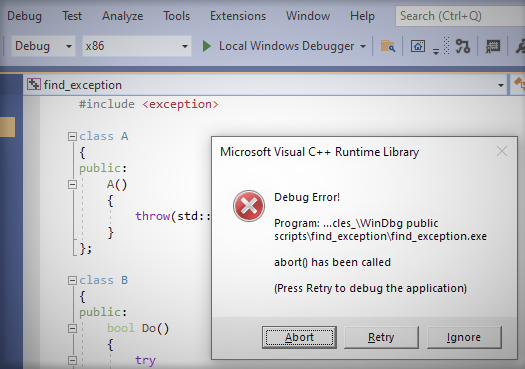
For example, let’s take this small program:
#include <exception>

class A
{
public:
    A()
    {
        throw(std::exception("It's too cold!"));
    }
};

class B
{
public:
    bool Do()
    {
        try
        {
            A a;
            return true;
        }
        catch (const std::exception&)
        {
            return false;
        }
    }
};

class Log
{
public:
    void Notify(const char* msg)
    {
        message = msg;
    }

private:
    const char* message;
};

class C
{
public:
    C()
    {
        B b;
        if (!b.Do())
            reinterpret_cast<Log*>(1)->Notify("I don't know what happened!");   // Simulating tracer lifetime error
    }
};

int main()
{
    C c;
    return 0;
}
It simulates the situation when, after an error, it is discovered that we have a problem with the tracer lifetime. Naturally, the problem with the tracer needs to be repaired, but in order not to put on shoes twice, why not try to figure out at the same time what the primary error was.
When running this program under Windbg, execution stops at the expected AV. For convenience, find_exception.cpp can be downloaded from here…
Here is the stack we see:
>.ecxr; k
# ChildEBP RetAddr
00 (Inline) -------- find_exception!Log::Notify [e:WorkPerforcecore_tech_from_p4_articles_WinDbg public scriptsfind_exceptionfind_exception.cpp @ 34]
01 (Inline) -------- find_exception!C::{ctor}+0x9 [e:WorkPerforcecore_tech_from_p4_articles_WinDbg public scriptsfind_exceptionfind_exception.cpp @ 48]
02 006ffbf4 00cd1387 find_exception!main+0x9 [e:WorkPerforcecore_tech_from_p4_articles_WinDbg public scriptsfind_exceptionfind_exception.cpp @ 54]
03 (Inline) -------- find_exception!invoke_main+0x1c [d:agent_work57ssrcvctoolscrtvcstartupsrcstartupexe_common.inl @ 78]
04 006ffc3c 7749fa29 find_exception!__scrt_common_main_seh+0xfa [d:agent_work57ssrcvctoolscrtvcstartupsrcstartupexe_common.inl @ 288]
05 006ffc4c 778a76b4 kernel32!BaseThreadInitThunk+0x19
06 006ffca8 778a7684 ntdll!__RtlUserThreadStart+0x2f
07 006ffcb8 00000000 ntdll!_RtlUserThreadStart+0x1b
Naturally, there is no indication of the original exception here. But we can look for them:
>!exccandidates
Searching for exception candidate in current thread
Stack top: 0x600000

Found exception 0
.exr 0x6ff5f0 - exception code 0xe06d7363
.cxr 0x6ff640
@$exccandidates() : 0x1
Great, there was a positive exception – 0xe06d7363. Let’s see it, for what we will use the commands that the script kindly prompts us:
>.exr 0x6ff5f0
ExceptionAddress: 7773a8b2 (KERNELBASE!RaiseException+0x00000062)
   ExceptionCode: e06d7363 (C++ EH exception)
  ExceptionFlags: 00000001
NumberParameters: 3
   Parameter[0]: 19930520
   Parameter[1]: 006ffbbc
   Parameter[2]: 00cd2724
  pExceptionObject: 006ffbbc
  _s_ThrowInfo    : 00cd2724
  Type            : class std::exception
And the stack:
>.cxr 0x6ff640; k
*** Stack trace for last set context - .thread/.cxr resets it
# ChildEBP RetAddr
00 006ffb7c 711f7a86 KERNELBASE!RaiseException+0x62
01 006ffbac 00cd110d VCRUNTIME140!_CxxThrowException+0x66 [d:agent_work9ssrcvctoolscrtvcruntimesrcehthrow.cpp @ 74]
02 006ffbc8 00cd1145 find_exception!A::A+0x1d [e:WorkPerforcecore_tech_from_p4_articles_WinDbg public scriptsfind_exceptionfind_exception.cpp @ 8]
03 006ffbf0 00cd1175 find_exception!B::Do+0x35 [e:WorkPerforcecore_tech_from_p4_articles_WinDbg public scriptsfind_exceptionfind_exception.cpp @ 24]
04 (Inline) -------- find_exception!C::{ctor}+0x5 [e:WorkPerforcecore_tech_from_p4_articles_WinDbg public scriptsfind_exceptionfind_exception.cpp @ 47]
05 006ffbf4 00cd1387 find_exception!main+0x5 [e:WorkPerforcecore_tech_from_p4_articles_WinDbg public scriptsfind_exceptionfind_exception.cpp @ 54]
06 (Inline) -------- find_exception!invoke_main+0x1c [d:agent_work57ssrcvctoolscrtvcstartupsrcstartupexe_common.inl @ 78]
07 006ffc3c 7749fa29 find_exception!__scrt_common_main_seh+0xfa [d:agent_work57ssrcvctoolscrtvcstartupsrcstartupexe_common.inl @ 288]
08 006ffc4c 778a76b4 kernel32!BaseThreadInitThunk+0x19
09 006ffca8 778a7684 ntdll!__RtlUserThreadStart+0x2f
0a 006ffcb8 00000000 ntdll!_RtlUserThreadStart+0x1b
In this way, sometimes it is possible to look a little further in search of the reasons for the fall.