Uplift modeling tutorial. Part 1

The Big Data MTS team actively extracts knowledge from existing data and solves a large number of tasks for business. One of the types of machine learning tasks we face is uplift simulation tasks. Using this approach, the effect of communication with customers is assessed and the group that is most affected is selected.
This class of tasks is easy to implement, but it is not widely used in the literature on machine learning. A small series of articles prepared by Irina Elisova (iraelisova) and Maxim Shevchenko (maks-sh) can be considered as a guide to solving such problems. Within it, we will get acquainted with uplift models, consider how they differ from other approaches, and analyze their implementations.
You can’t just take and train a model
Experiment design
Types of customers
One model with a sign of communication
Two independent models
Two dependent models (dependent data representation)
Two dependent models (cross-dependence)
useful links
Sources
Introduction
Usually, products are promoted through communication with the client through various channels: SMS, push, chatbot messages on social networks and many others. The formation of segments for promotion is now being solved using machine learning in several ways:
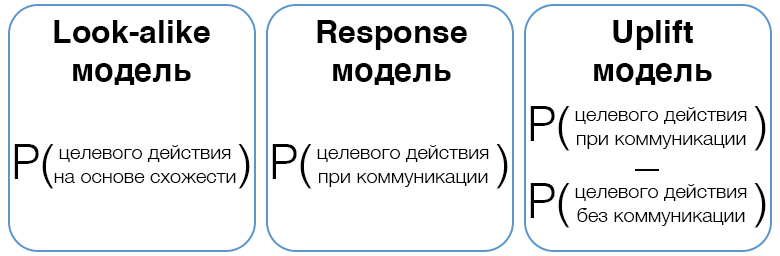
- Look-alike Model assesses the likelihood that the client will perform the target action. Known positive objects (for example, users who installed the application) and random negative objects (sampling a small subsample of all other clients who did not have this application) are used as a training sample. The model will try to look for customers, similar on those who have committed the target action.
- Response Model assesses the likelihood that the client will perform the target action subject to communication. In this case, the training set is the data collected after some interaction with customers. Unlike the first approach, we have real positive and negative observations at our disposal (for example, a client issued a credit card or refused).
- Uplift Model evaluates the net effect of communication, trying to select only those customers who will perform the target action only in our interaction. The model estimates the difference in customer behavior in the presence of exposure and in its absence.
When should uplift be predicted? Usually it is used when the target action is performed by customers with a sufficiently high probability without any communication. For example, we want to advertise a fairly popular product, but do not want to spend a budget on customers who would buy this product without us. If the product is not very popular and it is mainly bought only with promotion, then the task boils down to response modeling.
You can’t just take and train a model
To optimize the effect of the impact, I want to calculate the difference in the reactions of a person in the presence of communication and in its absence. The problem is that we cannot simultaneously make communication (for example, send SMS) and not make communication (not send SMS). Denote the delta of potential reactions th man . This quantity is called causal effect:
Where – the potential reaction of a person if there was communication with him,
– a potential human reaction if there was no communication.

Knowing the characteristic description th object , you can enter the conditional averaged effect of the impact CATE (Conditional Average Treatment Effect):
Nor causal effect nor for of the th object we observe, and, accordingly, we can’t optimize. Therefore, we proceed to the assessment or specific object uplift formula:
Where – the observed reaction of the client as a result of a marketing campaign, which is determined as follows:
Where – flag that the object hit the target (treatment) the group where the communication was, – flag that the object fell into the control (control) a group where there was no communication.
It is worth noting that the formula for uplift is applicable only under the following Conditional Independence Assumption (CIA) assumption: the separation into the target and control groups occurs randomly, and not depending on the value of some attribute. Potential object reaction – this is only a consequence of the characteristics of this object (for example, the installation of an application for renting apartments depends on the age and city of residence), which appears before he gets into any group (target or control). Briefly, this can be written as:
In this case, the observed reaction of the object already depends on the separation into the target and control group, as follows from the definition.
Experiment design
So, we need to evaluate the difference between two events that are mutually exclusive for a particular client (either we communicate with a person or not; you cannot simultaneously perform these two actions). That is why, to build uplift models, additional requirements are imposed on the source data.
To obtain a training sample for uplift modeling, it is necessary to conduct an experiment:
- To randomly divide the representative part of the client base into target and control groups;
- Launch a marketing campaign pilot to a target group.
The only difference between the experiment and the future campaign should be the fact that in the first case, we select random customers for interaction, and in the second, customers based on the predicted uplift value. If the marketing campaign is significantly different from the experiment used to collect data on the implementation of targeted actions by customers, then the constructed model may be less reliable and accurate.
The collected data on the responses to the marketing proposal obtained as part of such an experiment will allow us to further build the uplift forecasting model.
Before conducting the main campaign, it is recommended, similarly to the experiment, to randomly select a small part of the client base and divide it into control and target groups. Using these data, it will be possible not only to adequately assess the effectiveness of the campaign, but also to collect additional data for further retraining of the model.
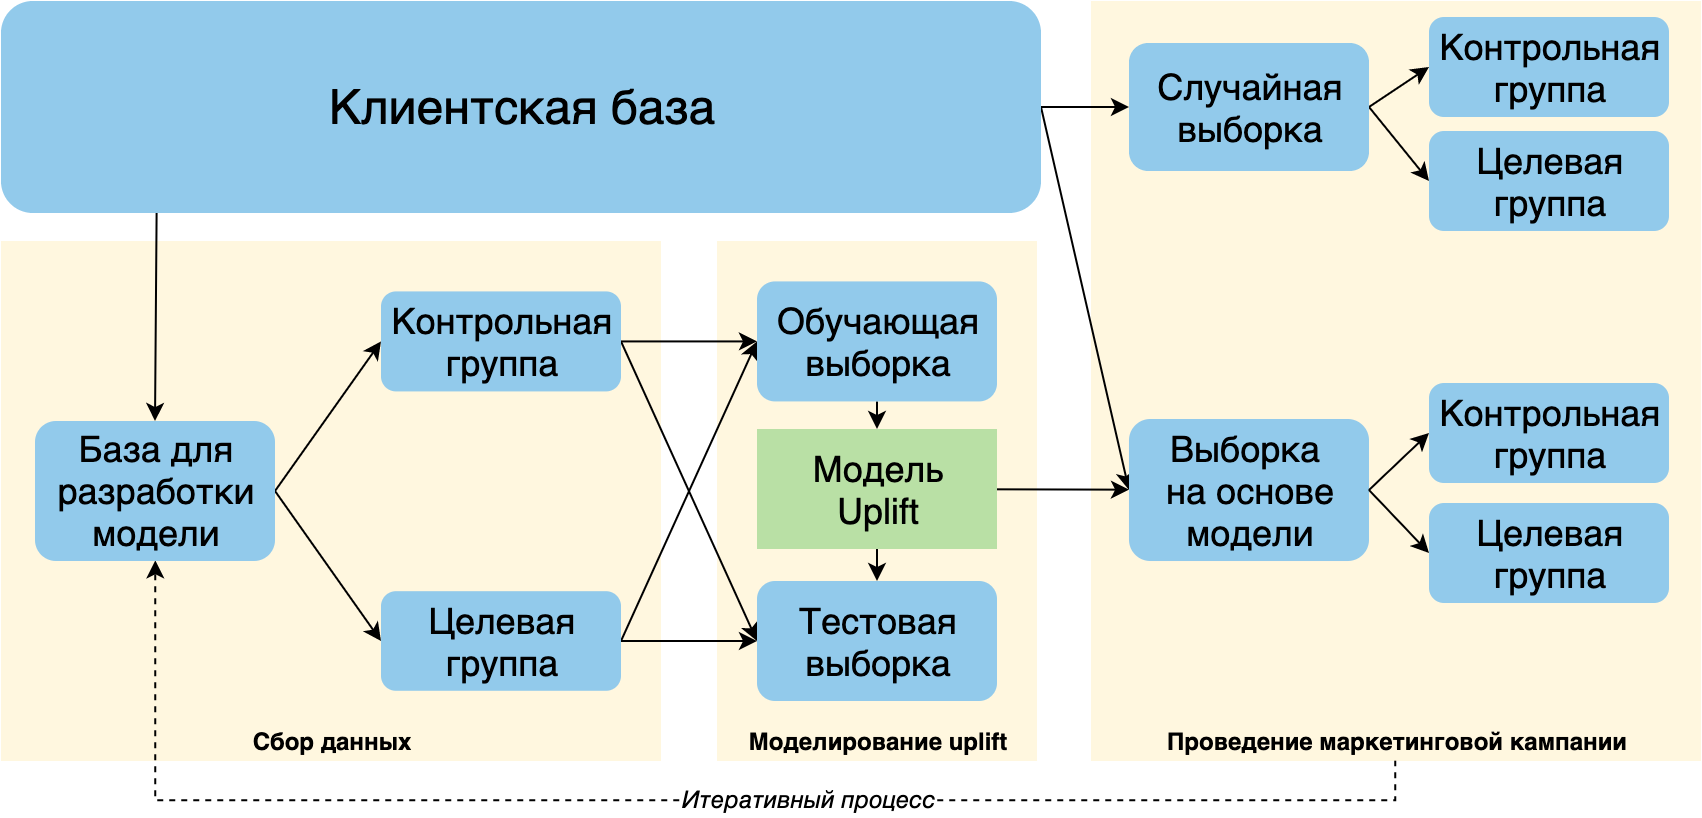
The scheme is taken and adapted from [1]
In addition, it is recommended to configure the development of the uplift model and launch the campaign as an iterative process: at each iteration, new training data about the responses will be collected, which consists of combining a random subset of clients and clients selected by the model.
I would not want to use the results of the impact on the customers selected by the model as a training sample, since the customers were not taken randomly. However, these data are of great value, so they should be studied and used to further improve the model and increase the response from future campaigns.
Types of customers
It is customary to distinguish 4 types of clients by reaction to communication:

- Do Not Not Disturbs – a person who will react negatively if you communicate with him.
- Lost (Lost Causes) – a person who never performs the target action, regardless of communication. Interaction with such clients does not bring additional income, but creates additional costs.
- Loyal (Sure Things) – a person who will respond positively, no matter what. This is the most loyal kind of customers. By analogy with the previous paragraph, such customers also spend the budget.
- Persuaded (Persuadables) – this is a person who responds positively to a proposal, but in his absence would not have performed the target action. These are the people whom we would like to define as our model in order to communicate with them.
It is worth noting that, depending on the client base and company features, some of these types of clients may be missing. In addition, the implementation of the target action strongly depends on various characteristics of the campaign itself, for example, the interaction channel or the type and size of the proposed marketing offer. To maximize profits, you should also select these parameters.
Thus, predicting uplift and choosing the top predictions, we want to find only one of four types – convinced. There are several ways to do this.
One model with a sign of communication
Treatment Dummy approach, Solo model approach, Single model approach, S-Learner
The simplest and most intuitive solution: the model learns simultaneously in two groups, while the binary communication flag acts as an additional feature. We scream each object from the test sample twice: with the communication flag equal to 1 and equal to 0. Subtracting the probabilities for each observation, we obtain the desired uplift.
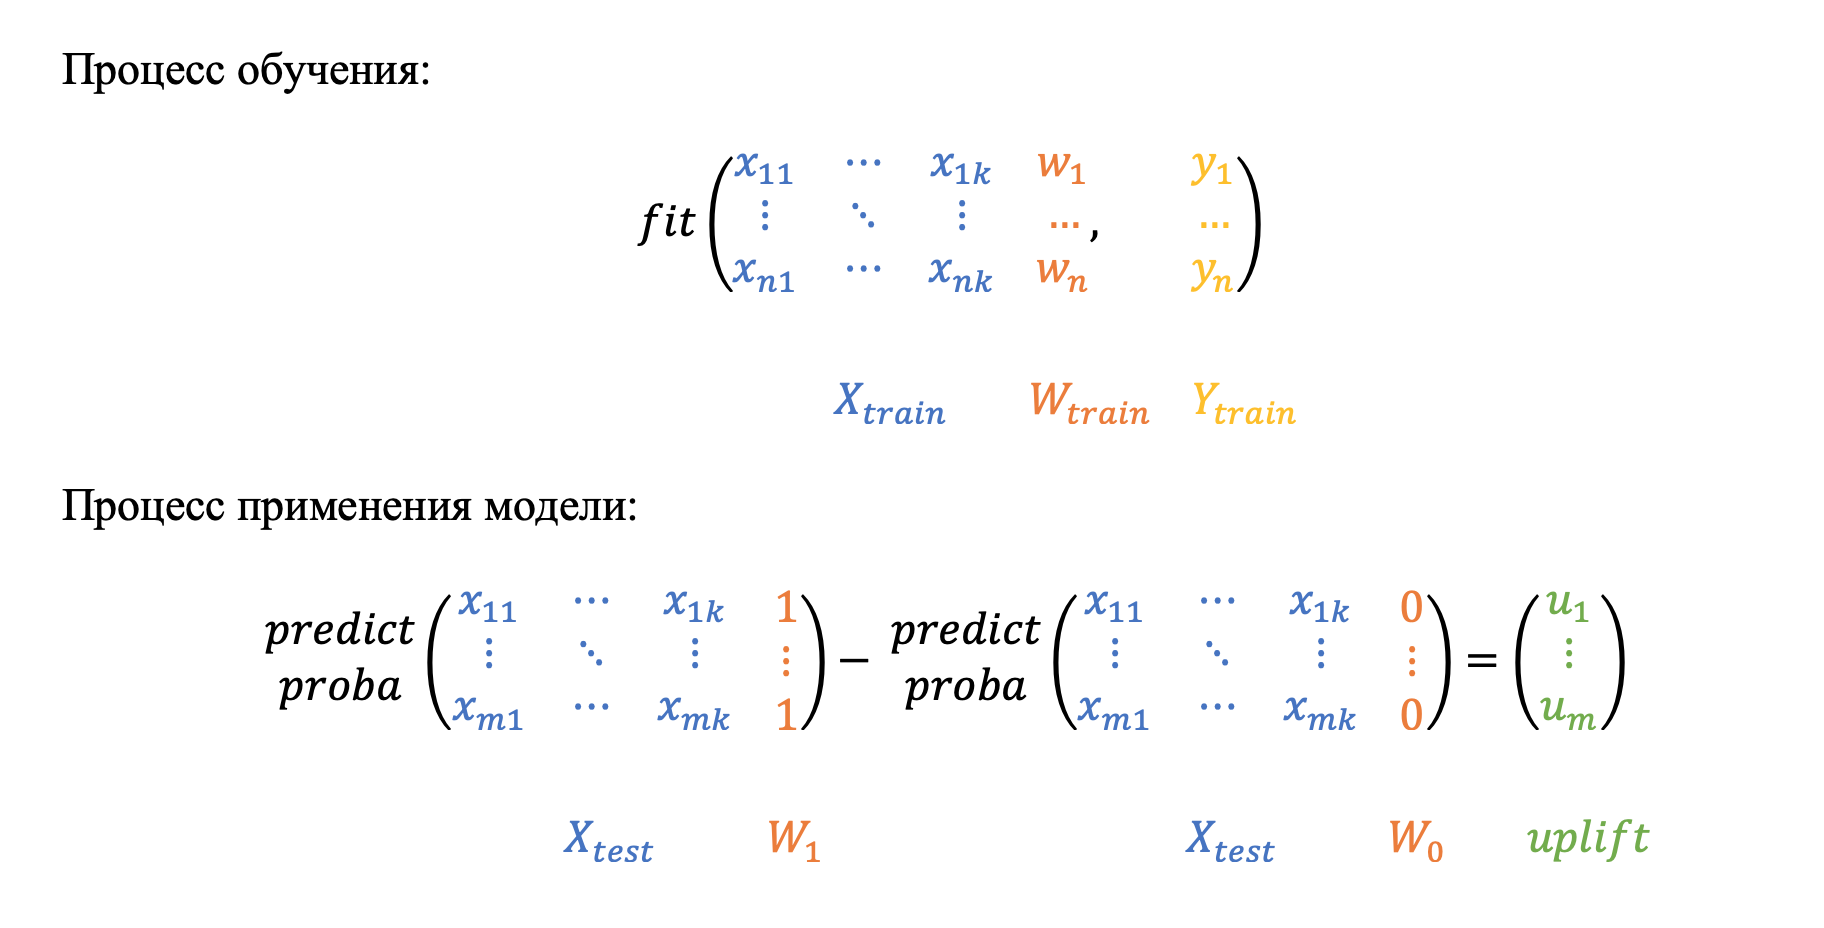
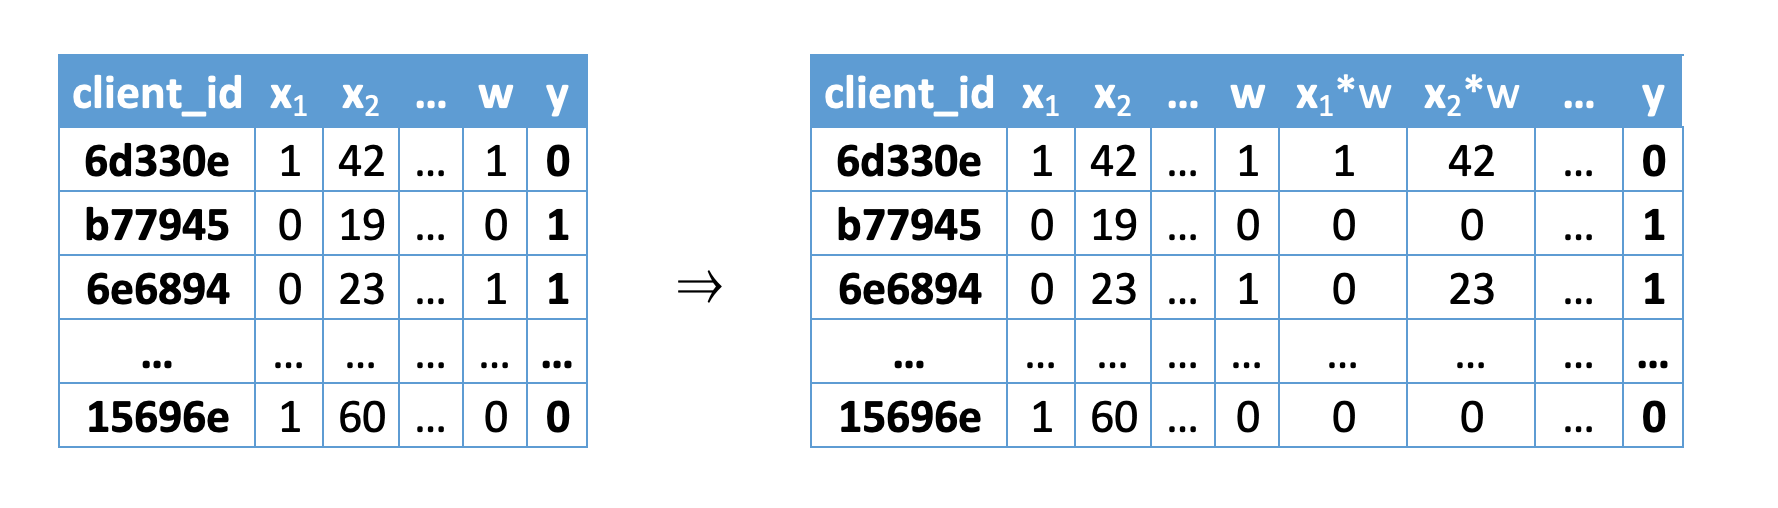
In some articles, for example [2], it is proposed to double the number of features by adding the product of each feature to the interaction flag: :
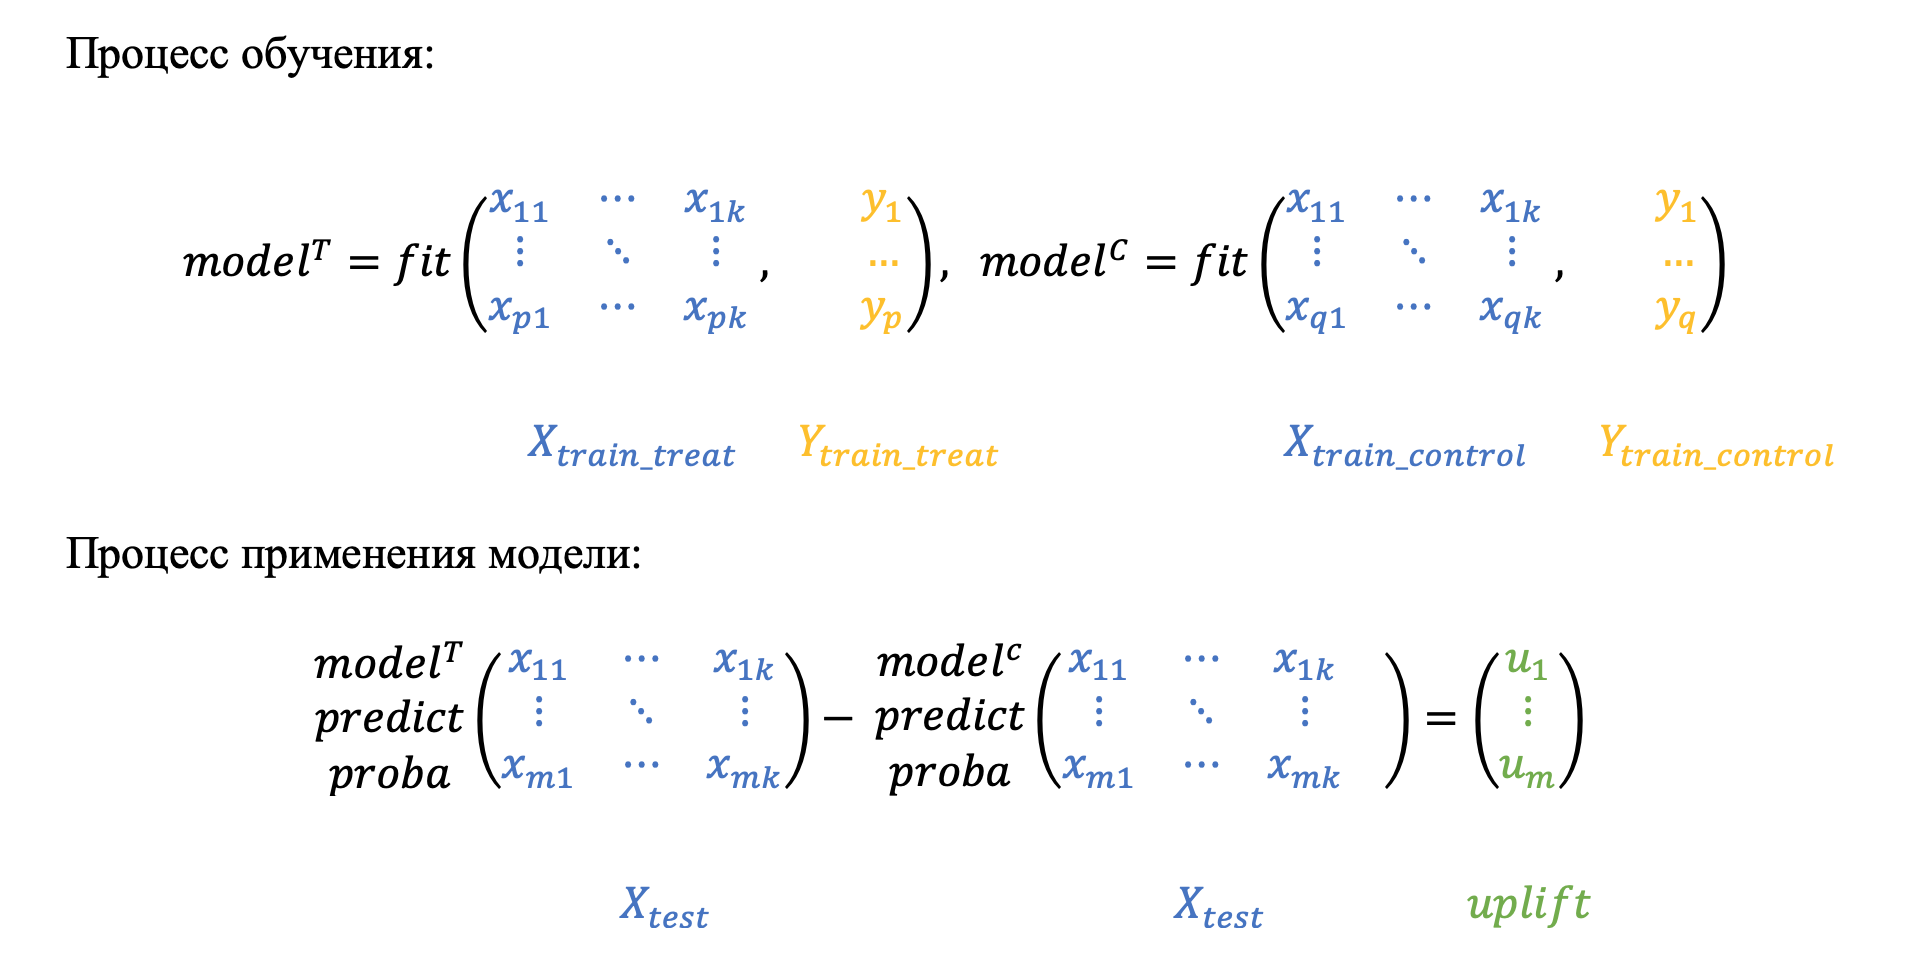
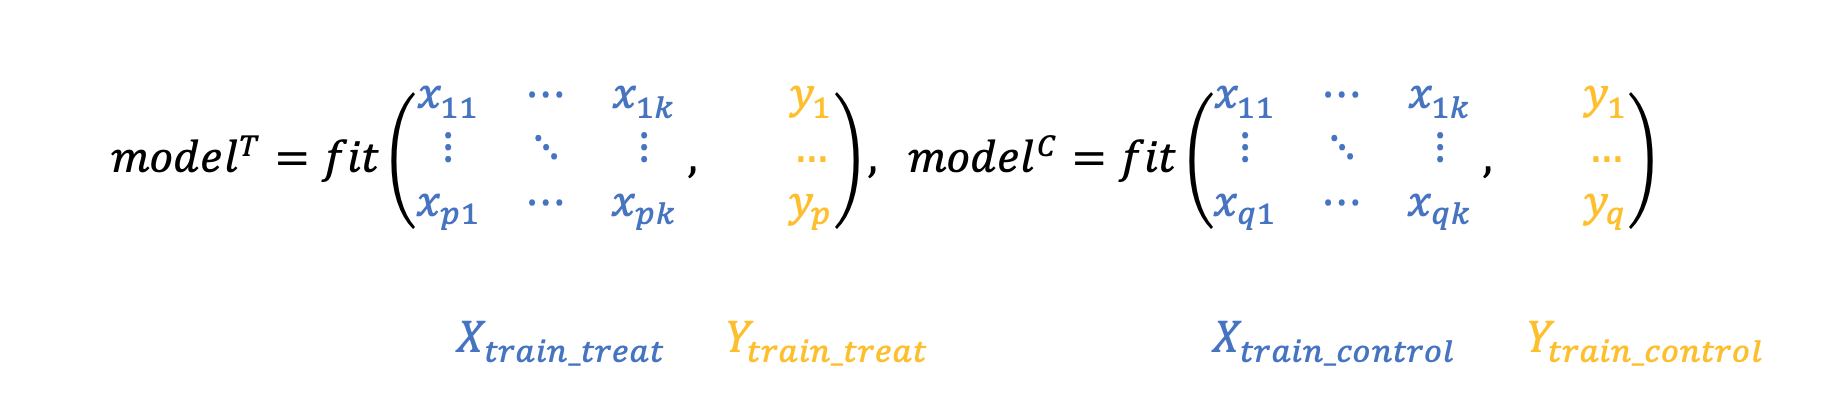
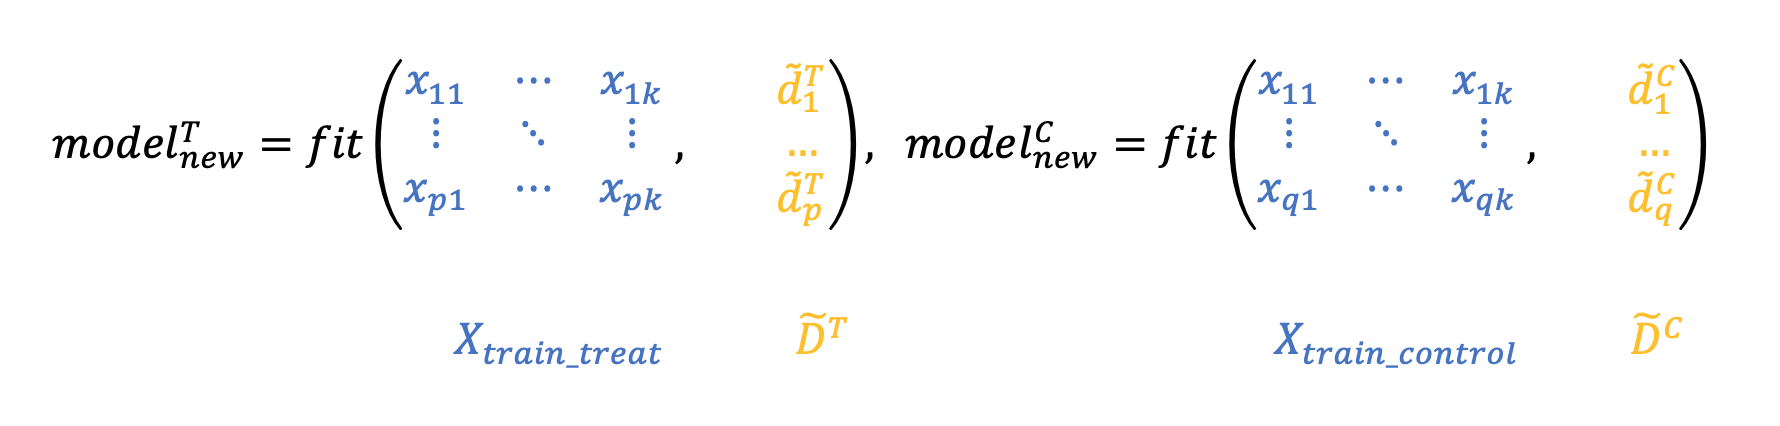
Two independent models
Two models approach, T-learner, difference two models
The approach with two models is one of the most popular and is quite common in articles, for example [3] and [4]. The method consists in a separate simulation of two conditional probabilities on the target and control groups, namely:
- The first model is being built that estimates the likelihood of performing the target action among the clients with whom we interacted.
- A second model is being built, evaluating the same probability, but among customers with whom we did not communicate.
- Then, for each client, the difference in the probability estimates of the two models is calculated.
Two dependent models (dependent data representation)
Dependent Data Representation
The dependent data view approach presented in [5], based on the classifier chain method, originally developed for multiclass classification problems. The idea is that if available various labels can be built various classifiers, each of which solves the problem of binary classification. In the learning process, each subsequent classifier uses the predictions of the previous ones as additional attributes. The authors of this method suggested using the same idea to solve the problem of uplift modeling in two stages. First, we train the classifier according to control data:
then make predictions as a new feature for training the second classifier on test data, thereby introducing a relationship between two data sets:
To get the uplift for each observation, we calculate the difference:
So the second classifier studies the difference between the expected result in the test and control, i.e. uplift itself.
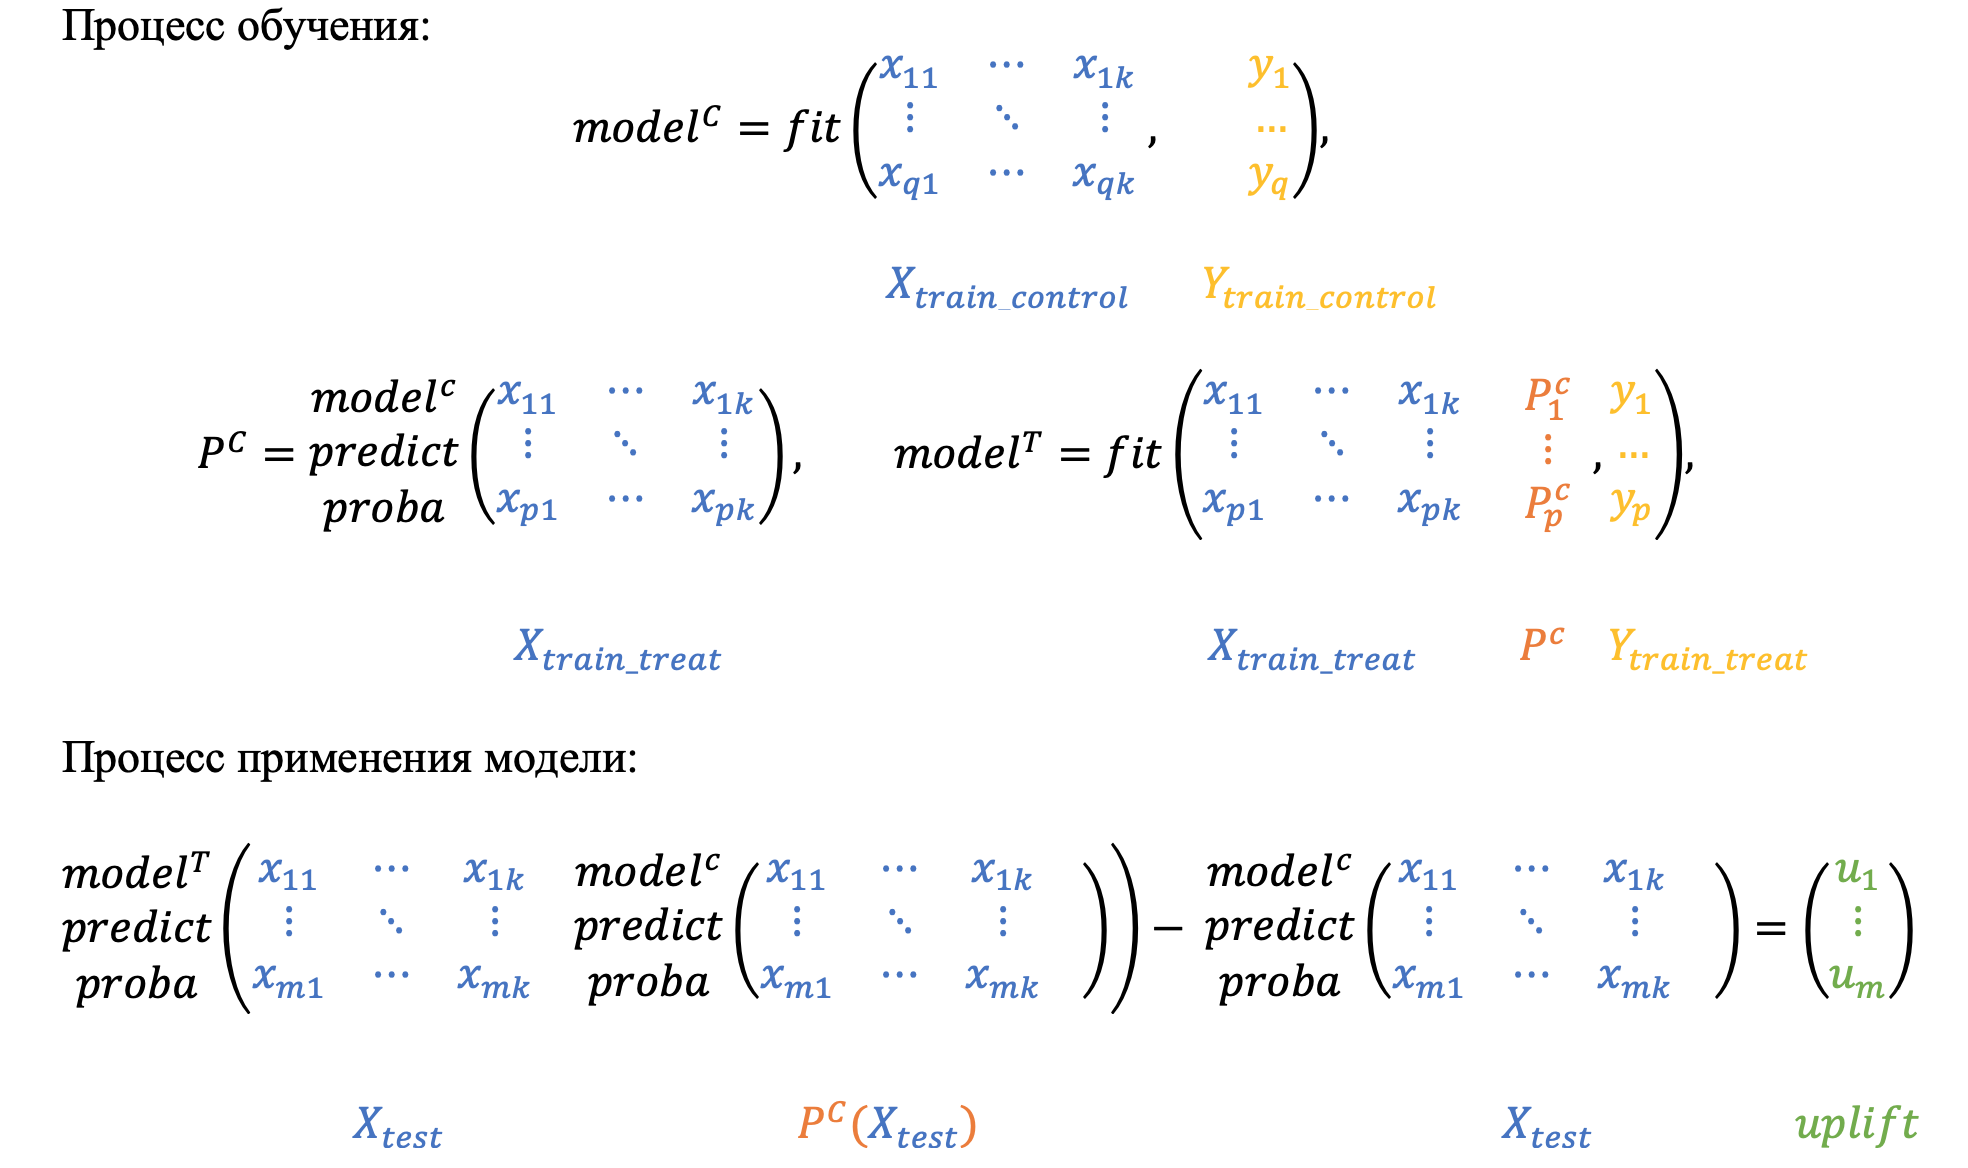
Similarly, you can first train the classifier and then use its predictions as a sign for the classifier .
Two dependent models (cross-dependence)
X-learner
The method is based on the construction of two models, in the same way as in the two previous approaches. Authors [6] recommend using it when the target group is small enough. In this case, there is a risk that the model built on the target group will have insufficient generalizing ability. Therefore, a cross-dependence of two models is created in order to strengthen one model with the data of another.
1. First, we train two models in parallel: one on the control group, the other on the target group (as in the method with two independent models):
2. Then we transform both target variables using the predictions of the control model on the data of the target group and the predictions of the target model on the data of the control group. The values obtained are denoted as and and are called the sane effect of exposure.
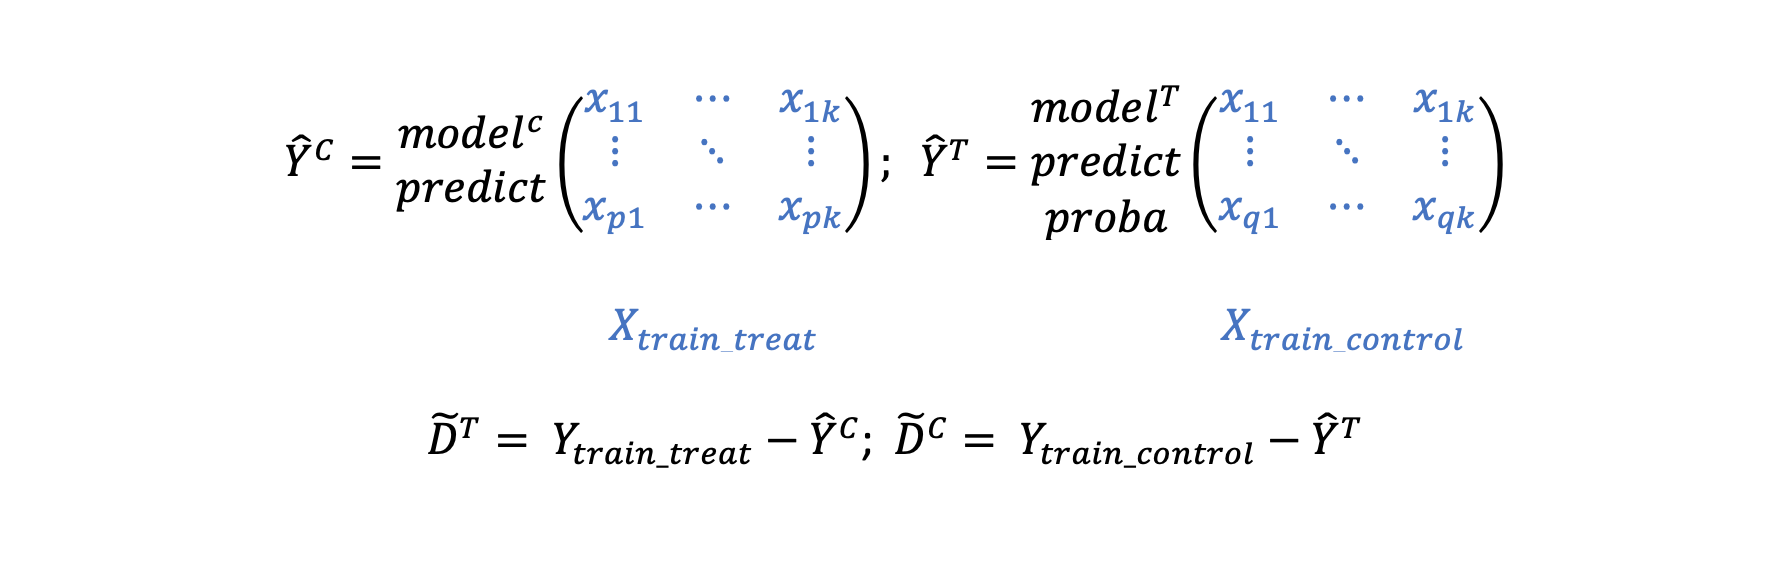
If grades and would be not predictions, but real quantities (which we actually cannot observe), then and would be equal to uplift, i.e.
3. Train two new models on converted targets and :
4. Weighted with some coefficient the sum of the predictions of these models will be uplift. Therefore, the process of applying the model will look as follows:

It is recommended to choose if the size of the target group is large compared to the size of the control group, and if vice versa. Moreover, can be considered not only as a constant, but as some function of an object – .
Conclusion
This article examined the features of uplift models, the process of collecting data and conducting marketing campaigns, as well as the basic methods of modeling uplift. In the next part, we will continue to talk about more interesting approaches.
useful links
- Jupyter notebook using python scikit-uplift library example from Maxim Shevchenko (maks-sh)
- Uplift Modeling Report from Irina Elisova (iraelisova) to Data Fest 6
- Report about uplift modeling from Valery Babushkin (venheads)
- Report on sending personal messages to individuals to bank customers from Alexander Fonarev to Data Fest 5
- Profit Driven Business Analytics by Verbeke, Wouter & Baesens, Bart & Bravo, Cristián – a great book with a chapter on uplift modeling
Sources
- [1] Verbeke, Wouter & Baesens, Bart & Bravo, Cristián. (2018). Profit Driven Business Analytics: A Practitioner’s Guide to Transforming Big Data into Added Value.
- [2] Lo, Victor. (2002). The True Lift Model – A Novel Data Mining Approach to Response Modeling in Database Marketing … SIGKDD Explorations. 4. 78-86.
- [3] Radcliffe, N.J. (2007). Using control groups to target on predicted lift: Building and assessing uplift model. Direct Market J Direct Market Assoc Anal Council, 1: 14–21, 2007.
- [4] Nassif, Houssam & Kuusisto, F. & Burnside, Elizabeth & Shavlik, J … (2014). Uplift modeling with ROC: An SRL case study. CEUR Workshop Proceedings. 1187. 40-45.
- [5] Betlei, Artem & Diemert, Eustache & Amini, Massih-Reza. (2018). Uplift Prediction with Dependent Feature Representation in Imbalanced Treatment and Control Conditions: 25th International Conference, ICONIP 2018, Siem Reap, Cambodia, December 13-16, 2018, Proceedings, Part V. 10.1007 / 978-3-030-04221-9_5.
- [6] Zhao, Yan & Fang, Xiao & Simchi-Levi, David. (2017). Uplift Modeling with Multiple Treatments and General Response Types. 10.1137 / 1.9781611974973.66.
- [7] Gutierrez, P., & Gérardy, J. Y. (2017). Causal Inference and Uplift Modeling: A Review of the Literature. In International Conference on Predictive Applications and APIs (pp. 1-13).